

Importance of Dendrobium officinale in improving the adverse effects of high-fat diet on mice associated with intestinal contents microbiota
- PMID: 35967811
- PMCID: PMC9365999
- DOI: 10.3389/fnut.2022.957334
Importance of Dendrobium officinale in improving the adverse effects of high-fat diet on mice associated with intestinal contents microbiota
Abstract
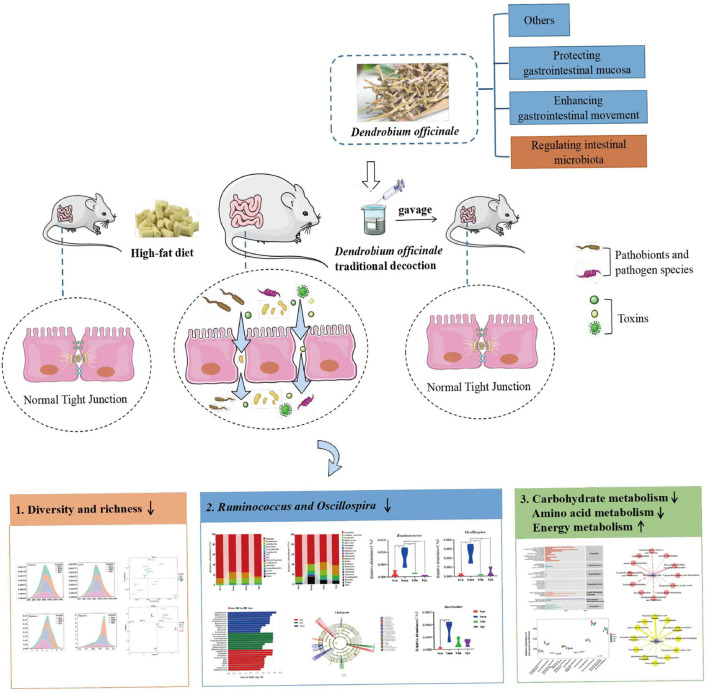
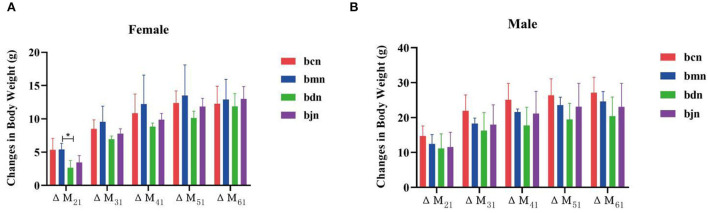
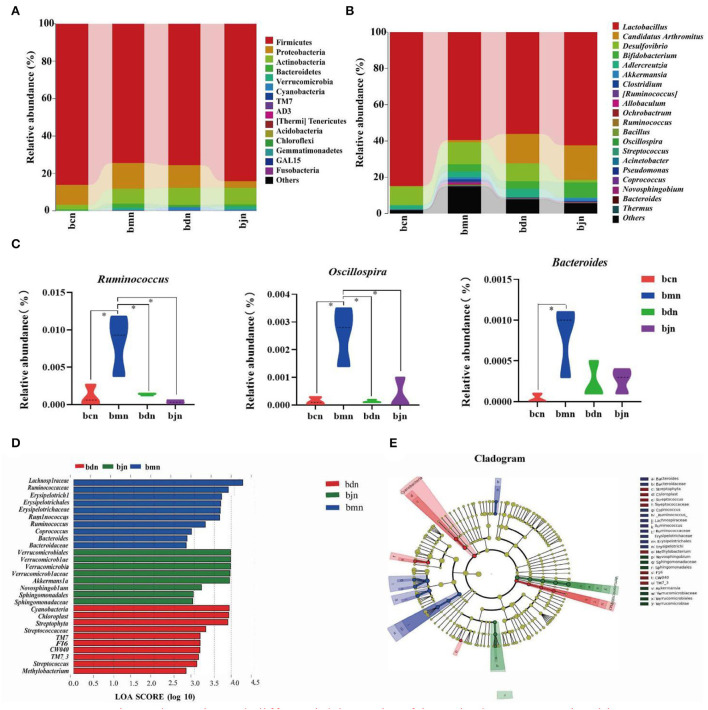
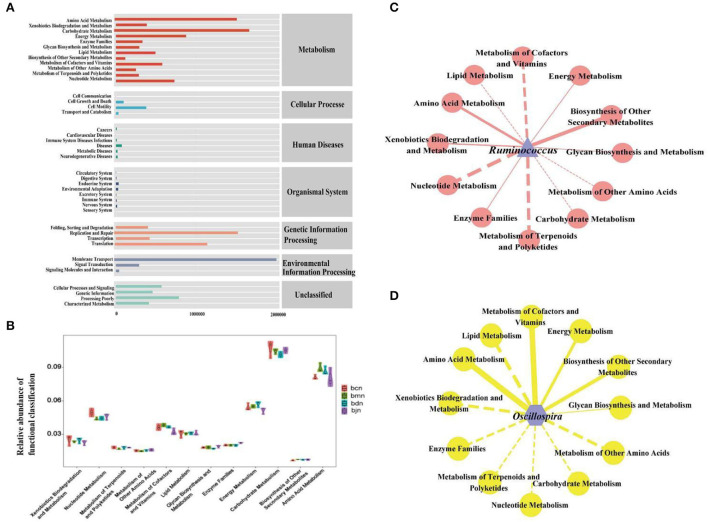
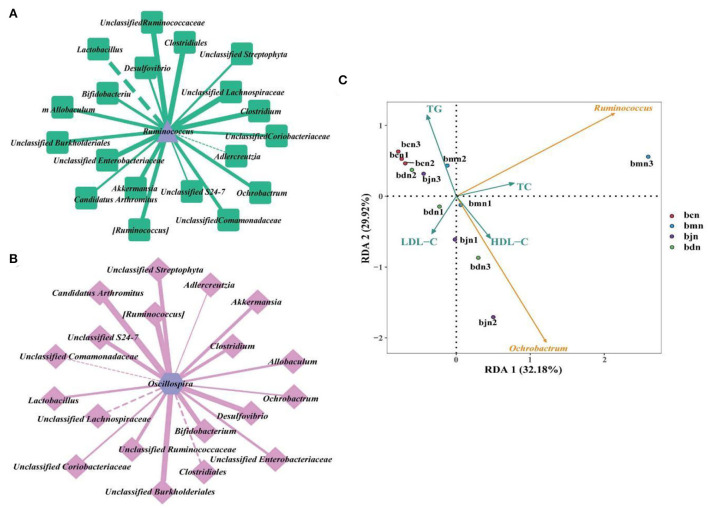
A growing body of evidence suggests that the disturbance of intestinal microbiota induced by high-fat diet is the main factor causing many diseases. Dendrobium officinale (DO), a medicinal and edible homologous Chinese herbal medicine, plays essential role in regulating intestinal microbiota. However, the extent of DO on the intestinal contents microbiota in mice fed with a high-fat diet still remains unclear. Therefore, this study explored the role of intestinal contents microbiota in the regulation of adverse effects caused by high-fat diet by DO from the perspective of intestinal microecology. Twenty-four mice were randomly distributed into the normal saline-treated basal diet (bcn), normal saline-treated high-fat diet (bmn), 2.37 g kg-1 days-1 DO traditional decoction-treated high-fat diet (bdn) and 1.19 g kg-1 days-1 lipid-lowering decoction-treated high-fat diet (bjn) groups for 40 days. Subsequently, we assessed the changes in body weight, serum total cholesterol (TC), total triacylglycerol (TG), low density lipoprotein-cholesterol (LDL-C), high density lipoprotein-cholesterol (HDL-C) levels, and the characteristics of intestinal contents microbiota. Results demonstrated that DO exerted the modulating effect on the changes in body weight, TG, TC, LDL-C, and HDL-C levels. Besides, DO decreased the richness and diversity of intestinal contents microbiota, and altered the structure as a whole. Dominant bacteria, Ruminococcus and Oscillospira, varied significantly and statistically. Moreover, DO influenced the carbohydrate, amino acid, and energy metabolic functions. Furthermore, Ruminococcus and Oscillospira presented varying degrees of inhibition/promotion of TG, TC, LDL-C, and HDL-C. Consequently, we hypothesized that Ruminococcus and Oscillospira, as dominant bacteria, played key roles in the treatment of diseases associated with a high-fat diet DO.
Keywords: Dendrobium officinale; diversity; dominant bacteria; high-fat diet; intestinal contents microbiota.
Copyright © 2022 Li, Deng, Zheng, Qiao, Peng, Xiao and Tan.
Conflict of interest statement
The authors declare that the research was conducted in the absence of any commercial or financial relationships that could be construed as a potential conflict of interest.
Figures
Similar articles
-
Lingguizhugan decoction alleviates obesity in rats on a high-fat diet through the regulation of lipid metabolism and intestinal microbiota.Front Microbiol. 2024 Nov 13;15:1462173. doi: 10.3389/fmicb.2024.1462173. eCollection 2024. Front Microbiol. 2024. PMID: 39606109 Free PMC article.
-
Bacterial diversity in intestinal mucosa of mice fed with Dendrobium officinale and high-fat diet.3 Biotech. 2021 Jan;11(1):22. doi: 10.1007/s13205-020-02558-x. Epub 2021 Jan 3. 3 Biotech. 2021. PMID: 33442520 Free PMC article.
-
Naoxintong Capsule Alternates Gut Microbiota and Prevents Hyperlipidemia in High-Fat-Diet Fed Rats.Front Pharmacol. 2022 Mar 21;13:843409. doi: 10.3389/fphar.2022.843409. eCollection 2022. Front Pharmacol. 2022. PMID: 35387330 Free PMC article.
-
[Gynostemma pentaphyllum saponins alleviate non-alcoholic fatty liver disease in rats by regulating intestinal flora and short-chain fatty acid metabolism].Zhongguo Zhong Yao Za Zhi. 2022 May;47(9):2500-2508. doi: 10.19540/j.cnki.cjcmm.20211208.401. Zhongguo Zhong Yao Za Zhi. 2022. PMID: 35531697 Chinese.
-
Dietary methionine restriction improves the gut microbiota and reduces intestinal permeability and inflammation in high-fat-fed mice.Food Funct. 2019 Sep 1;10(9):5952-5968. doi: 10.1039/c9fo00766k. Epub 2019 Sep 2. Food Funct. 2019. PMID: 31475718
Cited by
-
Construction of microneedle of Atractylodes macrocephala Rhizoma aqueous extract and effect on mammary gland hyperplasia based on intestinal flora.Front Endocrinol (Lausanne). 2023 Feb 28;14:1158318. doi: 10.3389/fendo.2023.1158318. eCollection 2023. Front Endocrinol (Lausanne). 2023. PMID: 36926033 Free PMC article.
-
The diarrheal mechanism of mice with a high-fat diet in a fatigued state is associated with intestinal mucosa microbiota.3 Biotech. 2023 Mar;13(3):77. doi: 10.1007/s13205-023-03491-5. Epub 2023 Feb 6. 3 Biotech. 2023. PMID: 36761339 Free PMC article.
-
An overview of traditional Chinese medicine affecting gut microbiota in obesity.Front Endocrinol (Lausanne). 2023 Mar 1;14:1149751. doi: 10.3389/fendo.2023.1149751. eCollection 2023. Front Endocrinol (Lausanne). 2023. PMID: 36936157 Free PMC article. Review.
-
Brain-bacteria-gut axis and oxidative stress mediated by intestinal mucosal microbiota might be an important mechanism for constipation in mice.3 Biotech. 2023 Jun;13(6):192. doi: 10.1007/s13205-023-03580-5. Epub 2023 May 15. 3 Biotech. 2023. PMID: 37205176 Free PMC article.
-
Gut-brain axis mediated by intestinal content microbiota was associated with Zhishi Daozhi decoction on constipation.Front Cell Infect Microbiol. 2025 Feb 3;15:1539277. doi: 10.3389/fcimb.2025.1539277. eCollection 2025. Front Cell Infect Microbiol. 2025. PMID: 39963403 Free PMC article.
References
-
- Yang B, Hu YZ, Zhang F, Xiao JF, Hu Y. Interventional effect of chrysin on rabbit atherosclerosis induced by high fat diet. Herald Med. (2020) 39:1331–5. 10.3870/j.issn.1004-0781.2020.10.002 - DOI
-
- Chu JR, Gao RL, Zhao SP, Lu GP, Zhao D, Li JJ. Guidelines for the prevention and treatment of dyslipidemia in adults in China (2016 revised edition). Chin Circ J. (2016) 31:4–20. 10.3969/j.issn.1000-3614.2016.10.001 - DOI
LinkOut - more resources
Full Text Sources
Miscellaneous