

Abnormal bile acid metabolism is an important feature of gut microbiota and fecal metabolites in patients with slow transit constipation
- PMID: 35967856
- PMCID: PMC9366892
- DOI: 10.3389/fcimb.2022.956528
Abnormal bile acid metabolism is an important feature of gut microbiota and fecal metabolites in patients with slow transit constipation
Abstract
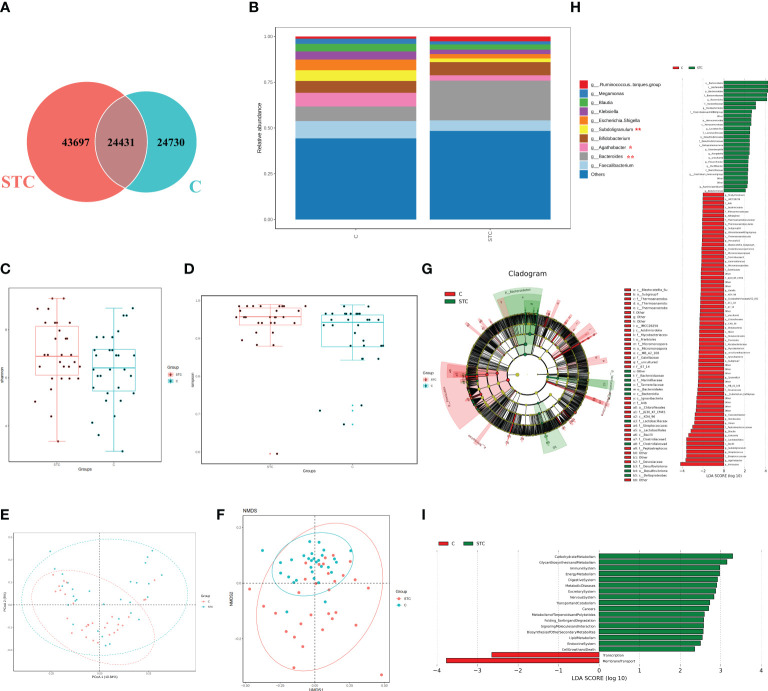
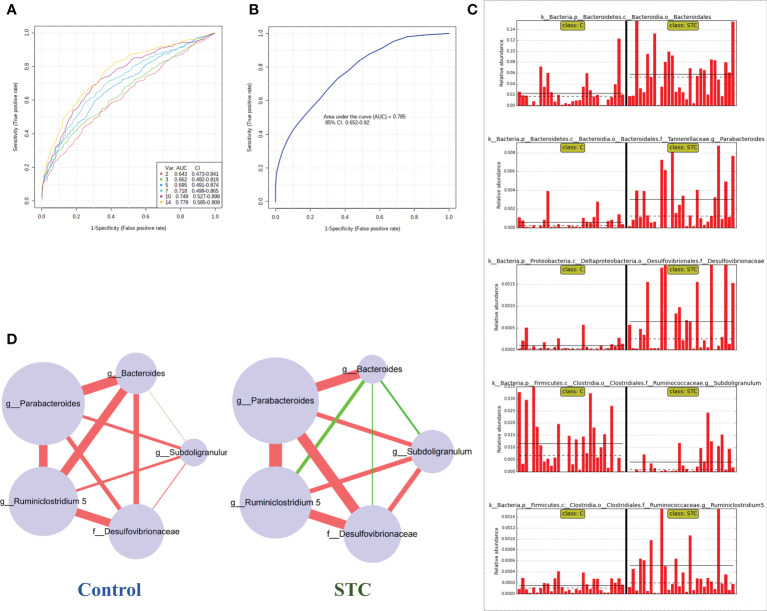
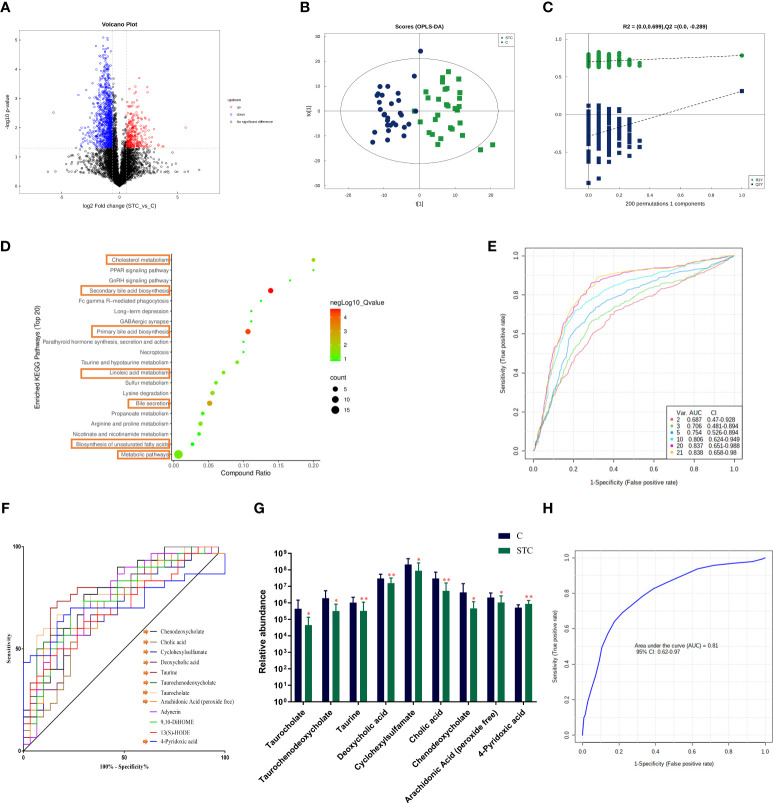
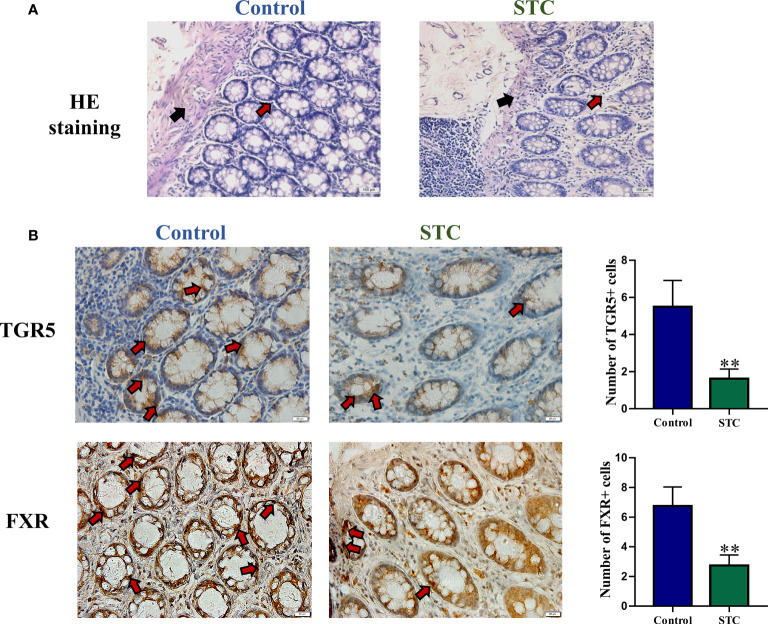
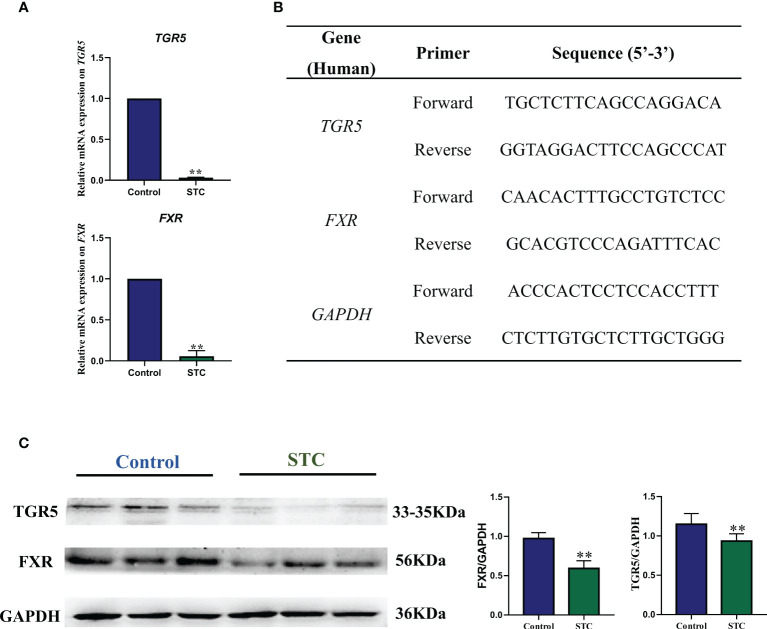
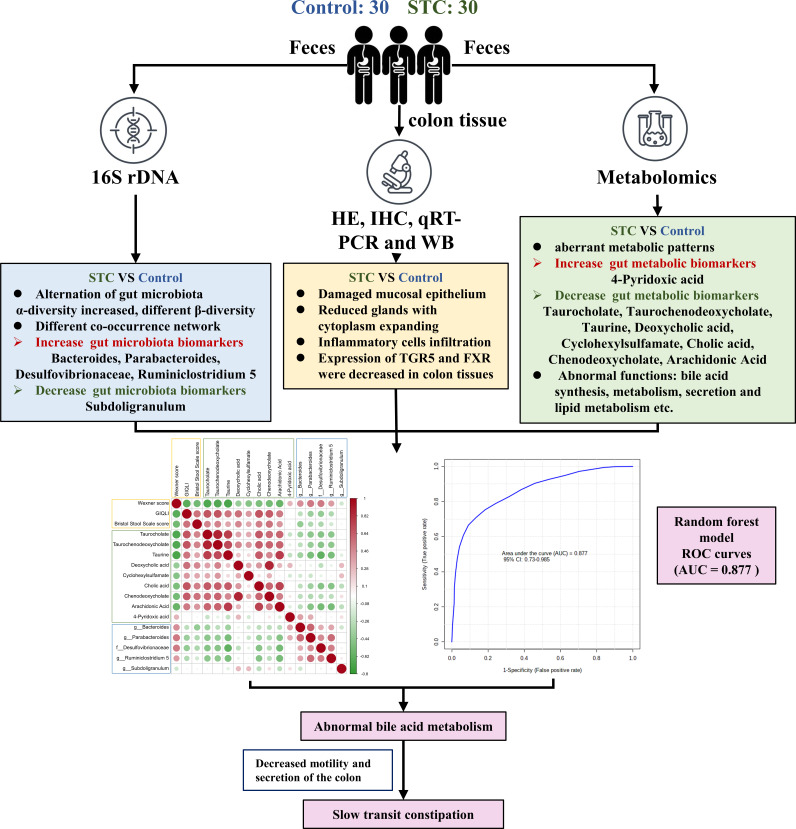
Destructions in the intestinal ecosystem are implicated with changes in slow transit constipation (STC), which is a kind of intractable constipation characterized by colonic motility disorder. In order to deepen the understanding of the structure of the STC gut microbiota and the relationship between the gut microbiota and fecal metabolites, we first used 16S rRNA amplicon sequencing to evaluate the gut microbiota in 30 STC patients and 30 healthy subjects. The α-diversity of the STC group was changed to a certain degree, and the β-diversity was significantly different, which indicated that the composition of the gut microbiota of STC patients was inconsistent with healthy subjects. Among them, Bacteroides, Parabacteroides, Desulfovibrionaceae, and Ruminiclostridium were significantly upregulated, while Subdoligranulum was significantly downregulated. The metabolomics showed that different metabolites between the STC and the control group were involved in the process of bile acids and lipid metabolism, including taurocholate, taurochenodeoxycholate, taurine, deoxycholic acid, cyclohexylsulfamate, cholic acid, chenodeoxycholate, arachidonic acid, and 4-pyridoxic acid. We found that the colon histomorphology of STC patients was significantly disrupted, and TGR5 and FXR were significantly downregulated. The differences in metabolites were related to changes in the abundance of specific bacteria and patients' intestinal dysfunction. Analysis of the fecal genomics and metabolomics enabled separation of the STC from controls based on random forest model prediction [STC vs. control (14 gut microbiota and metabolite biomarkers)-Sensitivity: 1, Specificity: 0.877]. This study provided a perspective for the diagnosis and intervention of STC related with abnormal bile acid metabolism.
Keywords: 16S rRNA amplicon sequencing; bile acid metabolism; diagnosis and intervention; metabolomics; slow transit constipation.
Copyright © 2022 Fan, Xu, Xie, Wang, Zhu, An, Li, Tian, Yan, Yu, Liu, Jia, Wang, Wang, Yang and Bian.
Conflict of interest statement
The authors declare that the research was conducted in the absence of any commercial or financial relationships that could be construed as a potential conflict of interest.
Figures
Similar articles
-
Analysis of Gut Microbiome and Metabolite Characteristics in Patients with Slow Transit Constipation.Dig Dis Sci. 2021 Sep;66(9):3026-3035. doi: 10.1007/s10620-020-06500-2. Epub 2020 Aug 7. Dig Dis Sci. 2021. PMID: 32767153
-
Integration of UPLC-MS/MS-based metabolomics and desorption electrospray ionization-mass spectrometry imaging reveals that Shouhui Tongbian Capsule alleviates slow transit constipation by regulating bile acid metabolism.J Chromatogr B Analyt Technol Biomed Life Sci. 2024 Oct 15;1247:124331. doi: 10.1016/j.jchromb.2024.124331. Epub 2024 Sep 30. J Chromatogr B Analyt Technol Biomed Life Sci. 2024. PMID: 39369590
-
Transdermal Administration of Volatile Oil from Citrus aurantium-Rhizoma Atractylodis Macrocephalae Alleviates Constipation in Rats by Altering Host Metabolome and Intestinal Microbiota Composition.Oxid Med Cell Longev. 2022 Jan 18;2022:9965334. doi: 10.1155/2022/9965334. eCollection 2022. Oxid Med Cell Longev. 2022. PMID: 35087623 Free PMC article.
-
Metabolomics Insights into Gut Microbiota and Functional Constipation.Metabolites. 2025 Apr 12;15(4):269. doi: 10.3390/metabo15040269. Metabolites. 2025. PMID: 40278398 Free PMC article. Review.
-
Gut microbiota: a new avenue to reveal pathological mechanisms of constipation.Appl Microbiol Biotechnol. 2022 Nov;106(21):6899-6913. doi: 10.1007/s00253-022-12197-2. Epub 2022 Oct 3. Appl Microbiol Biotechnol. 2022. PMID: 36190540 Review.
Cited by
-
Altered gut microbial profile is associated with differentially expressed fecal microRNAs in patients with functional constipation.Front Microbiol. 2024 Jan 11;14:1323877. doi: 10.3389/fmicb.2023.1323877. eCollection 2023. Front Microbiol. 2024. PMID: 38274754 Free PMC article.
-
Gut microbiota differences in children classified by extreme physical fitness and physical activity levels from a Chinese Cross-Sectional study.Sci Rep. 2025 Jul 1;15(1):21351. doi: 10.1038/s41598-025-05302-8. Sci Rep. 2025. PMID: 40594421 Free PMC article.
-
Correlation of the intestinal flora and its metabolites with the colonic transport function in functional constipation.Front Microbiol. 2025 May 21;16:1591697. doi: 10.3389/fmicb.2025.1591697. eCollection 2025. Front Microbiol. 2025. PMID: 40469730 Free PMC article.
-
Clinical efficacy of non-pharmacological treatment of functional constipation: a systematic review and network meta-analysis.Front Cell Infect Microbiol. 2025 May 29;15:1565801. doi: 10.3389/fcimb.2025.1565801. eCollection 2025. Front Cell Infect Microbiol. 2025. PMID: 40510802 Free PMC article.
-
A Potential Use of Vidarabine: Alleviation of Functional Constipation Through Modulation of the Adenosine A2A Receptor-MLC Signaling Pathway and the Gut Microbiota.Int J Mol Sci. 2024 Nov 28;25(23):12810. doi: 10.3390/ijms252312810. Int J Mol Sci. 2024. PMID: 39684522 Free PMC article.
References
Publication types
MeSH terms
Substances
LinkOut - more resources
Full Text Sources