. 2022 Jun:109:104369.
doi: 10.1016/j.jfca.2021.104369. Epub 2022 Jan 7.

Iodine in Foods and Dietary Supplements: A Collaborative Database Developed by NIH, FDA and USDA

Affiliations

Iodine in Foods and Dietary Supplements: A Collaborative Database Developed by NIH, FDA and USDA

Pamela R Pehrsson et al. J Food Compost Anal. 2022 Jun.

Abstract

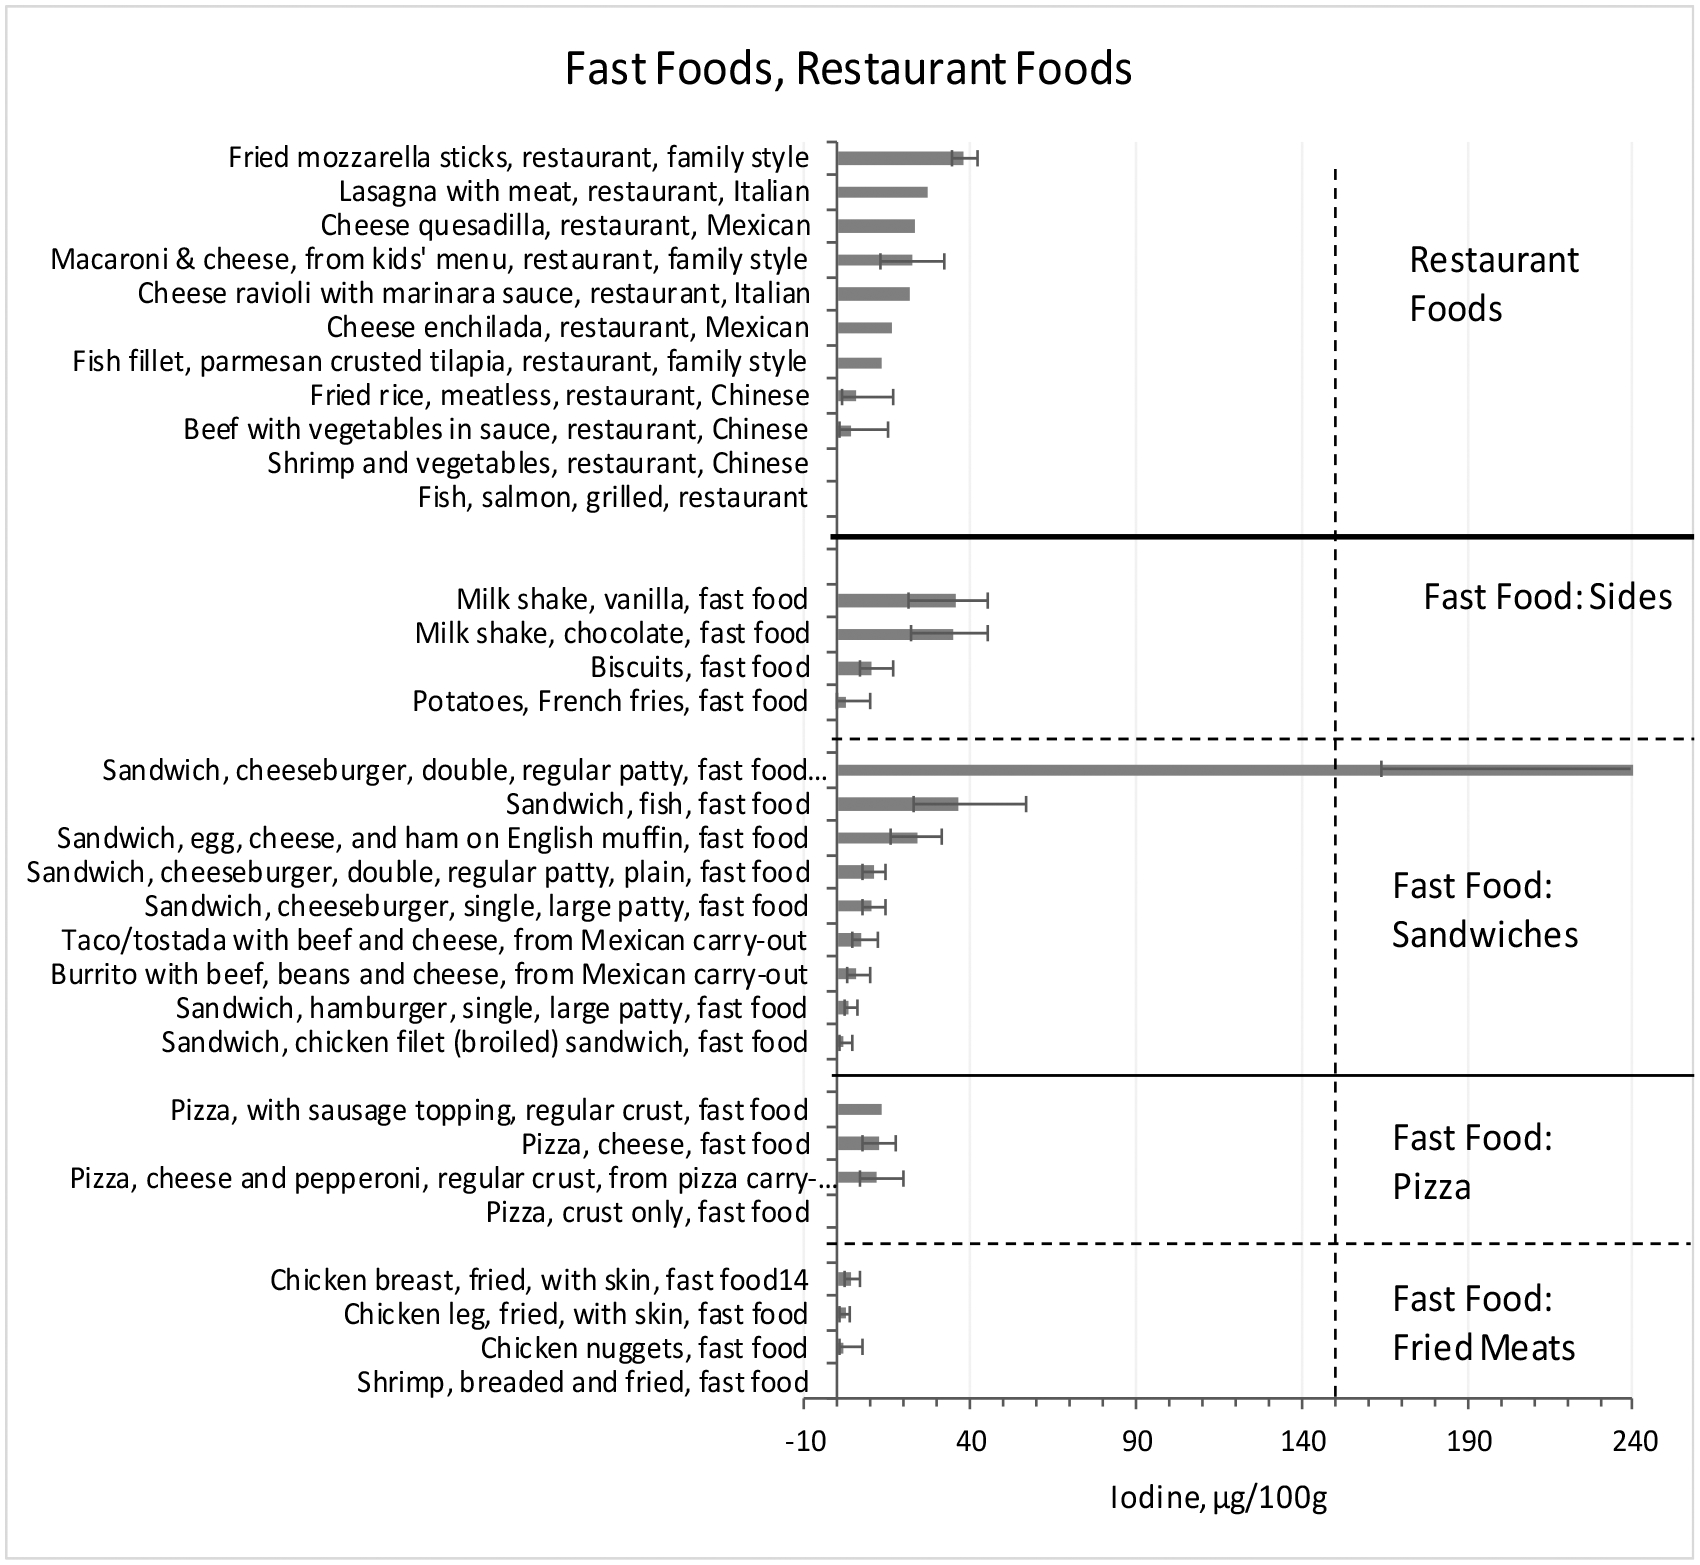
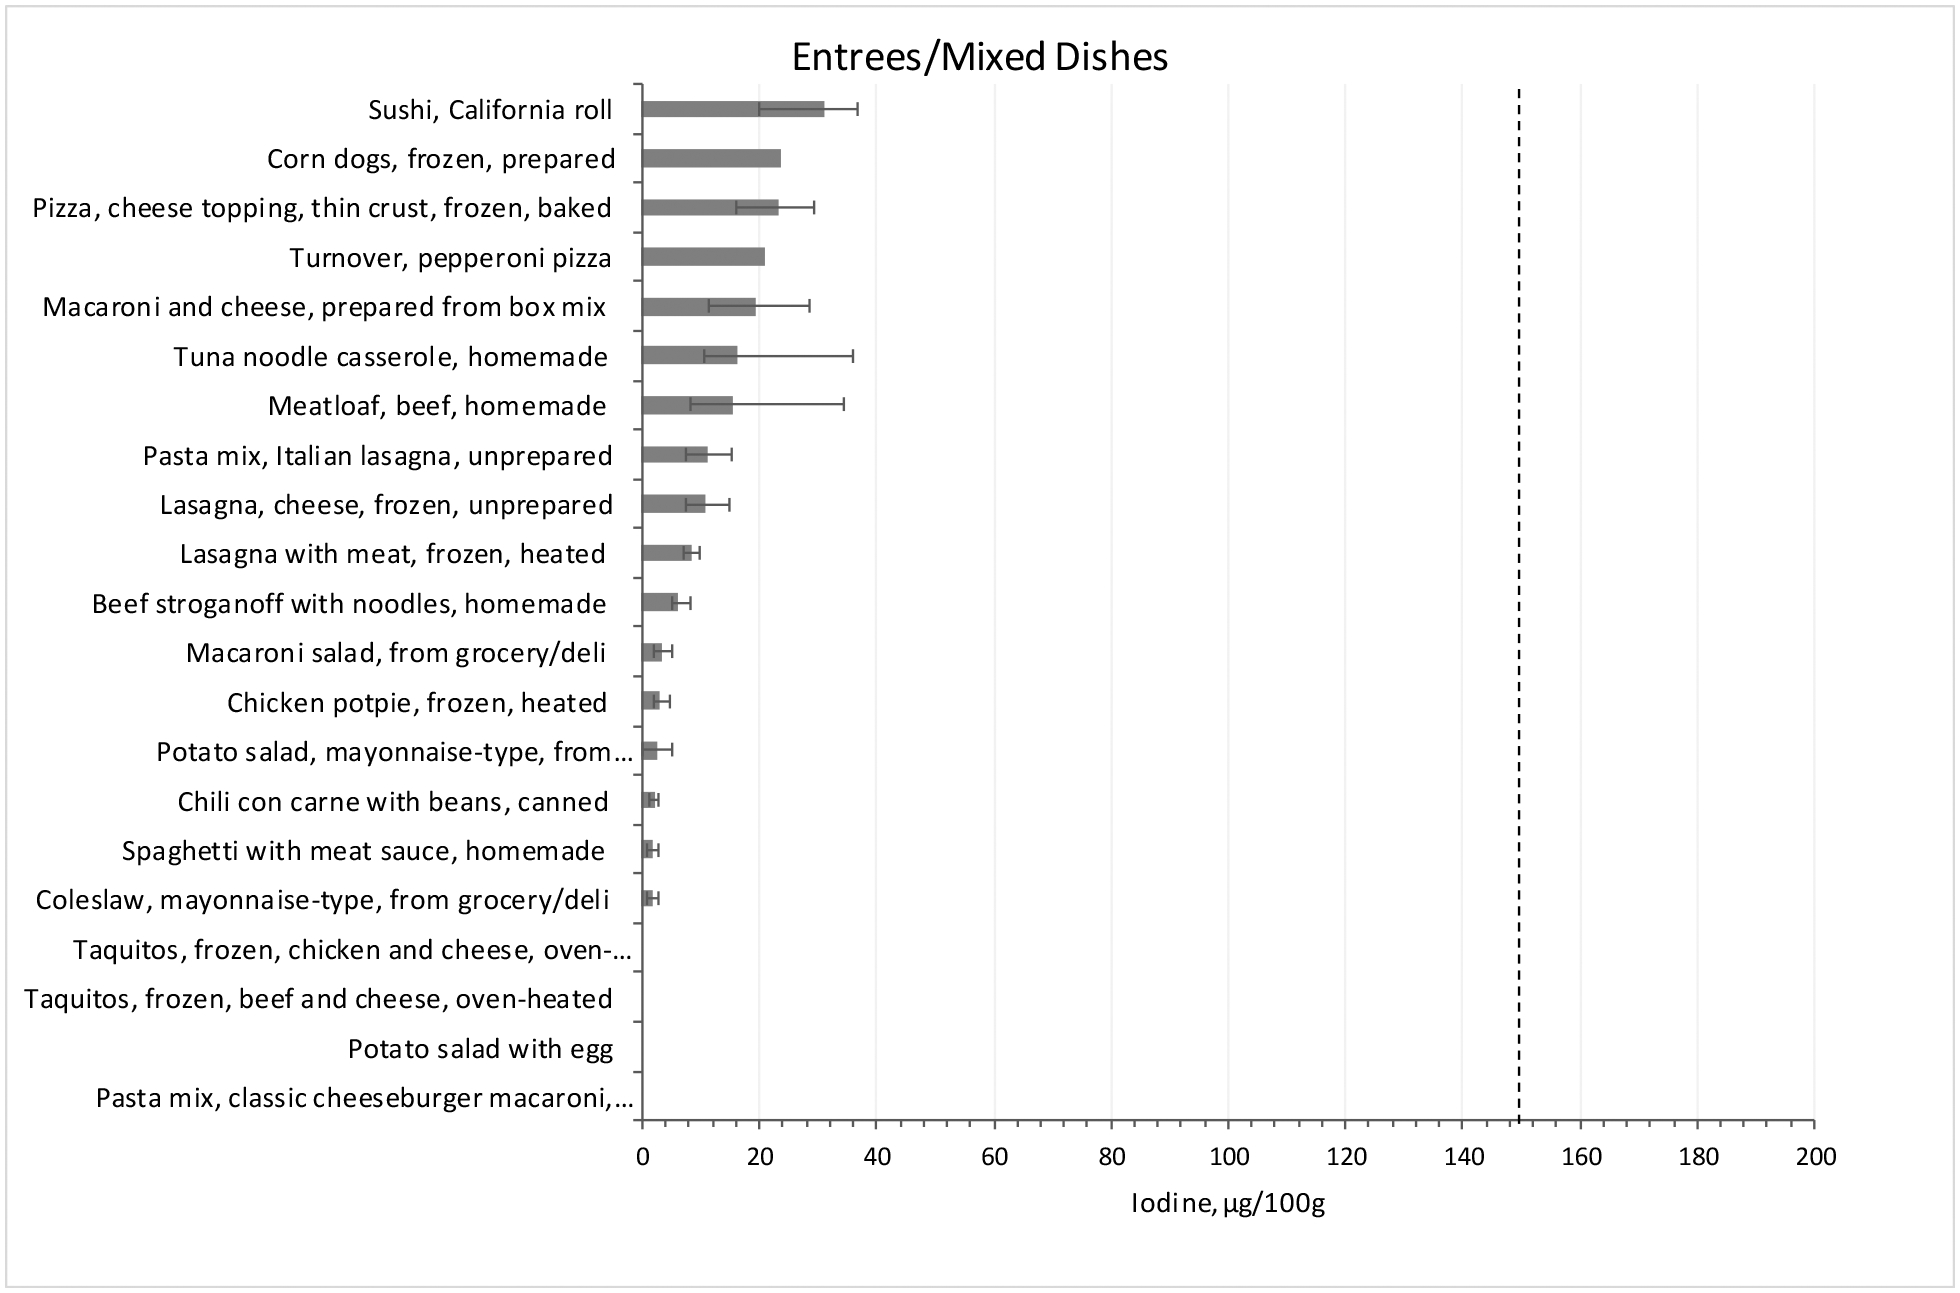
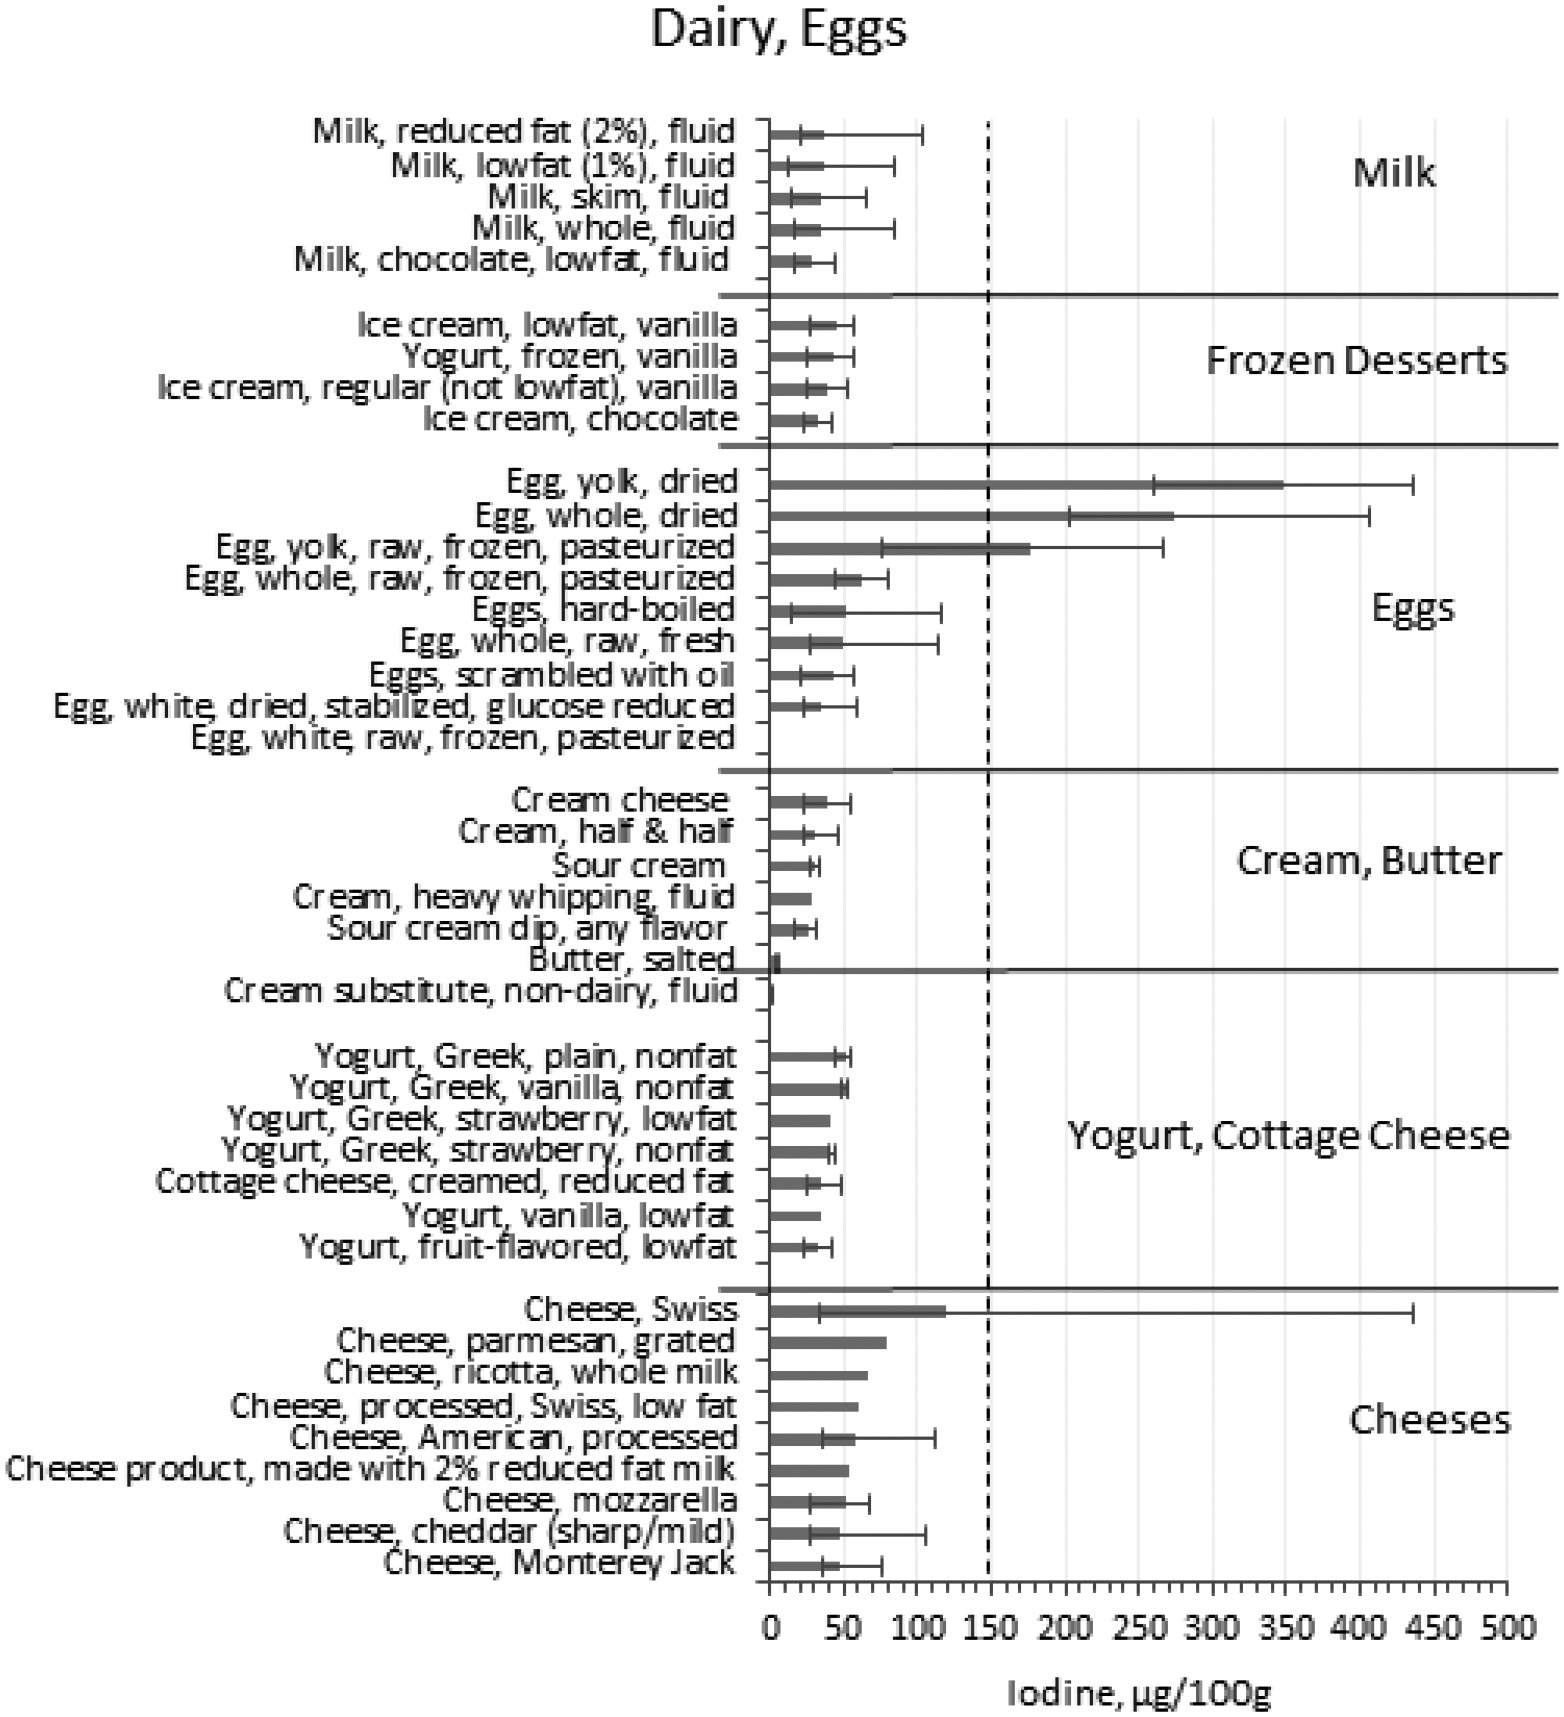
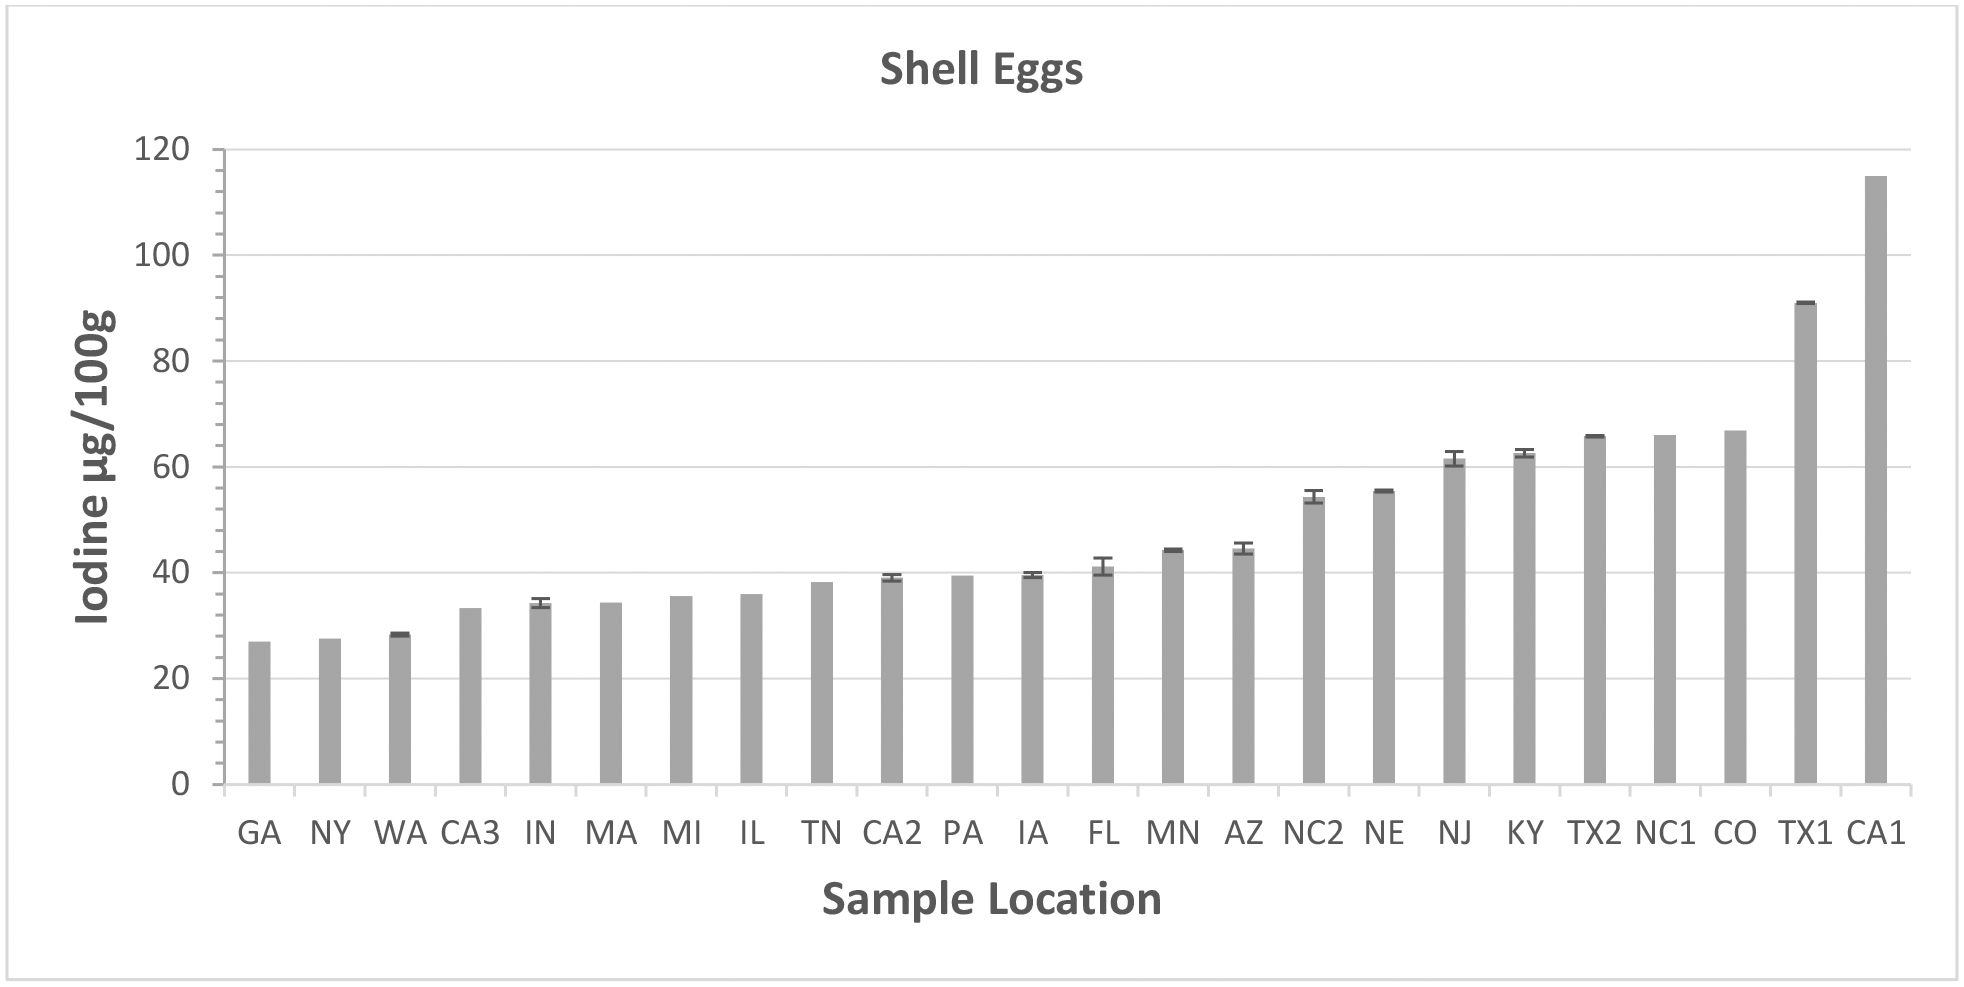
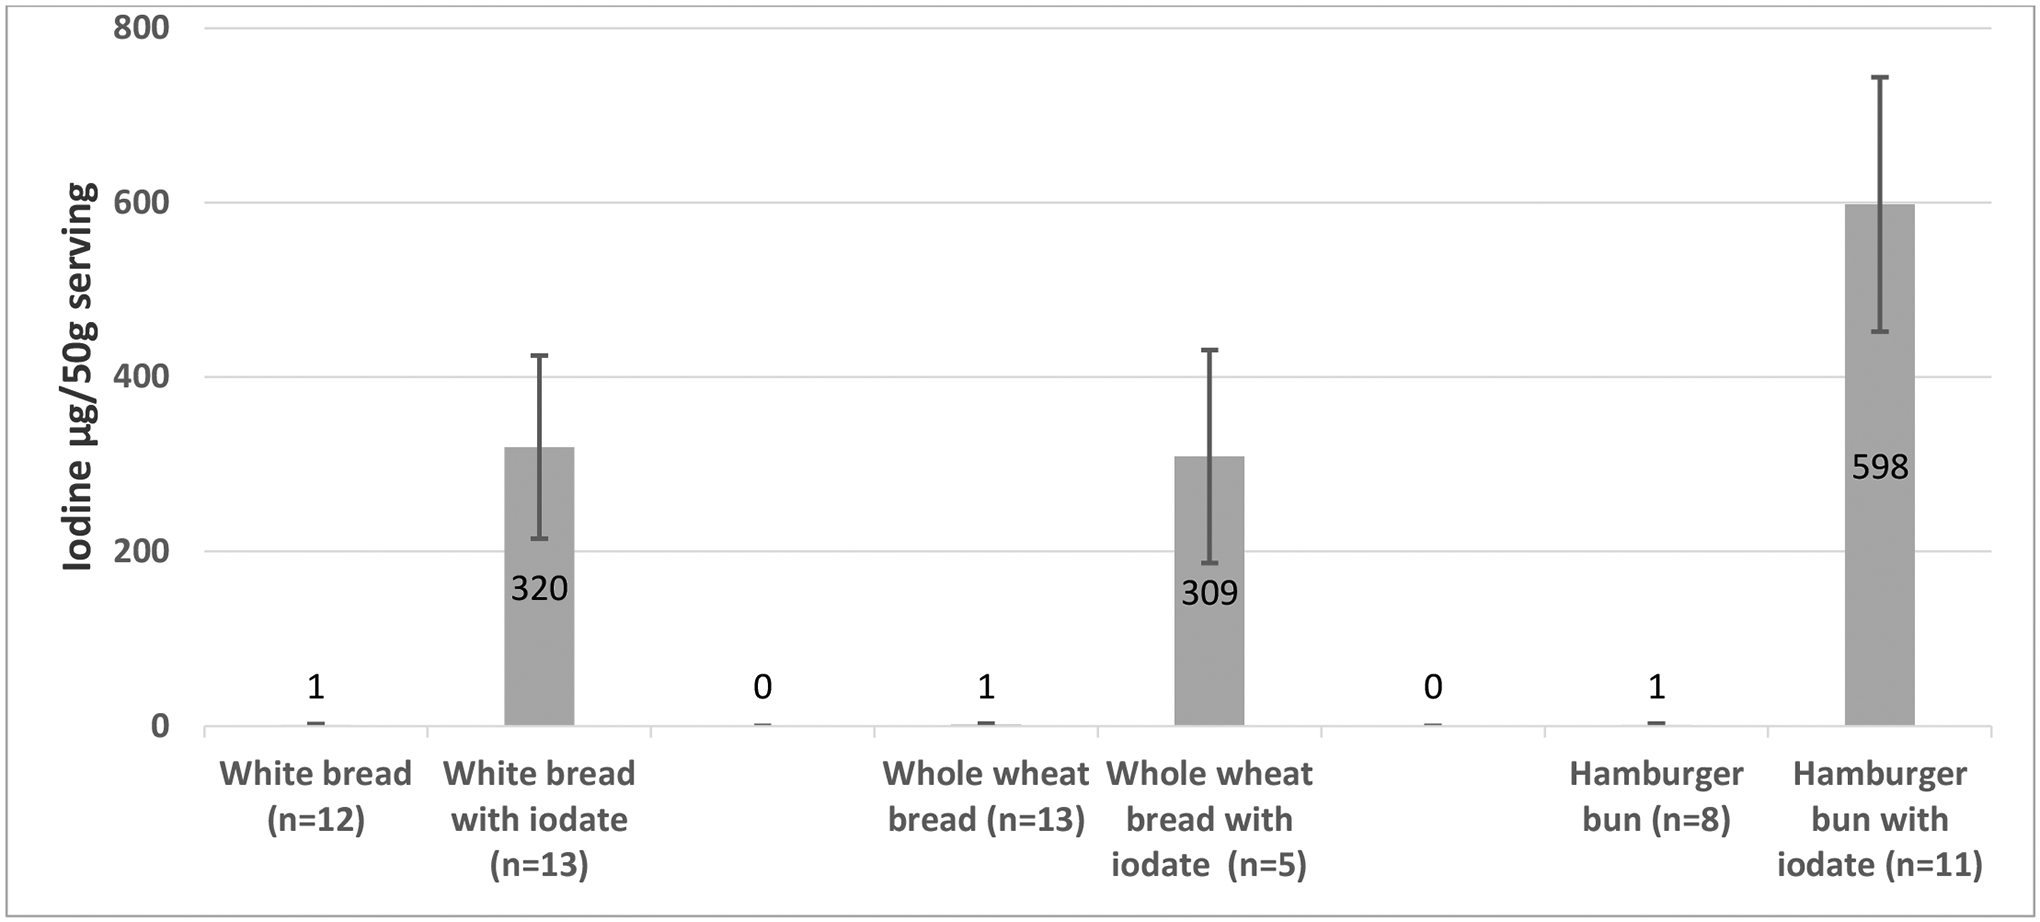
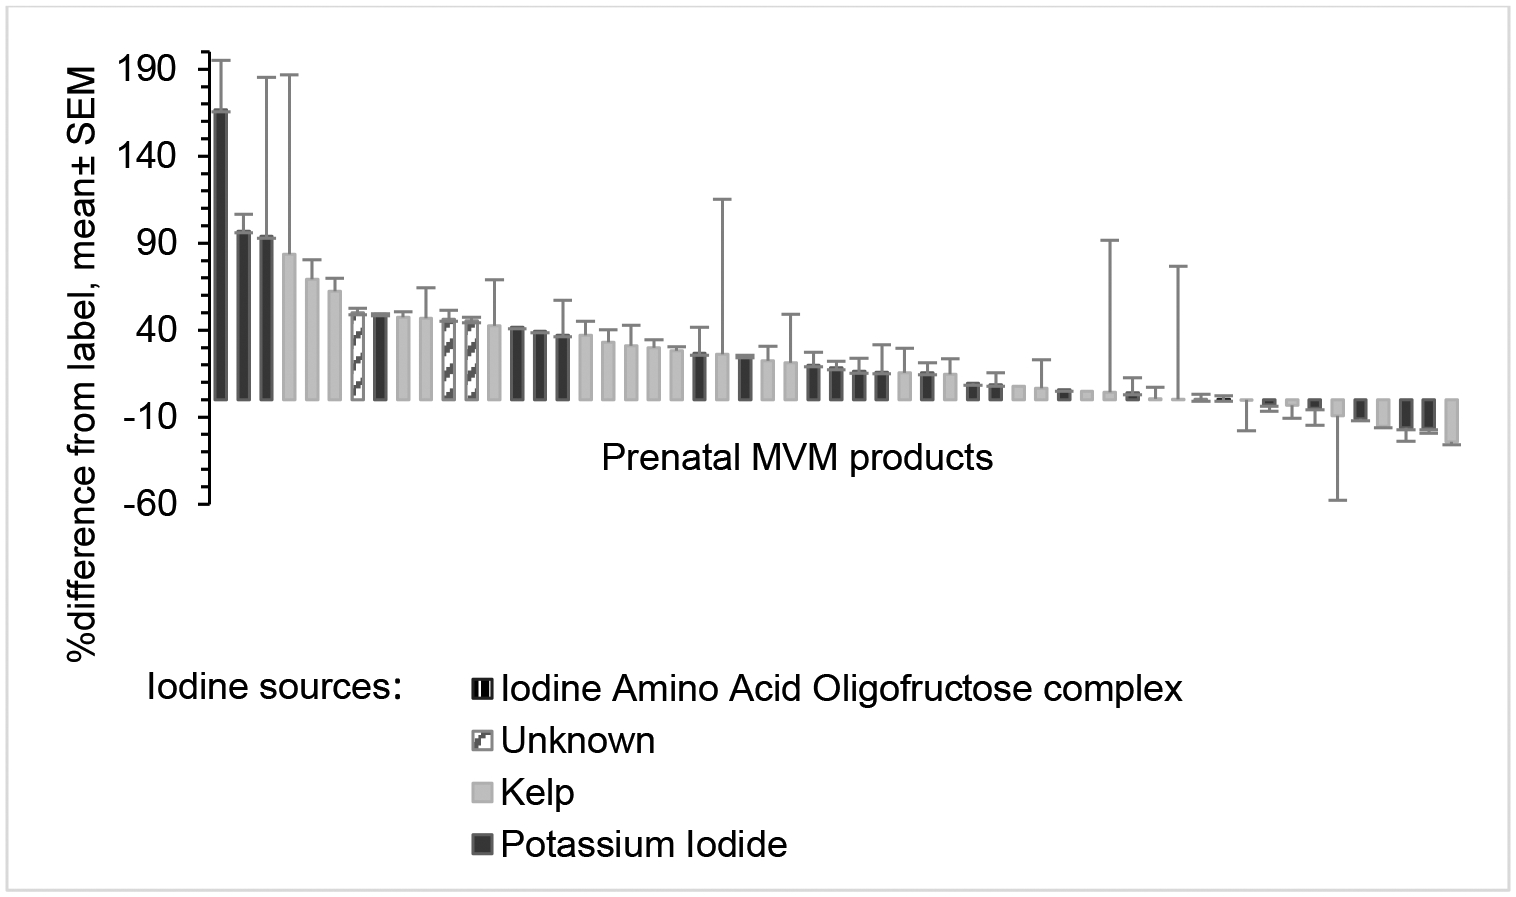
Data on the iodine content of foods and dietary supplements are needed to develop general population intake estimates and identify major contributors to intake. Samples of seafood, dairy products, eggs, baked products, salts, tap water, other foods and beverages, and dietary supplements were collected according to established sampling plans of the U.S. Department of Agriculture (USDA) and the U.S. Food and Drug Administration (FDA). Samples were assayed for iodine content using inductively coupled plasma mass spectrometry with rigorous quality control measures. The food data were released through a collaboration of USDA, FDA, and the Office of Dietary Supplements-National Institutes of Health (ODS-NIH) as the USDA, FDA, and ODS-NIH Database for the Iodine Content of Common Foods at www.ars.usda.gov/mafcl. Iodine data for dietary supplements are available in the ODS-USDA Dietary Supplement Ingredient Database and the ODS Dietary Supplement Label Database. Data from the iodine databases linked to national dietary survey data can provide needed information to monitor iodine status and develop dietary guidance for the general U.S. population and vulnerable subgroups. This iodine information is critical for dietary guidance development, especially for those at risk for iodine deficiency (i.e., women of reproductive age and young children).

Keywords: analysis; database; dietary supplements; foods; iodine; nutrient data.


Conflict of interest statement

Conflicts of interest The authors, shown above, have no conflicts of interest.

Figures

Figure 1a.
Figure 1a.
Locations of USDA’s representative sample units collected through the National Food and Nutrient Analysis Program (Haytowitz and Pehrsson, 2018; Patterson et al., 2020).
Figure 1b.
Figure 1b.
Sampling regions, with population (as of 2012) for FDA samples collected in two-year periods over six regions through the Total Diet Study (Abt et al., 2018; Murray et al., 2008).
Figure 2.
Figure 2.
Results for control materials (CC) and commercial Standard Reference Materials® (SRM) stored at −60°C analyzed with food samples. Each food sample was analyzed two different times. Certified ranges (μg/100g) for SRM (National Institute of Standards and Technology, Gaithersburg, MD) NIST1849a: 118–140; NIST 1548a: 65-6-86.2. Mean and HorRat values (Horwitz and Albert, 2006) shown in parentheses in legend for each material.
Figure 3.
Figure 3.
Summary of results (mean and range) for items in the seafood category with median iodine content greater than 10 μg/100g. (Mean values below the limit of quantitation of 10 μg/100g appear as 0.). Dotted vertical line shows Dietary Reference Intake (IOM, 2001).
Figure 4.
Figure 4.
Summary of results (mean and range) for items in the fast foods and restaurant food categories with median iodine content greater than 10 μg/100g. (Mean values below the limit of quantitation of 10 μg/100g appear as 0.) Dotted vertical line shows Dietary Reference Intake (IOM, 2001).
Figure 5.
Figure 5.
Summary of results (mean and range) for items in the entrees and mixed dishes categories with median iodine content greater than 10 μg/100g. (Mean values below the limit of quantitation of 10 μg/100g appear as 0.) Dotted vertical line shows Dietary Reference Intake (IOM, 2001).
Figure 6.
Figure 6.
Summary of results (mean and range) for items in dairy and egg categories with median iodine content greater than 10 μg/100g. (Mean values below the limit of quantitation of 10 μg/100g appear as 0.) Dotted vertical line shows Dietary Reference Intake (IOM, 2001).
Figure 7.
Figure 7.
Iodine concentration (μg per 100 g) of shell eggs sampled at 24 US retail locations (Roseland et al., in press). Error bars show standard deviation for analytical replicates.
Figure 8.
Figure 8.
Iodine content of iodized table and sea salt, μg per serving (1.5g, 1/4 teaspoon). Error bars show standard deviation of replicate measurement. Dotted line shows the Dietary Reference Intake (IOM, 2001).
Figure 9.
Figure 9.
Iodine concentration in individual samples of milk (μg per 100 g) sampled at 24 US retail locations in different states (from Roseland et al., 2020).
Figure 10.
Figure 10.
Iodine in pasta (semolina spaghetti) cooked in water with varying amounts of iodized salt, as a function of iodine concentration in the cooking water. Pasta samples were from a previous study on sodium in cooked pasta (Bianchi et al., 2019), with 454 g pasta cooked in 5.68L water. Iodine concentration in the water was calculated using the analyzed iodine concentration in the salt (2397 ug/100g). Data points are the mean + standard error of samples from three experiments for each salt level.
Figure 11.
Figure 11.
Iodine concentration in tap water (μg per 100 g and per serving) for individual samples at 40 locations in US states. Dotted line indicates limit of quantitation.
Figure 12.
Figure 12.
Iodine concentration (mean and SD; μg per 50 g serving) among bread samples with and without iodate dough conditioners. (50 g serving = 2 slices bread or 1 bun)
Figure 13.
Figure 13.
Iodine sources, mean percentage difference from label claims for iodine content and lot-to-lot variability in 55 non-prescription prenatal multivitamin/mineral (MVM) products (n=1–3 lots). SEM= standard error of the mean. (Andrews et al., 2014).

Similar articles

Cited by

References

    1. Andrews KW, Gusev PA, McNeal M, Savarala S, Dang PTV, Oh L, Atkinson R, Pehrsson PR, Dwyer JT, Saldanha LG, Betz JM, Costello RB, Douglass LW (2018). Dietary Supplement Ingredient Database (DSID) and the application of analytically based estimates of ingredient amount to intake calculations. Journal of Nutrition, 148 (Suppl_2), 1413S–1421S. - PMC - PubMed
    1. Andrews KW, Roseland JM, Gusev PA, Palachuvattil J, Dang PT, Savarala S, Han F, Pehrsson PR, Douglass LW, Dwyer JT, Betz JM, Saldanha LG, Bailey RL (2017). Analytical ingredient content and variability of adult multivitamin/mineral products: national estimates for the Dietary Supplement Ingredient Database. American Journal of Clinical Nutrition, 105(2), 526–539. - PMC - PubMed
    1. Andrews KW, Palachuvattil J, Dang PT, Gusev P, Savarala S, Pehrsson PR Iodine content of OTC prenatal MVM supplements. Assessment of Iodine Intake: Food and Supplements Roundtable. April 22–23, 2014.
    1. Ahluwalia N, Dwyer J, Terry A, Moshfegh A, Johnson C (2016). Update on NHANES dietary data: focus on collection, release, analytical considerations, and uses to inform public policy. Advances in Nutrition, 7, 121–134. - PMC - PubMed
    1. Bianchi LM, Phillips KM, McGinty RC, Ahuja JK, Pehrsson PR (2019). Cooking parameters affect the sodium content of prepared pasta. Food Chemistry, 271, 479–487. - PubMed

LinkOut - more resources