. 2022 Aug 4;2(1):vbac051.
doi: 10.1093/bioadv/vbac051. eCollection 2022.

Cell Layers: uncovering clustering structure in unsupervised single-cell transcriptomic analysis

Affiliations

Cell Layers: uncovering clustering structure in unsupervised single-cell transcriptomic analysis

Andrew P Blair et al. Bioinform Adv. .

Abstract

Motivation: Unsupervised clustering of single-cell transcriptomics is a powerful method for identifying cell populations. Static visualization techniques for single-cell clustering only display results for a single resolution parameter. Analysts will often evaluate more than one resolution parameter but then only report one.

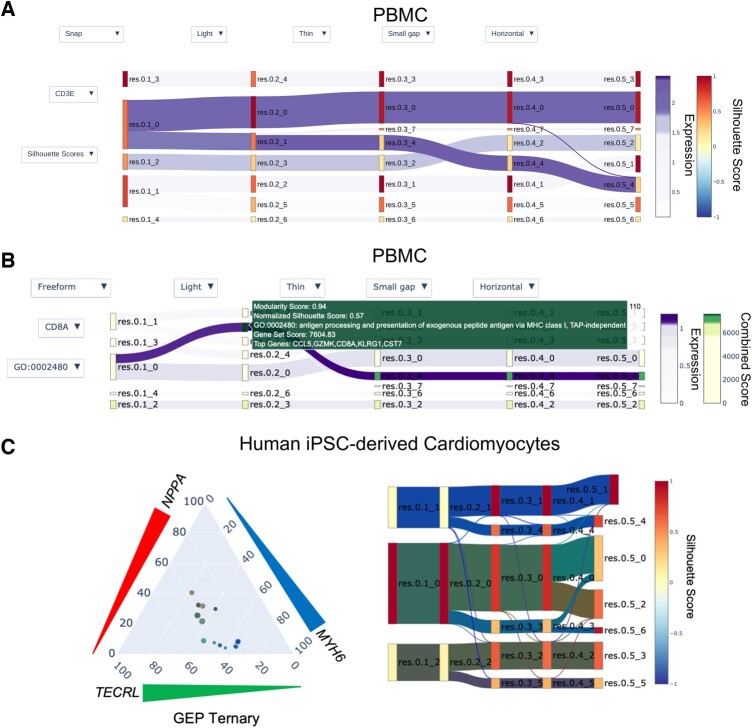
Results: We developed Cell Layers, an interactive Sankey tool for the quantitative investigation of gene expression, co-expression, biological processes and cluster integrity across clustering resolutions. Cell Layers enhances the interpretability of single-cell clustering by linking molecular data and cluster evaluation metrics, providing novel insight into cell populations.

Availability and implementation: https://github.com/apblair/CellLayers.


Figures

Fig. 1.
Fig. 1.
Application of Cell Layers on PBMCs or iPSC-derived cardiomyocyte differentiation. All nodes are labeled by their resolution parameter followed by an underscore indicating their cluster assignment. (A) PBMC multi-resolution analysis from 0.1 to 0.5. Edges are painted by CD3E, a marker gene for CD8 T, Memory CD4 T and Naive CD4 T cells. Nodes are painted by normalized Silhouette score. The lower Silhouette values indicate that samples are near the decision boundary of neighboring clusters. (B) Nodes painted by enrichR gene ontology (GO) 2018 Biological Process combined scores for GO: 0002480. The node-hover template provides users cluster performance metrics, GO term title, enrichR combined score and the top five differentially expressed genes. Edges are colored by the natural killer (NK) cell marker gene CD8A. (C) Multi-resolution analysis from 0.1 to 0.5 and marker gene co-expression of a dataset from iPSC-derived cardiomyocytes (Kathiriya et al., 2021). The (left) ternary chart depicts the gene expression percentiles (GEPs) for the co-expression of NPPA, MYH6 and TECRL. Each triangle on the outside of the ternary plot is oriented such that the base indicates increasing GEP. Each scatter point in the ternary chart specifies the co-expression of the genes (NPPA, TECRL and MYH6) as GEPs for a corresponding flow in the (right) Sankey plot. The size of a scatter point is a log2 transformation of the number of cells in its corresponding flow, then multiplied by a scalar value of two. The scatter point is generated by mapping each gene’s GEP. The Sankey nodes are painted by normalized Silhouette score, and edges are painted by the GEP of co-expressed NPPA, TECRL and MYH6

References

    1. Blondel V.D. et al. (2008) Fast unfolding of communities in large networks. J. Stat. Mech. Theory Exp., 2008, P10008.
    1. Ding H. et al. (2018) Quantitative assessment of protein activity in orphan tissues and single cells using the metaVIPER algorithm. Nat. Commun., 9, 1471. - PMC - PubMed
    1. Ding H. et al. (2019) Biological process activity transformation of single cell gene expression for cross-species alignment. Nat. Commun., 10, 4899. - PMC - PubMed
    1. Fortunato,S. and Barthélemy,M. (2007) Resolution limit in community detection. Proc. Natl. Acad. Sci., 104, 36–41. - PMC - PubMed
    1. Hwang B. et al. (2018) Single-cell RNA sequencing technologies and bioinformatics pipelines. Exp. Mol. Med., 50, 1. - PMC - PubMed