. 2022 Jul 28:9:925649.
doi: 10.3389/fvets.2022.925649. eCollection 2022.

Early feeding strategies in lambs affect rumen development and growth performance, with advantages persisting for two weeks after the transition to fattening diets

Affiliations

Early feeding strategies in lambs affect rumen development and growth performance, with advantages persisting for two weeks after the transition to fattening diets

Ting Liu et al. Front Vet Sci. .

Abstract

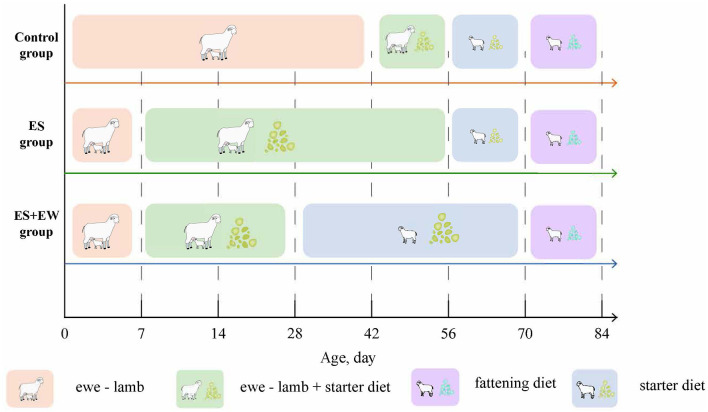
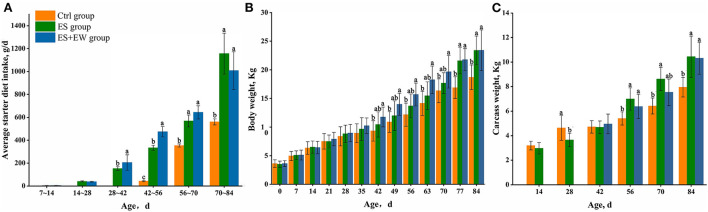
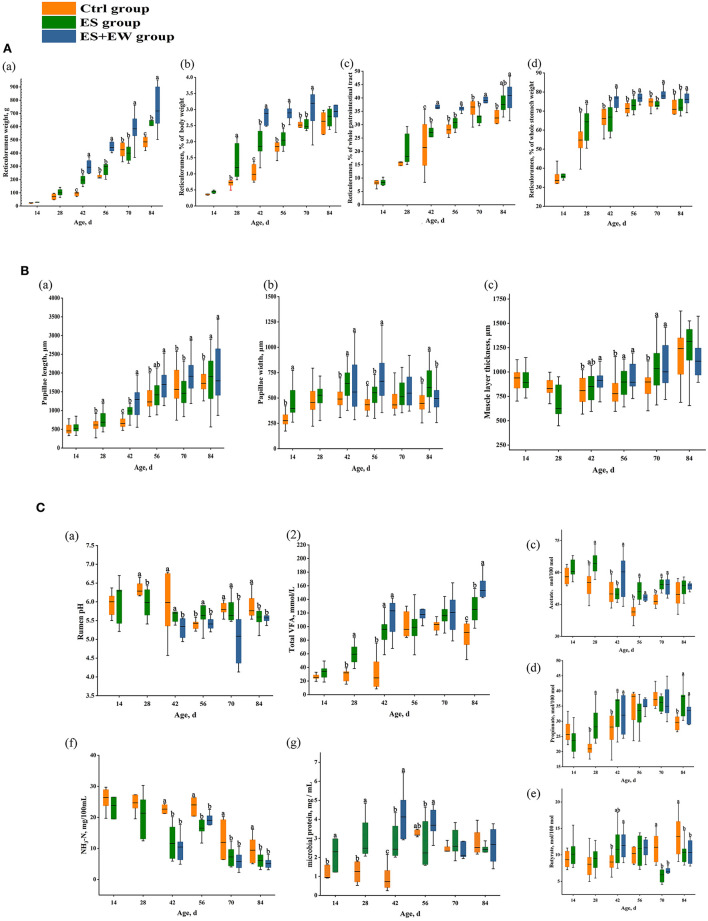
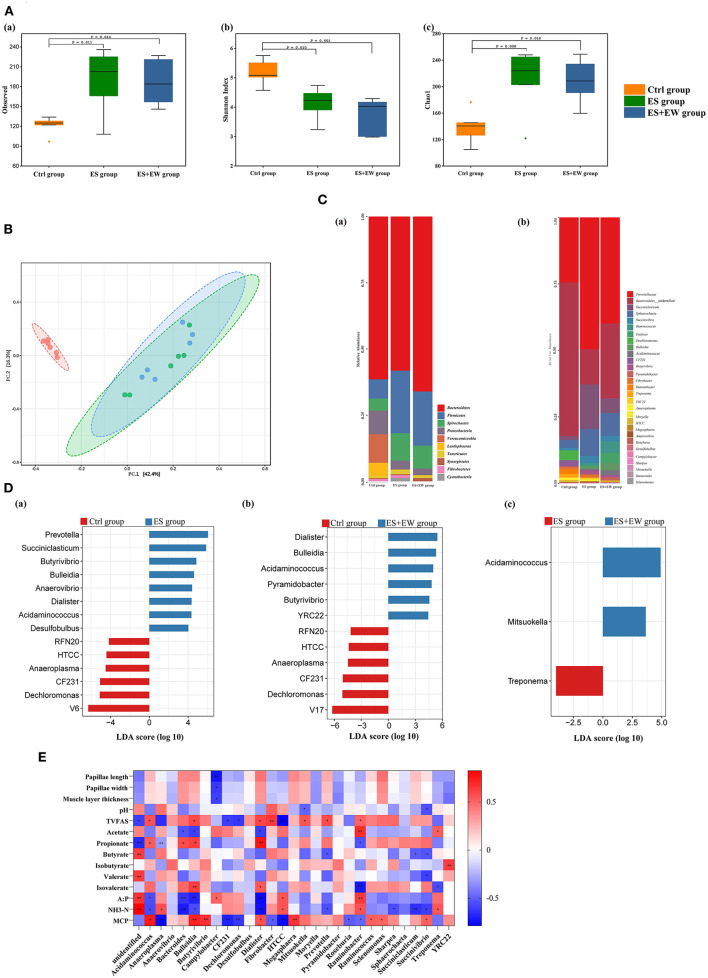
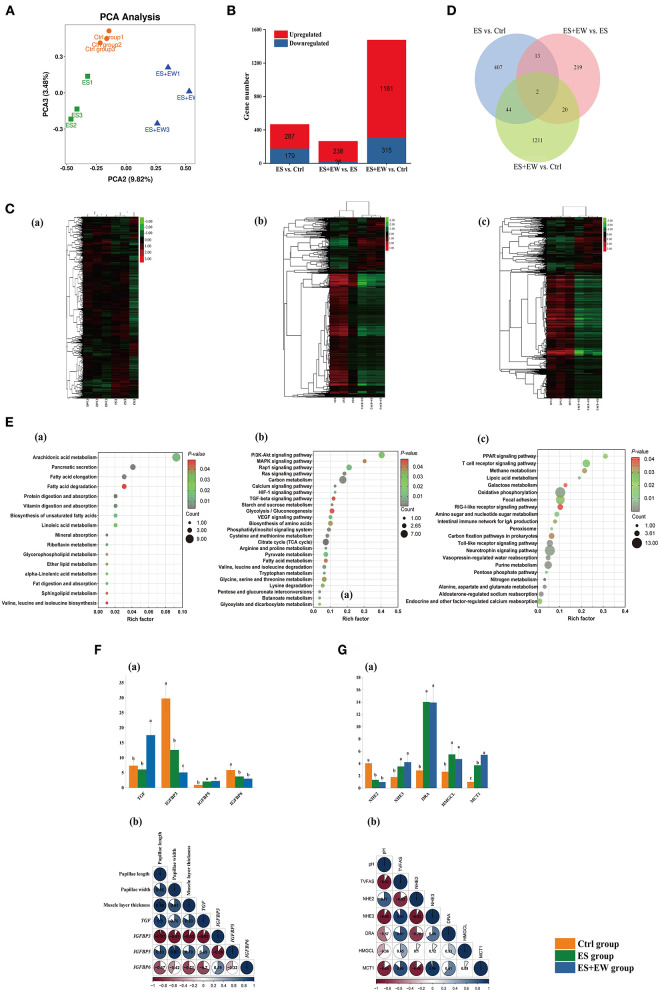
This study aimed to explore the effects of early feeding strategies on the growth and rumen development of lambs from pre-weaning to the transition to fattening diets. Ninety-six newborn, male lambs with similar body weights were randomly assigned to three treatments: fed starter at 42 days old + weaned at 56 days old (Ctrl, n = 36), fed starter at 7 days old + weaned at 56 days old (ES, n = 36), and fed starter at 7 days old + weaned at 28 days old (ES + EW, n = 24). The fattening diets of all lambs were gradually replaced from 60 to 70 days of age. Six randomly selected lambs from each treatment were slaughtered at 14, 28, 42, 56, 70, and 84 days of age. The results showed that the richness and diversity of rumen microbiota of lambs in the Ctrl group were distinct from those of lambs in the other groups at 42 days of age. Moreover, transcriptome analysis revealed 407, 219, and 1,211 unique differentially expressed genes (DEGs) in the rumen tissue of ES vs. Ctrl, ES vs. ES + EW, and ES + EW vs. Ctrl groups, respectively, at 42 days of age. Different early feeding strategies resulted in differences in ruminal anatomy, morphology, and fermentation in lambs from 42 to 84 days of age (P < 0.05). Lambs in the ES + EW group had a higher average starter diet intake than those in the other groups (P < 0.05) from 28 to 56 days of age, which affected their growth performance. After 42 days of age, the body and carcass weights of lambs in the ES and ES + EW groups were higher than those in the Ctrl group (P < 0.05). These findings demonstrate that feeding lambs with a starter diet at 7 days of age and weaning them at 28 days of age can promote rumen development and improve growth performance, and this advantage persists for up to 2 weeks after transition to the fattening diet.

Keywords: early supplementation; early weaning; growth performance; lamb; rumen development.


Conflict of interest statement

The authors declare that the research was conducted in the absence of any commercial or financial relationships that could be construed as a potential conflict of interest.

Figures

Figure 1
Figure 1
Experimental design. Study design showing the time frame of the experiment and the treatment groups. The ewes of control group were fed according to the sheep farm procedure. At 42, 56, 70, and 84 days of age, six lambs were randomly selected from each treatment group, weighed, and slaughtered.
Figure 2
Figure 2
Average starter diet intake (A), body weight (B), and carcass weight (C) of lambs in different early feeding strategies. Columns with different letters at a single time point indicate means that differed based on the means separation (P < 0.05). Error bars indicate SEM for the treatment × age interaction.
Figure 3
Figure 3
The development of lamb ruminal anatomy (A), morphology (B), and fermentation (C) in different early feeding strategies. Boxes with different letters at a single time point indicate means that differed based on the means separation (P < 0.05). Error bars indicate SEM for the treatment × age interaction.
Figure 4
Figure 4
Ruminal microbiota diversity and community structure of lambs in different early feeding strategies at 42 days of age. (A) The alpha diversity in the rumen microbial community based on the observed species (a), Shannon index (b) and Chao1 index (c). (B) The principal coordinate analysis (PCoA) based on the unweighted Unifrac distances. (C) The composition of rumen microbiome at phylum and genus level: the composition of rumen microbiome at phylum level (a), the composition of major rumen genera (b). (D) LEfSe identified significantly different bacteria at the genus level as differentiating the two groups, including Ctrl vs. ES (a), Ctrl vs. ES+EW (b), and ES vs. ES+EW (c). Genera in this graph were statistically significant (P < 0.05) and had an LDA Score > 2.5, which was considered a significant effect size; (E) Heat maps showing the correlations between animal phenotypical variables and relative abundance of bacterial genera. The depth of the color indicates the correlation between species and environmental factors. “*” and “**” indicate the different levels at 0.05 and 0.01, respectively.
Figure 5
Figure 5
The PCA analysis of gene expressions, number of DEGs, KEGG pathways, and main DEGs in the rumen tissue of lambs in different early feeding strategies at 42 days of age. (A) The PCA analysis of gene expressions in the rumen tissue among three groups. (B) The number of DEGs at each comparison in the different early feeding strategies. (C) Clustering heat-map of the DEGs, including Ctrl vs. ES (a), ES vs. ES+EW (b), and Ctrl vs. ES+EW (c); (D) The Venn diagram of all the comparisons and the numbers of DEGs at different early feeding strategies. (E) The KEGG pathways significantly enriched in the unique DEGs identified in the rumen tissue between Ctrl vs. ES (a), ES vs. ES+EW (b), and Ctrl vs. ES+EW (c), and DEGs in main KEGG pathways. The significance of identified KEGG pathways was determined by P < 0.05. (F,G) The relationship between DGEs expression and phenotypic variables, including gene expression related to the development of rumen epithelial morphology of lambs in three groups, n = 6 (Fa). Correlation heatmap showing the correlation of rumen epithelial morphology and DGEs, n = 6 (Fb). Gene expression related to rumen fermentation of lambs in three groups, n = 6 (Ga); Correlation heatmap showing rumen fermentation correlated with DGEs, n = 6 (Gb). The qRT-PCR measurements of the expression of DGEs were analyzed using 2−ΔΔCT method.

Similar articles

Cited by

References

    1. Ramkrishna V, Tiwari GP. Histological and histochemical observations on the forestomach of goat during pre-natal life. Acta Anat (Basel). (1979) 103:292–300. - PubMed
    1. Bhatt RS, Tripathi MK, Verma DL, Karim SA. Effect of different feeding regimes on pre-weaning growth rumen fermentation and its influence on post-weaning performance of lambs. J Anim Physiol Anim Nutr. (2009) 93:568–76. 10.1111/j.1439-0396.2008.00845.x - DOI - PubMed
    1. Scharrer E, Medl M, Liebich HG. Changes in the structure and function of the rumen epithelium during development. 3 effect of liquid versus solid diet on Na and Cl transport across lamb rumen epithelium. Zentralbl Veterinarmed A. (1983) 30:767–74. - PubMed
    1. Lane MA. Baldwin RLt, Jesse BW. Sheep rumen metabolic development in response to age and dietary treatments. J Anim Sci. (2000) 78:1990–6. 10.2527/2000.7871990x - DOI - PubMed
    1. Morgavi DP, Rathahao-Paris E, Popova M, Boccard J, Nielsen KF, Boudra H. Rumen microbial communities influence metabolic phenotypes in lambs. Front Microbiol. (2015) 6:1060. 10.3389/fmicb.2015.01060 - DOI - PMC - PubMed

LinkOut - more resources