

Combined transcriptome and metabolome analysis of the resistance mechanism of quinoa seedlings to Spodoptera exigua
- PMID: 35968105
- PMCID: PMC9370066
- DOI: 10.3389/fpls.2022.931145
Combined transcriptome and metabolome analysis of the resistance mechanism of quinoa seedlings to Spodoptera exigua
Abstract
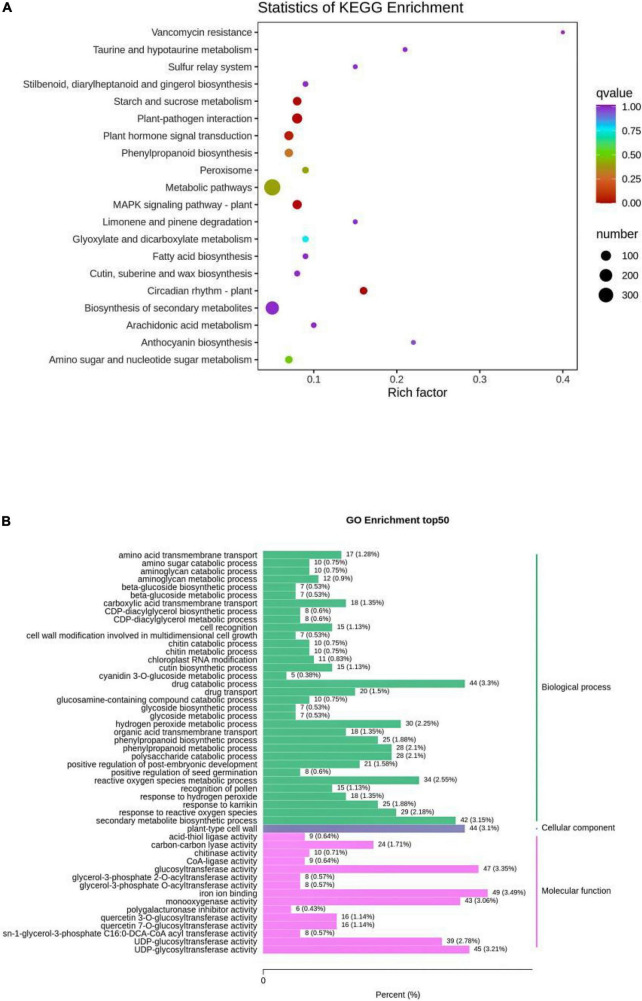
Quinoa has attracted considerable attention owing to its unique nutritional, economic, and medicinal values. The damage intensity of Spodoptera exigua at the seedling stage of quinoa fluctuates with the crop's biological cycle and the environmental changes throughout the growing season. In this study, we used independently selected quinoa seedling resistant and susceptible cultivars to investigate the difference between insect resistance and insect susceptibility of quinoa at the seedling stage. Samples were collected when Spodoptera exigua 45 days after planting the seedlings, and broad targeted metabolomics studies were conducted using liquid chromatography-mass spectrophotometry combined with transcriptomic co-analysis. The metabolomic and genomic analyses of the insect-resistant and insect-susceptible quinoa groups revealed a total of 159 differential metabolites and were functionally annotated to 2334 differential genes involved in 128 pathways using the Kyoto Encyclopedia of Genes and Genomes analysis. In total, 14 metabolites and 22 genes were identified as key factors for the differential accumulation of insect-resistant metabolites in quinoa seedlings. Among them, gene-LOC110694254, gene-LOC110682669, and gene-LOC110732988 were positively correlated with choline. The expression of gene-LOC110729518 and gene-LOC110723164, which were notably higher in the resistant cultivars than in the susceptible cultivars, and the accumulations of the corresponding metabolites were also significantly higher in insect-resistant cultivars. These results elucidate the regulatory mechanism between insect resistance genes and metabolite accumulation in quinoa seedlings, and can provide a basis for the breeding and identification of new insect-resistant quinoa cultivars as well as for screening potential regulatory metabolites of quinoa insect-resistant target genes.
Keywords: Spodoptera exigua; insect resistance mechanism; metabolome; quinoa seedling stage; transcriptome.
Copyright © 2022 Liu, Li, Liu, Kong, Zhang, Wang, Cheng and Qin.
Conflict of interest statement
The authors declare that the research was conducted in the absence of any commercial or financial relationships that could be construed as a potential conflict of interest. The authors declare that this study received contribution from Wuhan Metware Biotechnology Co., Ltd. (www.metware.cn). The company had the following involvement in the study: data analysis and professional technical services.
Figures


Similar articles
-
Color-dependent defense mechanisms of Quinoa (Chenopodium quinoa Willd.) against Spodoptera exigua: metabolomic and transcriptomic insights.BMC Plant Biol. 2025 Jul 2;25(1):813. doi: 10.1186/s12870-025-06825-y. BMC Plant Biol. 2025. PMID: 40604412 Free PMC article.
-
Transcriptomic and Metabolomic Analysis of the Response of Quinoa Seedlings to Low Temperatures.Biomolecules. 2022 Jul 12;12(7):977. doi: 10.3390/biom12070977. Biomolecules. 2022. PMID: 35883533 Free PMC article.
-
Transcriptome and Metabolome Combined to Analyze Quinoa Grain Quality Differences of Different Colors Cultivars.Int J Mol Sci. 2022 Oct 25;23(21):12883. doi: 10.3390/ijms232112883. Int J Mol Sci. 2022. PMID: 36361672 Free PMC article.
-
Elucidating the Differentiation Synthesis Mechanisms of Differently Colored Resistance Quinoa Seedings Using Metabolite Profiling and Transcriptome Analysis.Metabolites. 2023 Oct 10;13(10):1065. doi: 10.3390/metabo13101065. Metabolites. 2023. PMID: 37887390 Free PMC article.
-
Transcriptomic and metabolomic profilings reveal the mechanism of related metabolites and gene regulatory networks of quinoa leaves to Spodoptera exigua feeding during flowering periods.Genomics. 2025 Sep;117(5):111094. doi: 10.1016/j.ygeno.2025.111094. Epub 2025 Aug 8. Genomics. 2025. PMID: 40784557
Cited by
-
Combined analysis of metabolome and transcriptome of wheat kernels reveals constitutive defense mechanism against maize weevils.Front Plant Sci. 2023 May 9;14:1147145. doi: 10.3389/fpls.2023.1147145. eCollection 2023. Front Plant Sci. 2023. PMID: 37229118 Free PMC article.
-
Multi-Omics Analysis Reveals Differential Molecular Responses of RNA Polymerase Common Subunit ZmRPABC5b for Seedling Development in Maize.Plants (Basel). 2025 Mar 17;14(6):941. doi: 10.3390/plants14060941. Plants (Basel). 2025. PMID: 40265882 Free PMC article.
References
-
- Adolf V. I., Shabala S., Andersen M. N., Razzaghi F., Jacobsen S. E. (2012). Varietal differences of quinoa’s tolerance to saline conditions. Plant Soil 357 117–129. 10.1007/s11104-012-1133-7 - DOI
-
- Aljbory Z., Chen M. S. (2018). Indirect plant defense against insect herbivores: a review. Insect Sci. 25 2–23. - PubMed
-
- Bhargava A., Shukla S., Ohri D. (2006). Chenopodium quinoa-an Indian perspective. Ind. Crops Prod. 23 73–87. 10.1016/j.indcrop.2005.04.002 - DOI
-
- Cabrera H. M., Munoz O., Zuniga G. E., Corcuera L. J., Argandona V. H. (1995). Changes in ferulic acid and lipid content in aphid-infested barley. Phytochemistry 39 1023–1026. 10.1016/0031-9422(95)00065-F - DOI
LinkOut - more resources
Full Text Sources