

Untargeted LC-MS/MS-Based Metabolomic Profiling for the Edible and Medicinal Plant Salvia miltiorrhiza Under Different Levels of Cadmium Stress
- PMID: 35968141
- PMCID: PMC9366474
- DOI: 10.3389/fpls.2022.889370
Untargeted LC-MS/MS-Based Metabolomic Profiling for the Edible and Medicinal Plant Salvia miltiorrhiza Under Different Levels of Cadmium Stress
Abstract
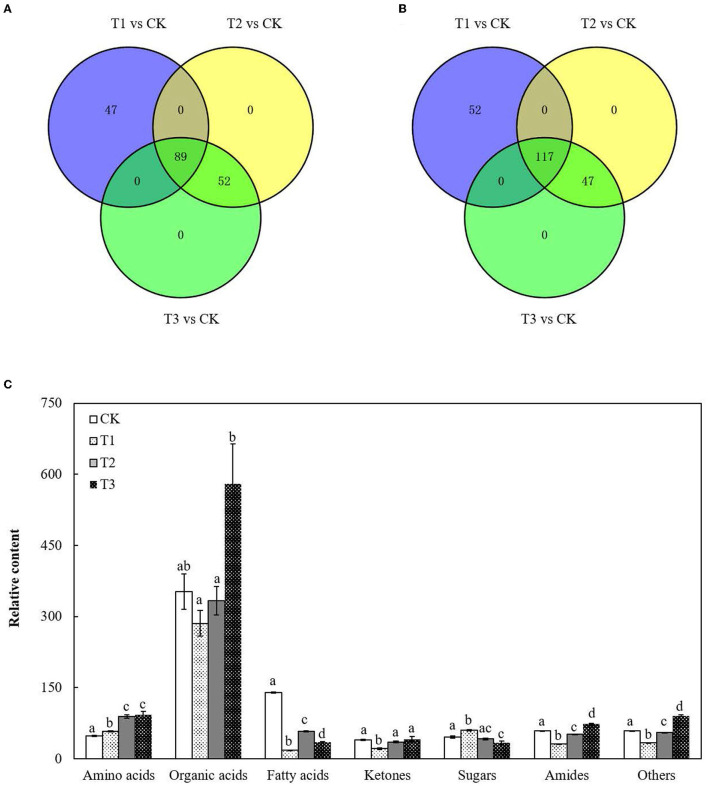
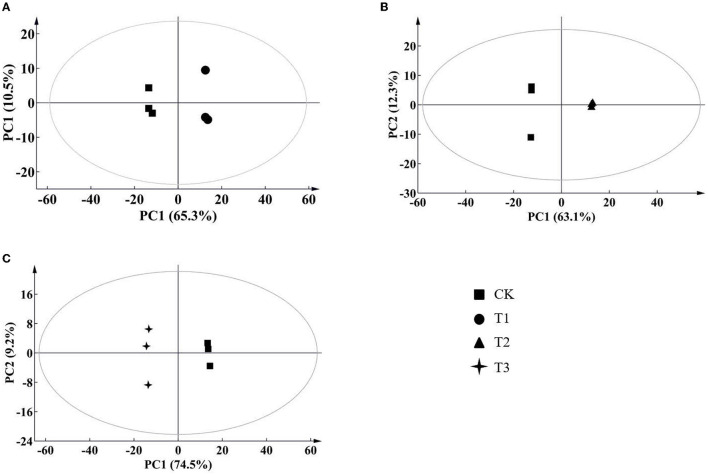
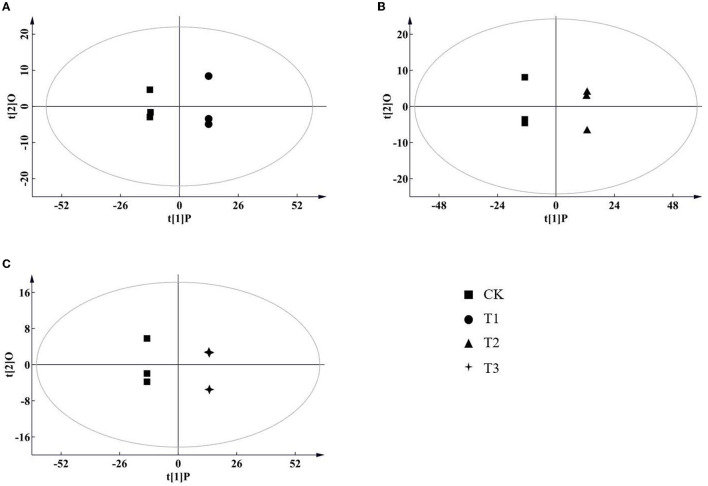
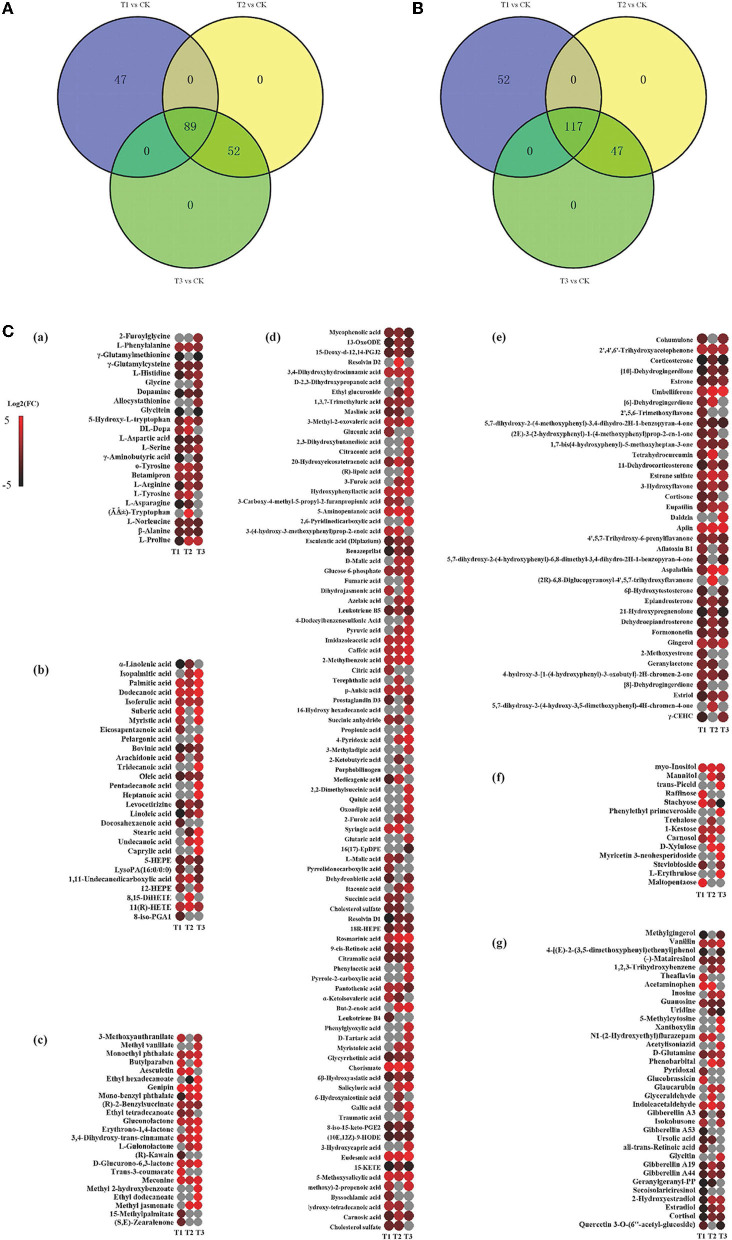
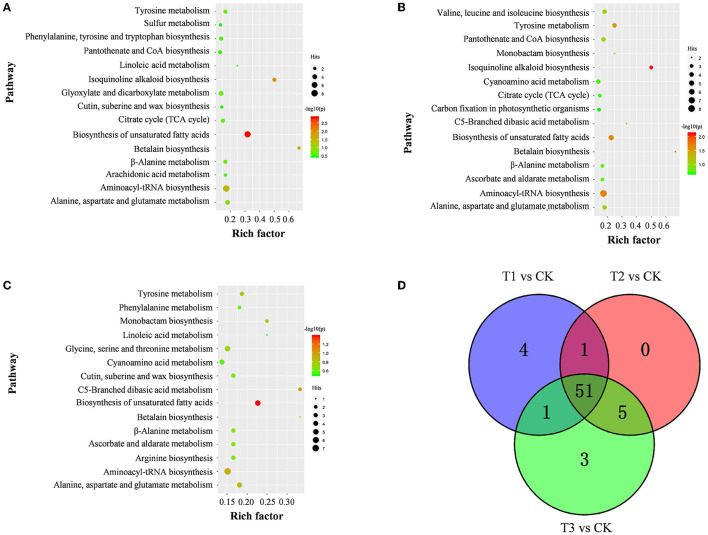
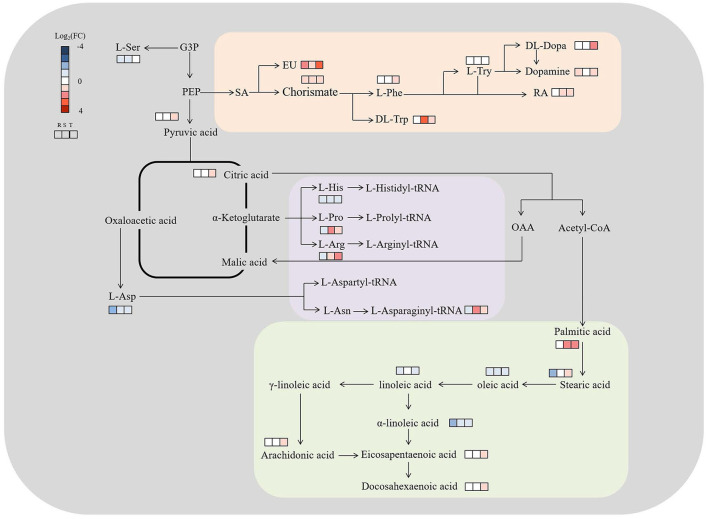
Salvia miltiorrhiza, a medicinal and edible plant, has been extensively applied to treat cardiovascular diseases and chronic hepatitis. Cadmium (Cd) affects the quality of S. miltiorrhiza, posing serious threats to human health. To reveal the metabolic mechanisms of S. miltiorrhiza's resistance to Cd stress, metabolite changes in S. miltiorrhiza roots treated with 0 (CK), 25 (T1), 50 (T2) and 100 (T3) mg kg-1 Cd by liquid chromatography coupled to mass spectrometry (LC-MS/MS) were investigated. A total of 305 metabolites were identified, and most of them were amino acids, organic acids and fatty acids, which contributed to the discrimination of CK from the Cd-treated groups. Among them, S. miltiorrhiza mainly upregulated o-tyrosine, chorismate and eudesmic acid in resistance to 25 mg kg-1 Cd; DL-tryptophan, L-aspartic acid, L-proline and chorismite in resistance to 50 mg kg-1 Cd; and L-proline, L-serine, L-histidine, eudesmic acid, and rosmarinic acid in resistance to 100 mg kg-1 Cd. It mainly downregulated unsaturated fatty acids (e.g., oleic acid, linoleic acid) in resistance to 25, 50, and 100 mg kg-1 Cd and upregulated saturated fatty acids (especially stearic acid) in resistance to 100 mg kg-1 Cd. Biosynthesis of unsaturated fatty acids, isoquinoline alkaloid, betalain, aminoacyl-tRNA, and tyrosine metabolism were the significantly enriched metabolic pathways and the most important pathways involved in the Cd resistance of S. miltiorrhiza. These data elucidated the crucial metabolic mechanisms involved in S. miltiorrhiza Cd resistance and the crucial metabolites that could be used to improve resistance to Cd stress in medicinal plant breeding.
Keywords: Cd treatment; LC-MS/MS; Salvia miltiorrhiza; discriminating metabolites; metabolic pathways.
Copyright © 2022 Yuan, Liu, Sheng, Fu and Wang.
Conflict of interest statement
The authors declare that the research was conducted in the absence of any commercial or financial relationships that could be construed as a potential conflict of interest.
Figures
Similar articles
-
Effects of cadmium on the synthesis of active ingredients in Salvia miltiorrhiza.Open Life Sci. 2023 May 24;18(1):20220603. doi: 10.1515/biol-2022-0603. eCollection 2023. Open Life Sci. 2023. PMID: 37250839 Free PMC article.
-
Changes in secondary metabolites contents and stress responses in Salvia miltiorrhiza via ScWRKY35 overexpression: Insights from a wild relative Salvia castanea.Plant Physiol Biochem. 2024 Jun;211:108671. doi: 10.1016/j.plaphy.2024.108671. Epub 2024 Apr 27. Plant Physiol Biochem. 2024. PMID: 38703500
-
Effect of Genotype and Environment on Salvia miltiorrhiza Roots Using LC/MS-Based Metabolomics.Molecules. 2016 Mar 26;21(4):414. doi: 10.3390/molecules21040414. Molecules. 2016. PMID: 27023512 Free PMC article.
-
Biosynthesis and signal transduction of plant growth regulators and their effects on bioactive compound production in Salvia miltiorrhiza (Danshen).Chin Med. 2024 Jul 24;19(1):102. doi: 10.1186/s13020-024-00971-5. Chin Med. 2024. PMID: 39049014 Free PMC article. Review.
-
The Biosynthetic Pathways of Tanshinones and Phenolic Acids in Salvia miltiorrhiza.Molecules. 2015 Sep 8;20(9):16235-54. doi: 10.3390/molecules200916235. Molecules. 2015. PMID: 26370949 Free PMC article. Review.
Cited by
-
Integrated transcriptome and metabolomics analyses revealed key functional genes in Canna indica under Cr stress.Sci Rep. 2024 Jun 18;14(1):14090. doi: 10.1038/s41598-024-64877-w. Sci Rep. 2024. PMID: 38890328 Free PMC article.
-
Salvia desoleana Atzei et Picci Steam-Distillation Water By-Products as a Source of Bioactive Compounds with Antioxidant Activities.Foods. 2025 Jul 3;14(13):2365. doi: 10.3390/foods14132365. Foods. 2025. PMID: 40647117 Free PMC article.
-
Analysis of plant metabolomics data using identification-free approaches.Appl Plant Sci. 2025 Mar 1;13(4):e70001. doi: 10.1002/aps3.70001. eCollection 2025 Jul-Aug. Appl Plant Sci. 2025. PMID: 40766901 Free PMC article. Review.
-
Rhizoma Atractylodis Macrocephalae-Assessing the influence of herbal processing methods and improved effects on functional dyspepsia.Front Pharmacol. 2023 Aug 4;14:1236656. doi: 10.3389/fphar.2023.1236656. eCollection 2023. Front Pharmacol. 2023. PMID: 37601055 Free PMC article.
-
Effects of cadmium on the synthesis of active ingredients in Salvia miltiorrhiza.Open Life Sci. 2023 May 24;18(1):20220603. doi: 10.1515/biol-2022-0603. eCollection 2023. Open Life Sci. 2023. PMID: 37250839 Free PMC article.
References
-
- Benral M. P., McGrath S. P. (1994). Effects of pH and heavy metal concentrations in solution culture on the proton release, growth and elemental composition of Alyssum murale and Raphanus sativus L. Plant and Soil. 166, 83–92. 10.1007/BF02185484 - DOI
-
- Commission C. P. (2020). Pharmacopoeia of the People's Republic of China. China: China Medical Science and Technology Press.
LinkOut - more resources
Full Text Sources
Research Materials