. 2022 Jul 28:13:959203.
doi: 10.3389/fpls.2022.959203. eCollection 2022.

Determination of morpho-physiological and yield traits of maize inbred lines (Zea mays L.) under optimal and drought stress conditions

Affiliations

Determination of morpho-physiological and yield traits of maize inbred lines (Zea mays L.) under optimal and drought stress conditions

Maha G Balbaa et al. Front Plant Sci. .

Erratum in

Abstract

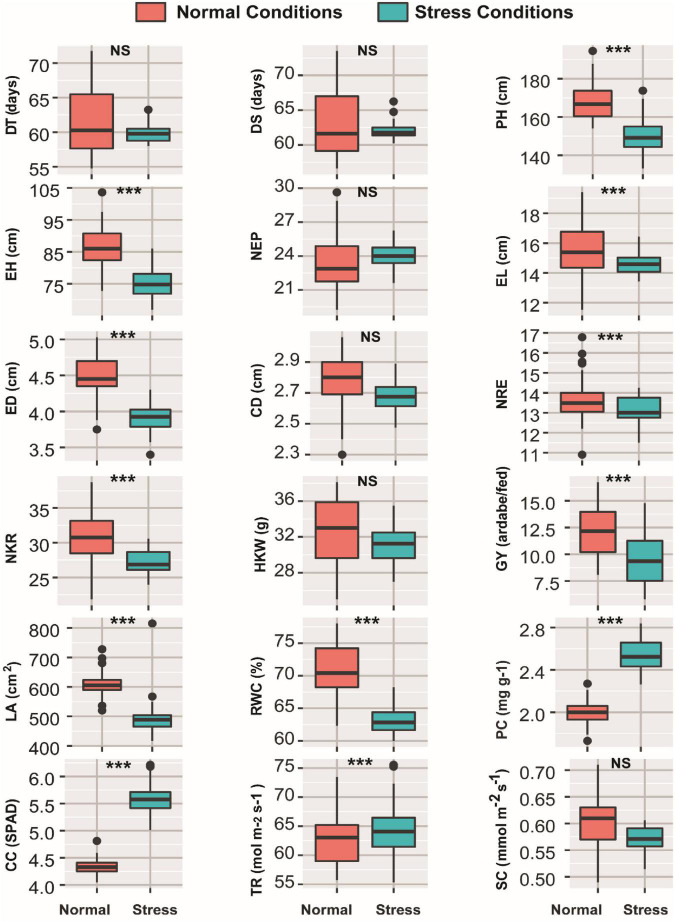
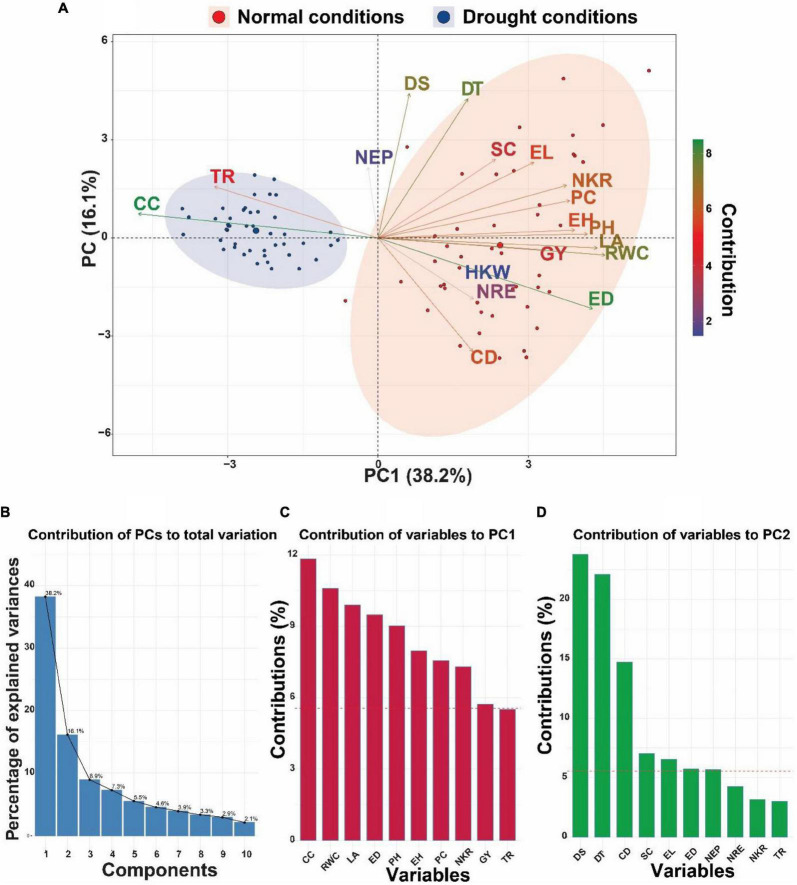
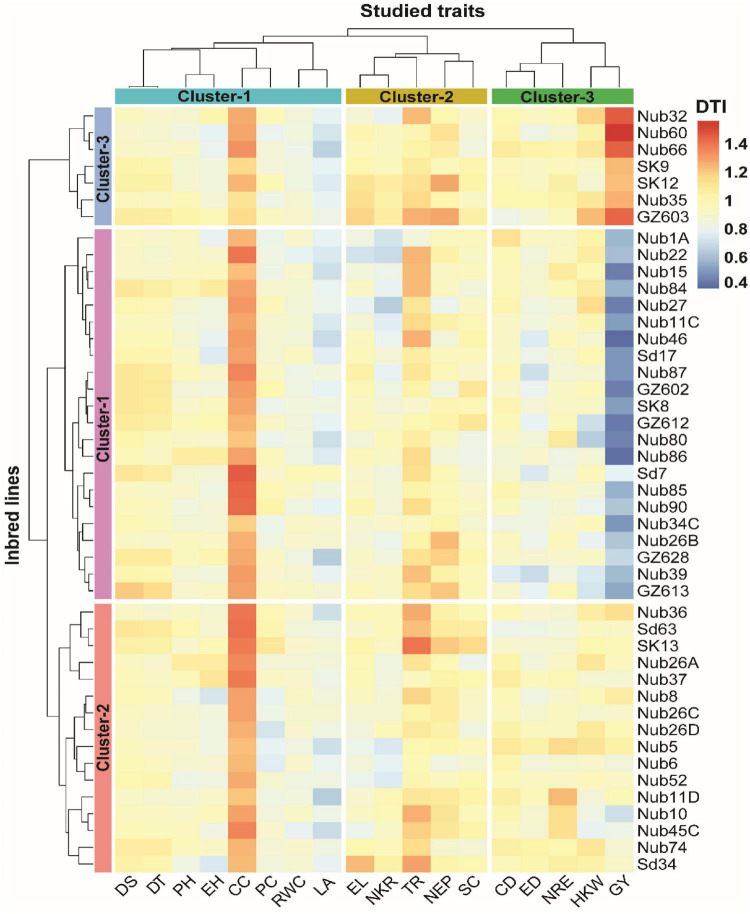
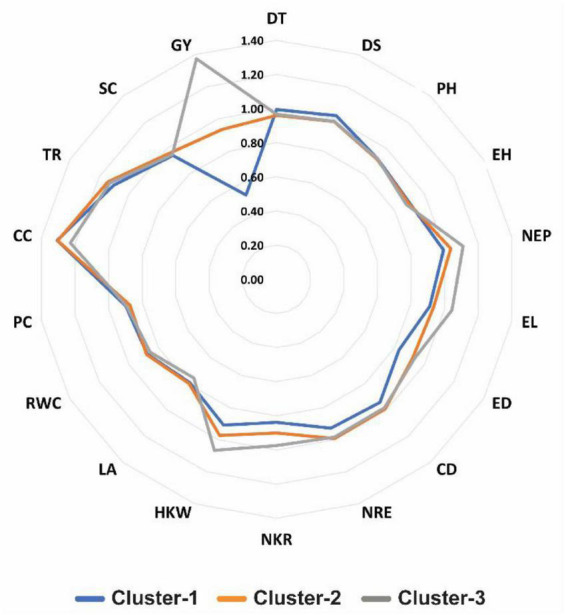
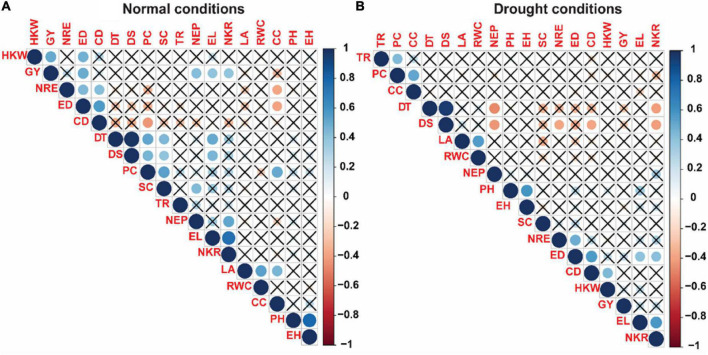
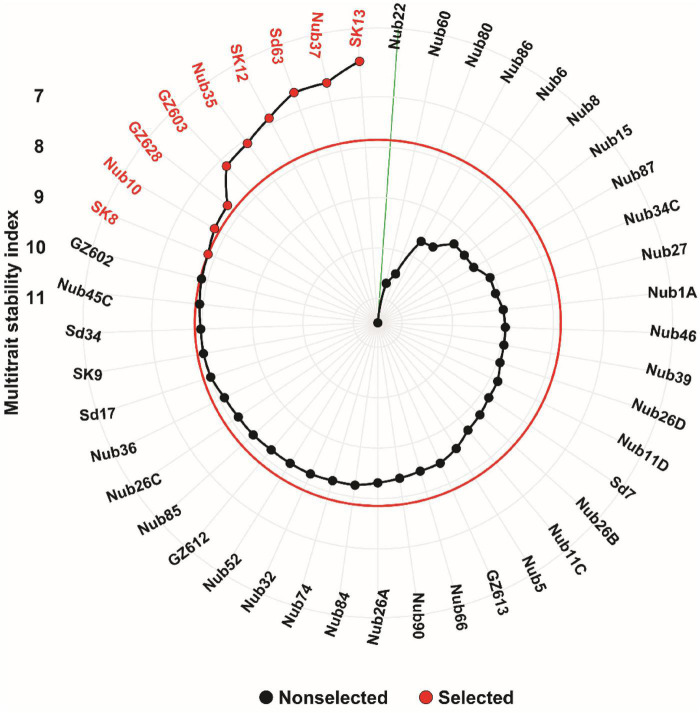
Globally, climate change could hinder future food security that concurrently implies the importance of investigating drought stress and genotype screening under stressed environments. Hence, the current study was performed to screen 45 diverse maize inbred lines for 18 studied traits comprising phenological, physiological, morphological, and yield characters under optimum and water stress conditions for two successive growing seasons (2018 and 2019). The results showed that growing seasons and water regimes significantly influenced (p < 0.01) most of the studied traits, while inbred lines had a significant effect (p < 0.01) on all of the studied traits. The findings also showed a significant increase in all studied characters under normal conditions compared to drought conditions, except chlorophyll content, transpiration rate, and proline content which exhibited higher levels under water stress conditions. Furthermore, the results of the principal component analysis indicated a notable distinction between the performance of the 45 maize inbred lines under normal and drought conditions. In terms of grain yield, the drought tolerance index (DTI) showed that Nub60 (1.56), followed by Nub32 (1.46), Nub66 (1.45), and GZ603 (1.44) were the highest drought-tolerant inbred lines, whereas Nub46 (0.38) was the lowest drought-tolerant inbred line. These drought-tolerant inbred lines were able to maintain a relatively high grain yield under normal and stress conditions, whereas those drought-sensitive inbred lines showed a decline in grain yield when exposed to drought conditions. The hierarchical clustering analysis based on DTI classified the forty-five maize inbred lines and eighteen measured traits into three column- and row-clusters, as inbred lines in cluster-3 followed by those in cluster-2 exhibited greater drought tolerance in most of the studied traits. Utilizing the multi-trait stability index (MTSI) criterion in this study identified nine inbred lines, including GZ603, as stable genotypes in terms of the eighteen studied traits across four environments. The findings of the current investigation motivate plant breeders to explore the genetic potential of the current maize germplasm, especially in water-stressed environments.

Keywords: drought tolerance index (DTI); inbred lines; maize; morpho-physiological; principal component analysis; yield traits.


Conflict of interest statement

The authors declare that the research was conducted in the absence of any commercial or financial relationships that could be construed as a potential conflict of interest.

Figures

FIGURE 1
FIGURE 1
Boxplots showing variation in all 18 morpho-physiological and biochemical measured traits of 45 maize inbred lines grown under normal and drought conditions. *** and NS denote significant variation between treatments at 0.1% levels of probability and non-significant, respectively. DT, days to 50% tasseling; DS, days to 50% silking; PH, plant height (cm); EH, ear height (cm); NEP, no. of ears/plant; EL, ear length (cm); ED, ear diameter (cm); CD, cob diameter (cm); NRE, no. of row/ear; HKW, 100-kernel weight (g); NKR, number of kernel/row; GY, grain yield (ardbe/fed); LA, leaf area (cm2); RWC, relative water content (%); PC, proline content (mg g– 1); CC, chlorophyll content (SPAD); TR, transpiration rate (mmol m– 2 s– 1); SC, stomatal conductance (mol m– 2 s– 1).
FIGURE 2
FIGURE 2
(A) Principal component analysis (PCA)-biplot of 45 maize inbred lines based on the variance in 18 morpho-physiological and biochemical traits grown under normal and drought conditions. Arrows indicate the strength of the trait influence on the first two PCs. The darker green and longer arrows indicate a higher contribution, while the darker blue and shorter arrows indicate the lower contribution of the variables. (B) Bar plots with% variation above represent contribution of each PC to the total variation. (C,D) Red dashed lines in the bar plots denote reference lines and the variable bars above the reference lines are considered most important in contributing to the PC1 and PC2. DT, days to 50% tasseling; DS, days to 50% silking; PH, plant height (cm); EH, ear height (cm); NEP, no. of ears/plant; EL, ear length (cm); ED, ear diameter (cm); CD, cob diameter (cm); NRE, no. of row/ear; HKW, 100-kernel weight (g); NKR, number of kernel/row; GY, grain yield (ardbe/fed); LA, leaf area (cm2); RWC, relative water content (%); PC, proline content (mg g– 1); CC, chlorophyll content (SPAD); TR, transpiration rate (mmol m– 2 s– 1); SC, stomatal conductance (mol m– 2 s– 1).
FIGURE 3
FIGURE 3
Hierarchical clustering and heatmap illustrating the associations among 45 maize inbred lines and 18 different traits in respect to drought tolerance index (DTI) condition. The different colors and intensities were adjusted based on cultivars–traits relationships. The darker blue-sky color indicates lower values (drought-sensitive), while the darker red indicates higher values (drought-tolerant). DT, days to 50% tasseling; DS, days to 50% silking; PH, plant height (cm); EH, ear height (cm); NEP, no. of ears/plant; EL, ear length (cm); ED, ear diameter (cm); CD, cob diameter (cm); NRE, no. of row/ear; HKW, 100-kernel weight (g); NKR, number of kernel/row; GY, grain yield (ardbe/fed); LA, leaf area (cm2); RWC, relative water content (%); PC, proline content (mg g– 1); CC, chlorophyll content (SPAD); TR, transpiration rate (mmol m– 2 s– 1); SC, stomatal conductance (mol m– 2 s– 1).
FIGURE 4
FIGURE 4
Radar plot showing drought tolerance index (DTI) values for 18 studied traits in three clusters of 45 maize inbred lines. Number in red color in the figure represent the complete scale of DTI. DT, days to 50% tasseling; DS, days to 50% silking; PH, plant height (cm); EH, ear height (cm); NEP, no. of ears/plant; EL, ear length (cm); ED, ear diameter (cm); CD, cob diameter (cm); NRE, no. of row/ear; HKW, 100-kernel weight (g); NKR, number of kernel/row; GY, grain yield (ardbe/fed); LA, leaf area (cm2); RWC, relative water content (%); PC, proline content (mg g– 1); CC, chlorophyll content (SPAD); TR, transpiration rate (mmol m– 2 s– 1); SC, stomatal conductance (mol m– 2 s– 1).
FIGURE 5
FIGURE 5
Correlation matrix of the 18 measured traits of 45 maize inbred lines evaluated under normal (A) and drought stress (B) conditions. The increasing color intensities illustrate a higher correlation coefficient. DT, days to 50% tasseling; DS, days to 50% silking; PH, plant height (cm); EH, ear height (cm); NEP, no. of ears/plant; EL, ear length (cm); ED, ear diameter (cm); CD, cob diameter (cm); NRE, no. of row/ear; HKW, 100-kernel weight (g); NKR, number of kernel/row; GY, grain yield (ardbe/fed); LA, leaf area (cm2); RWC, relative water content (%); PC, proline content (mg g– 1); CC, chlorophyll content (SPAD); TR, transpiration rate (mmol m– 2 s– 1); SC, stomatal conductance (mol m– 2 s– 1).
FIGURE 6
FIGURE 6
Ranking of 45 maize inbred lines based on MTSI values performed on 18 traits. The most stable inbred lines are shown in red color and the red circle represents the cut-point according to the selection intensity of 20%. The green line connected to the center of the plot represents the least stable inbred line with highest MTSI value.

Similar articles

Cited by

References

    1. Abbas A., Shah A. N., Shah A. A., Nadeem M. A., Alsaleh A., Javed T., et al. (2022). Genome-wide analysis of invertase gene family, and expression profiling under abiotic stress conditions in potato. Biology 11:539. 10.3390/biology11040539 - DOI - PMC - PubMed
    1. Abdelghany A. M., Zhang S., Azam M., Shaibu A. S., Feng Y., Qi J., et al. (2021). Exploring the phenotypic stability of soybean seed compositions using multi-trait stability index approach. J. Agronomy 9:23. 10.3390/agronomy11112200 - DOI
    1. Abdelsalam N. R., Balbaa M. G., Osman H. T., Ghareeb R. Y., Desoky E.-S. M., Elshehawi A. M., et al. (2022). Inheritance of resistance against northern leaf blight of maize using conventional breeding methods. Saudi J. Biol. Sci. 29 1747–1759. 10.1016/j.sjbs.2021.10.055 - DOI - PMC - PubMed
    1. Adebayo M., Menkir A., Blay E., Gracen V., Danquah E., Hearne S. (2014). Genetic analysis of drought tolerance in adapted× exotic crosses of maize inbred lines under managed stress conditions. Euphytica 196 261–270. 10.1007/s10681-013-1029-5 - DOI
    1. Afzal I., Imran S., Javed T., Basra S. M. A. (2020). Evaluating the integrative response of moringa leaf extract with synthetic growth promoting substances in maize under early spring conditions. South Afr. J. Bot. 132 378–387. 10.1016/j.sajb.2020.04.025 - DOI

LinkOut - more resources