. 2022 May;9(5):532-544.
doi: 10.1364/OPTICA.454790. Epub 2022 May 9.

In vitro and in vivo NIR fluorescence lifetime imaging with a time-gated SPAD camera

Affiliations

In vitro and in vivo NIR fluorescence lifetime imaging with a time-gated SPAD camera

Jason T Smith et al. Optica. 2022 May.

Abstract

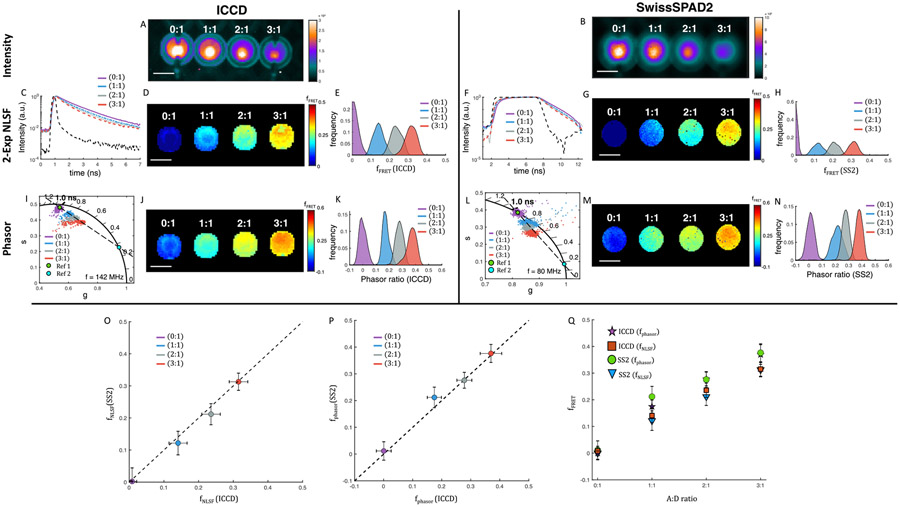
Near-infrared (NIR) fluorescence lifetime imaging (FLI) provides a unique contrast mechanism to monitor biological parameters and molecular events in vivo. Single-photon avalanche diode (SPAD) cameras have been recently demonstrated in FLI microscopy (FLIM) applications, but their suitability for in vivo macroscopic FLI (MFLI) in deep tissues remains to be demonstrated. Herein, we report in vivo NIR MFLI measurement with SwissSPAD2, a large time-gated SPAD camera. We first benchmark its performance in well-controlled in vitro experiments, ranging from monitoring environmental effects on fluorescence lifetime, to quantifying Förster resonant energy transfer (FRET) between dyes. Next, we use it for in vivo studies of target-drug engagement in live and intact tumor xenografts using FRET. Information obtained with SwissSPAD2 was successfully compared to that obtained with a gated intensified charge-coupled device (ICCD) camera, using two different approaches. Our results demonstrate that SPAD cameras offer a powerful technology for in vivo preclinical applications in the NIR window.


Figures

Fig. 1.
Fig. 1.
Environment effects on IRDye 800CW-2DG. A and B, fluorescence intensity images. A, ICCD, MCP voltage = 400 V; integration time = 308 ms; illumination power = 0.76 mW/cm2. B, SS2, integration time = 1.02 s; illumination power = 1.53 mW/cm2. All wells were prepared at constant fluorophore concentration (15 μM) and are labeled with their respective buffer/pH. C and F, representative ICCD and SS2 normalized single-pixel decays for three of the wells, plotted with the corresponding IRF. D and G, lifetime maps obtained by NLSF. E and H, boxplot summarizing lifetime results for all wells. I and L, phasor plot for each well. J and M, pixel-wise phase lifetime maps obtained with the ICCD and SS2 detectors. K and N, boxplot quantifying phase lifetime results for all wells. O, scatter plot of averaged lifetime results for ICCD and SS2. P, scatter plot of SS2 phase lifetime versus ICCD phase lifetime. Q and R, scatter plot of averaged NLSF lifetime results versus averaged phase lifetime results for both ICCD and SS2, respectively. Error bars represent 1 standard deviation in O–R. Scale bar in A, B, D, G, J, M is 3 mm.
Fig. 2.
Fig. 2.
AF700/AF750 FRET pair series. A and B, fluorescence intensity images. A, ICCD, MCP voltage = 450 V; integration time = 359 ms; illumination power = 1.52 mW/cm2. B, SS2, integration time = 4.08 s; illumination power = 2.29 mW/cm2; wells contained solutions of labeled antibodies in PBS buffer with acceptor to donor A:D ratio from 0:1 to 3:1 indicated above each well, with a constant donor fluorophore concentration of 32 μM. C and F, representative ICCD and SS2 normalized single-pixel decays for the different wells, plotted with the corresponding IRF on a semilog scale. D and G, MFLI-FRET fraction maps obtained by bi-exponential NLSF for both cameras. E and H, corresponding fFRET KDE distributions for each well obtained for both cameras. I and L, phasor scatter plots overlaid with linear fit (dashed black line) and reference lifetimes set as the centroid of the donor-only well’s cluster (green dot, reference 1) and as the linear fit intersection with the SEPL (blue dot, reference 2)—resulting in τ1ICCD = 0.98 ns, τ2,ICCD = 0.27 ns and τ1,SS2 = 1.01 ns, τ2,SS2 = 0.17 ns. J and M, pixel-wise phasor ratio maps. K and N, phasor ratio KDE distributions for the different wells (acceptor-donor ratios indicated A:D in parenthesis, color code matching that of panels I, L). O, scatter plot (mean ± standard deviation) showing the FRET fraction measured via bi-exponential NLSF for each well with the ICCD versus that measured with SS2. P, scatter plot of phasor ratio results (mean ± standard deviation) for ICCD and SS2. Q, scatter plot of FRET fractions obtained by NLSF (panels C–H) and phasor ratio results for ICCD and SS2 (panels I–N) as a function of A:D ratio. Scale bar in A, B, D, G, J, M is 3 mm.
Fig. 3.
Fig. 3.
In vivo Trastuzumab-HER2 receptor engagement. Mice were injected with 20 μg of AF700-TZM and 40 μg of AF750-TZM and imaged by MFLI at 24 h post-injection (p.i.). Mouse 1 was imaged with the ICCD and mouse 2 with SS2. A and B, fluorescence intensity images. A, ICCD, MCP voltage = 500 V; integration time = 500 ms; illumination power = 2.13 mW/cm2. B, SS2, integration time = 2.65 s; illumination power = 3.2 mW/cm2. C and F, ICCD and SS2 normalized whole ROI decays for the different organs, plotted with the corresponding IRF. D and G, MFLI-FRET fraction maps obtained by bi-exponential NLSF for both cameras. The urinary bladder (yellow dashed outline) was analyzed by 1-Exp NLSF and is, therefore, not included. E and H, corresponding fFRET KDE distributions for each xenograft obtained for both cameras. I and L, phasor scatter plots color-coded by ROI, with overlaid reference lifetimes (green dot, reference 1; blue dot, reference 2) and dashed black line connecting them. J and M, pixel-wise phasor ratio maps. K and N, phasor ratio KDE distributions for the two xenografts. O, scatter plot (mean ± standard deviation) showing the FRET fraction measured for each tumor with SS2 (mouse 2) versus that measured with the ICCD (mouse 1) retrieved through bi-exponential NLSF. P, scatter plot of phasor ratio results (mean ± standard deviation) for ICCD and SS2. Scale bar in A, B, D, G, J, M is 6 mm. Q, ex vivo IHC of intracellular accumulation of TZM in AU565 and SK-OV-3 tumors in mouse 2. Consecutive sections were processed for H&E (showing cell localization and context), anti-HER2, and anti-TZM immunohistochemical staining. NovaRED was used as peroxidase substrate (brown stain), tissue was counterstained with methyl green. Scale bar = 100 μm.
Fig. 4.
Fig. 4.
In vivo cetuximab-EGFR engagement. Mice were injected with 20 μg AF700-CTM and 40 μg AF750-CTM and subjected to MFLI imaging at 48 h p.i. (mouse 1, ICCD; mouse 2, SS2). A and B, whole body fluorescence intensity images for ICCD and SS2. A, ICCD, MCP voltage = 520 V; integration time = 500 ms; illumination power = 2.13 mW/cm2. B, SS2, integration time = 2.45 s, illumination power = 3.2 mW/cm2. C and F, ICCD and SS2 normalized whole ROI decays for the different organs, plotted with the corresponding IRF. D and G, MFLI-FRET fraction maps obtained by biexponential NLSF for both cameras. The urinary bladder (yellow dashed outline) was analyzed by 1-Exp NLSF and is, therefore, included as a constant 0 fraction. A zoomed in view of fFRET quantification retrieved for both xenografts with color scale adjusted to match that used in Fig. 3 is shown on the right. E and H, corresponding fFRET KDE distributions for each well obtained for both cameras. I and L, phasor scatter plots color-coded by ROI, with overlaid reference lifetimes (green dot, reference 1; blue dot, reference 2) and dashed black line connecting them. J and M, pixel-wise phasor ratio maps. A zoomed in view of phasor ratio quantification retrieved for both xenografts with color scale adjusted to match that used in Fig. 3 is shown on the right. K and N, phasor ratio KDE distributions for the two xenografts and the liver. O, scatter plot (mean ± standard deviation) showing the FRET fraction measured for each tumor and the liver with SS2 (mouse 2) versus that measured with the ICCD (mouse 1). P, scatter plot of phasor ratio results (mean ± standard deviation) for ICCD and SS2. Scale bar in A, B, D, G, J, M is 6 mm. Q, ex vivo IHC validation of intracellular localization of EGFR and HER2 in AU565 and SK-OV-3 tumors in mouse 2. Consecutive sections were processed for H&E (showing cell localization and context), anti-HER2, and anti-EGFR immunohistochemical staining. NovaRED was used as peroxidase substrate (brown stain), tissue was counterstained with methyl green. Scale bar = 100 μm.
Fig. 5.
Fig. 5.
Schematic illustration of the widefield time-resolved imaging system equipped with the SwissSPAD2 camera. All imaging was performed in reflectance geometry. A fs pulsed, tunable Ti:sapphire laser beam was directed through a power control module before coupling into a multimode fiber (blue line). The divergent output of the fiber was directed toward the sample to achieve a Gaussian illumination profile. Light emitted by the sample was collected using an overhead macroscopic objective lens directly attached to the C-mount port in front of SwissSPAD2 (SS2, green PCB boards and photograph inset). SS2 is powered by two regulated external power supplies (red lines) and a small DC adapter. A TTL pulse derived from the laser trigger signal by a frequency divider module is used to synchronize data acquisition (thick black line). Data are transferred to a PC via a USB 3 cable (thin black cable).

Similar articles

Cited by

References

    1. Rudin M and Weissleder R, “Molecular imaging in drug discovery and development,” Nat. Rev. Drug Disc 2, 123–131 (2003). - PubMed
    1. Waaijer SJH, Kok IC, Eisses B, Schröder CP, Jalving M, Brouwers AH, Hooge-de Lub MN, and Vriesde EGE, “Molecular imaging in cancer drug development,” J. Nucl. Med 59, 726–732 (2018). - PubMed
    1. Licha K and Olbrich C, “Optical imaging in drug discovery and diagnostic applications,” Adv. Drug Deliv. Rev 57, 1087–1108 (2005). - PubMed
    1. Matthews PM, Rabiner EA, Passchier J, and Gunn RN, “Positron emission tomography molecular imaging for drug development,” Br. J. Clin. Pharmacol 73, 175–186 (2012). - PMC - PubMed
    1. Giron MC, “Radiopharmaceutical pharmacokinetics in animals: critical considerations,” Q. J. Nucl. Med. Mol. Imaging 53, 359–364 (2009). - PubMed

LinkOut - more resources