. 2022 Jul 29:16:944432.
doi: 10.3389/fnins.2022.944432. eCollection 2022.

Histopathological modeling of status epilepticus-induced brain damage based on in vivo diffusion tensor imaging in rats

Affiliations

Histopathological modeling of status epilepticus-induced brain damage based on in vivo diffusion tensor imaging in rats

Isabel San Martín Molina et al. Front Neurosci. .

Abstract

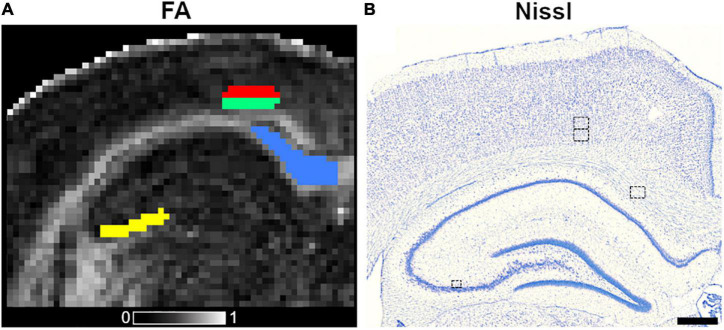
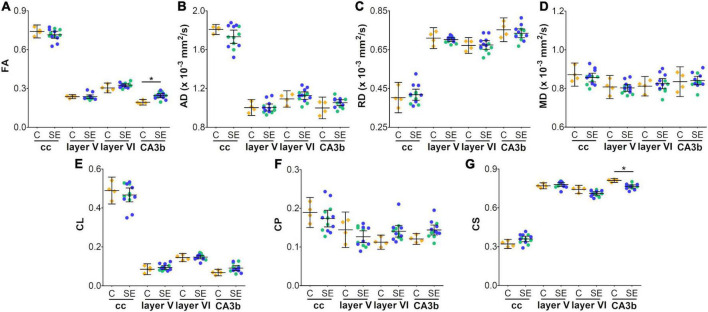
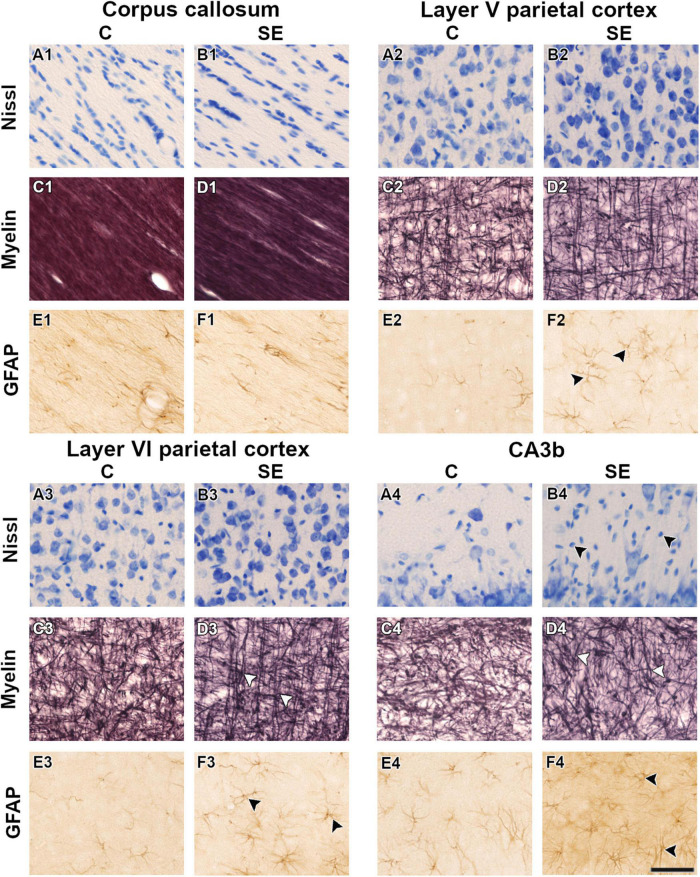
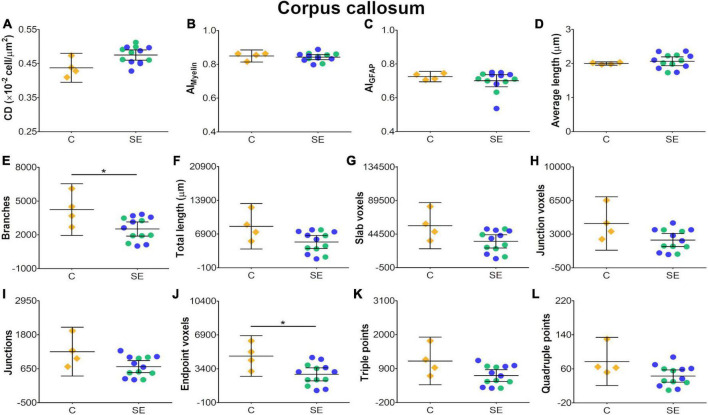
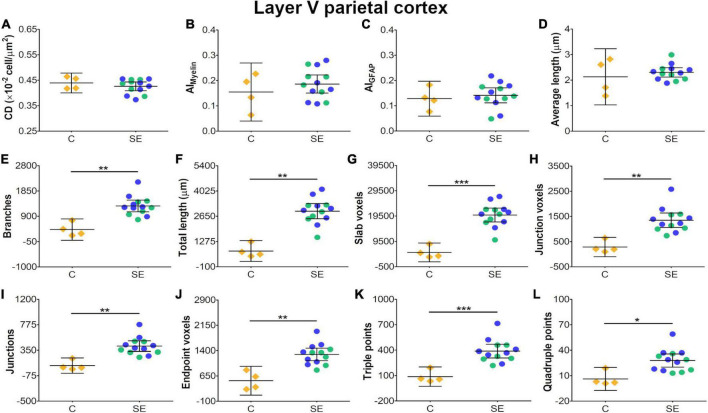
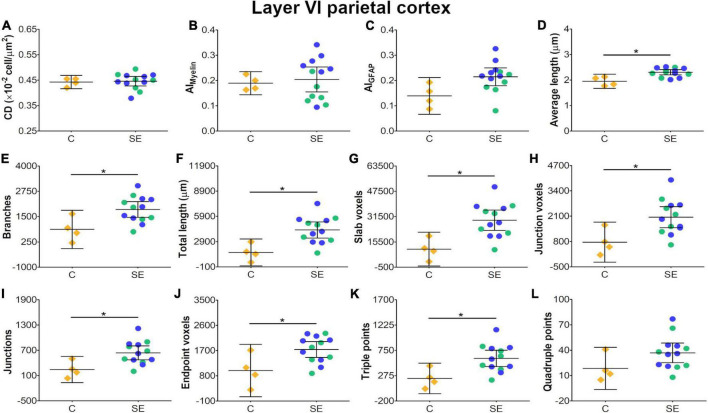
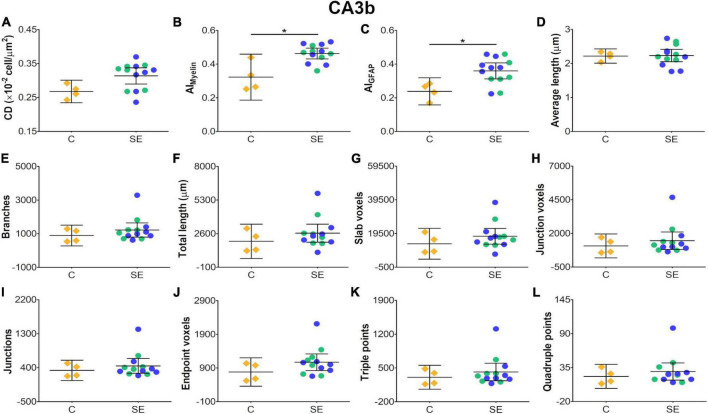
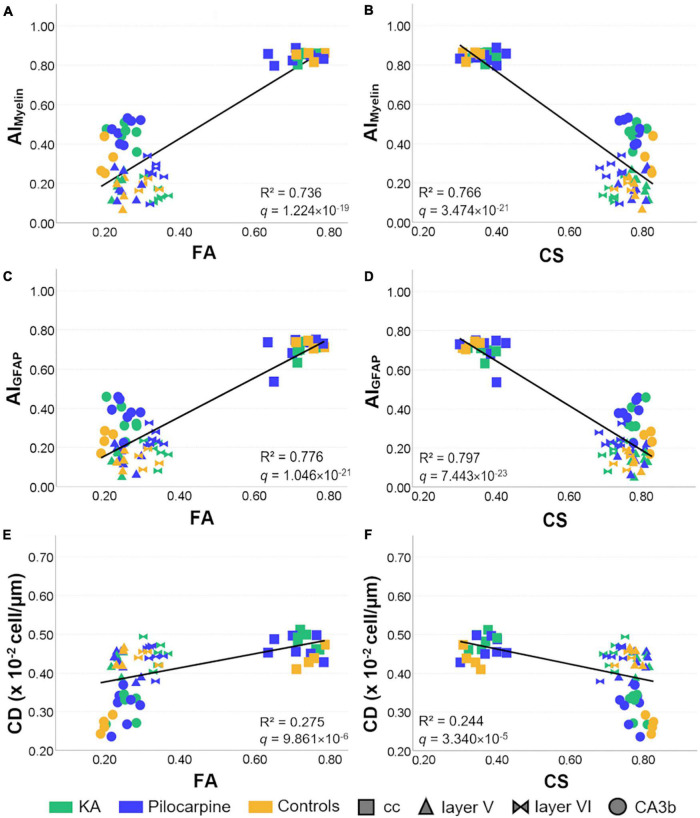
Non-invasive magnetic resonance imaging (MRI) methods have proved useful in the diagnosis and prognosis of neurodegenerative diseases. However, the interpretation of imaging outcomes in terms of tissue pathology is still challenging. This study goes beyond the current interpretation of in vivo diffusion tensor imaging (DTI) by constructing multivariate models of quantitative tissue microstructure in status epilepticus (SE)-induced brain damage. We performed in vivo DTI and histology in rats at 79 days after SE and control animals. The analyses focused on the corpus callosum, hippocampal subfield CA3b, and layers V and VI of the parietal cortex. Comparison between control and SE rats indicated that a combination of microstructural tissue changes occurring after SE, such as cellularity, organization of myelinated axons, and/or morphology of astrocytes, affect DTI parameters. Subsequently, we constructed a multivariate regression model for explaining and predicting histological parameters based on DTI. The model revealed that DTI predicted well the organization of myelinated axons (cross-validated R = 0.876) and astrocyte processes (cross-validated R = 0.909) and possessed a predictive value for cell density (CD) (cross-validated R = 0.489). However, the morphology of astrocytes (cross-validated R > 0.05) was not well predicted. The inclusion of parameters from CA3b was necessary for modeling histopathology. Moreover, the multivariate DTI model explained better histological parameters than any univariate model. In conclusion, we demonstrate that combining several analytical and statistical tools can help interpret imaging outcomes to microstructural tissue changes, opening new avenues to improve the non-invasive diagnosis and prognosis of brain tissue damage.

Keywords: astrocyte morphology; cell counting; diffusion tensor imaging; predictive modeling; structure tensor analysis.


Conflict of interest statement

The authors declare that the research was conducted in the absence of any commercial or financial relationships that could be construed as a potential conflict of interest.

Figures

FIGURE 1
FIGURE 1
Outlined ROIs in coronal fractional anisotropy (FA) map (A) and Nissl-stained section (B) from a control animal. The ROIs included in this study are corpus callosum (blue color), subfield CA3b of the hippocampus (yellow), layers V (red), and VI (green) of the parietal cortex, and the equivalent in the Nissl-stained section. The ROI area outlined on the histological photomicrographs in the left corpus callosum, layers V and VI of the parietal cortices was 180.81 × 141.31 μm2, whereas the ROI area in CA3b was 104.42 μm2 × 89.89 μm2. The gray scale reveals FA values between 0 (black) and 1 (white). Scale bar: 500 μm.
FIGURE 2
FIGURE 2
In vivo DTI parameters in control and status epilepticus animals at 79 days (A–G). Controls are represented as yellow diamonds, kainic acid-treated as green, and pilocarpine-treated as blue circles, respectively. The bars represent mean values with 95% CI. Differences between C and SE animals are denoted with asterisks (BH-FDR-corrected q-value * < 0.05; two-sided permutation t-test). SE animals exhibited an increase in FA (A) or a decrease in CS (G) parameters in the subfield CA3b as compared to controls. AD, axial diffusivity; C, control; CA, cornus ammonis; cc, corpus callosum; CL, linear anisotropy; CP, planar anisotropy; CS, spherical anisotropy; FA, fractional anisotropy; MD, mean diffusivity; RD, radial diffusivity; SE, status epilepticus.
FIGURE 3
FIGURE 3
Representative high-magnification photomicrographs in Nissl-, myelin-, and GFAP-stained sections of one control (A,C,E) and one status epilepticus (B,D,F) animal in white and gray matter areas. White arrowheads indicate changes in the organization of myelinated axons (D3,D4). Black arrowheads indicate increased cellularity (B4) and an increase in the number of astrocyte processes and length (F2,F3,F4) at 79 days post-SE. The same animals are shown in the three stainings. Scale bar: 50 μm. C, control; CA, cornus ammonis; GFAP, glial fibrillary acidic protein; SE, status epilepticus.
FIGURE 4
FIGURE 4
Histological-derived parameters from automated cell counting analyses (A), structure tensor (ST)-based analyses of myelin (B), and ST (C) and skeleton-based analysis (D–L) from GFAP-stained sections in the corpus callosum. Controls are represented as yellow diamonds, kainic acid-treated as green, and pilocarpine-treated as blue circles, respectively. The bars represent the mean values with 95% CI. Differences between C and SE animals are denoted with asterisks (BH-FDR-corrected q-value * < 0.05; two-side permutation t-test). SE animals exhibited decreases in branches (E) and endpoint voxels (J) parameters as compared to controls. AI, anisotropy index; C, control; CD, cell density; SE, status epilepticus.
FIGURE 5
FIGURE 5
Histological-derived parameters from automated cell counting analyses (A), structure-tensor (ST)-based analyses of myelin (B), and ST (C) and skeleton-based analysis (D–L) from GFAP-stained sections in layer V of the parietal cortex. Notations as in Figure 4. SE animals revealed increases in all skeleton-based parameters (E–L) as compared to controls (BH-FDR-corrected q-values * < 0.05, ** < 0.01, *** < 0.001; two-side permutation t-test). AI, anisotropy index; C, control; CD, cell density; SE, status epilepticus.
FIGURE 6
FIGURE 6
Histological-derived parameters from automated cell counting analyses (A), structure-tensor (ST)-based analyses of myelin (B), and ST (C) and skeleton-based analysis (D–L) from GFAP-stained sections in layer VI of the parietal cortex. Notations as in Figure 4. SE animals exhibited increases in average length (D) and in all skeleton-based parameters (E–L) as compared to controls (BH-FDR-corrected q-value * < 0.05; two-side permutation t-test). AI, anisotropy index; C, control; CD, cell density; SE, status epilepticus.
FIGURE 7
FIGURE 7
Histological-derived parameters from automated cell counting analyses (A), structure-tensor (ST)-based analyses of myelin (B), and ST (C) and skeleton-based analysis (D–L) from GFAP-stained sections in the subfield CA3b. Notations as in Figure 4. SE animals revealed increases in AIMyelin (B) and AIGFAP (C) parameters as compared to controls (BH-FDR-corrected q-value * < 0.05; two-side permutation t-test). AI, anisotropy index; C, control; CD, cell density; SE, status epilepticus.
FIGURE 8
FIGURE 8
Representative relationships between DTI and histological parameters in all selected brain regions. The line represents the regression fit between histological and DTI parameters. Controls and status epilepticus animals are represented by colors, while brain regions by shapes. FA and CS showed large effects in AIMyelin and AIGFAP (A–D), while medium in CD (E,F) when analyzing the relationships between DTI and histological parameters individually. R2 and BH-FDR corrected q-values for the univariate Pearson’s correlation between DTI and histological parameters are shown in each graph. FA, fractional anisotropy; AI, anisotropy index; CA, cornus ammonis; cc, corpus callosum; CD, cell density; CS, spherical anisotropy.

Similar articles

Cited by

References

    1. Alexander A. L., Lee J. E., Lazar M., Field A. S. (2007). Diffusion tensor imaging of the brain. Neurotherapeutics 4 316–329. 10.1016/j.nurt.2007.05.011 - DOI - PMC - PubMed
    1. Arganda-Carreras I., Fernández-González R., Muñoz-Barrutia A., Ortiz-De-Solorzano C. (2010). 3D reconstruction of histological sections: application to mammary gland tissue. Microsc. Res. Tech. 73 1019–1029. 10.1002/jemt.20829 - DOI - PubMed
    1. Augustinack J. C., Helmer K., Huber K. E., Kakunoori S., Zöllei L., Fischl B. (2010). Direct visualization of the perforant pathway in the human brain with ex vivo diffusion tensor imaging. Front. Hum. Neurosci. 4:42. 10.3389/fnhum.2010.00042 - DOI - PMC - PubMed
    1. Avignone E., Lepleux M., Angibaud J., Nägerl U. V. (2015). Altered morphological dynamics of activated microglia after induction of status epilepticus. J. Neuroinflammation 12:202. 10.1186/s12974-015-0421-6 - DOI - PMC - PubMed
    1. Basser P. J., Pierpaoli C. (1996). Microstructural and physiological features of tissues elucidated by quantitative-diffusion-tensor MRI. J. Magn. Reson. B 111 209–219. 10.1006/jmrb.1996.0086 - DOI - PubMed

LinkOut - more resources