Parkinson's disease detection based on multi-pattern analysis and multi-scale convolutional neural networks
- PMID: 35968382
- PMCID: PMC9363757
- DOI: 10.3389/fnins.2022.957181
Parkinson's disease detection based on multi-pattern analysis and multi-scale convolutional neural networks
Abstract
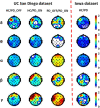
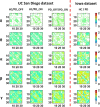
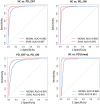
Parkinson's disease (PD) is a complex neurodegenerative disease. At present, the early diagnosis of PD is still extremely challenging, and there is still a lack of consensus on the brain characterization of PD, and a more efficient and robust PD detection method is urgently needed. In order to further explore the features of PD based on brain activity and achieve effective detection of PD patients (including OFF and ON medications), in this study, a multi-pattern analysis based on brain activation and brain functional connectivity was performed on the brain functional activity of PD patients, and a novel PD detection model based on multi-scale convolutional neural network (MCNN) was proposed. Based on the analysis of power spectral density (PSD) and phase-locked value (PLV) features of multiple frequency bands of two independent resting-state electroencephalography (EEG) datasets, we found that there were significant differences in PSD and PLV between HCs and PD patients (including OFF and ON medications), especially in the β and γ bands, which were very effective for PD detection. Moreover, the combined use of brain activation represented by PSD and functional connectivity patterns represented by PLV can effectively improve the performance of PD detection. Furthermore, our proposed MCNN model shows great potential for automatic PD detection, with cross-validation accuracy, sensitivity, specificity, and area under the receiver operating characteristic curve all above 99%. Our study may help to further understand the characteristics of PD and provide new ideas for future PD diagnosis based on spontaneous EEG activity.
Keywords: EEG; Parkinson’s disease; disease detection; multi-pattern analysis; multi-scale convolutional neural networks.
Copyright © 2022 Qiu, Li and Pan.
Conflict of interest statement
The authors declare that the research was conducted in the absence of any commercial or financial relationships that could be construed as a potential conflict of interest.
Figures


Similar articles
-
A Comparative Study of Machine Learning and Deep Learning Models for Automatic Parkinson's Disease Detection from Electroencephalogram Signals.Diagnostics (Basel). 2025 Mar 19;15(6):773. doi: 10.3390/diagnostics15060773. Diagnostics (Basel). 2025. PMID: 40150115 Free PMC article.
-
Quantitative High Density EEG Brain Connectivity Evaluation in Parkinson's Disease: The Phase Locking Value (PLV).J Clin Med. 2023 Feb 11;12(4):1450. doi: 10.3390/jcm12041450. J Clin Med. 2023. PMID: 36835985 Free PMC article.
-
An efficient Parkinson's disease detection framework: Leveraging time-frequency representation and AlexNet convolutional neural network.Comput Biol Med. 2024 May;174:108462. doi: 10.1016/j.compbiomed.2024.108462. Epub 2024 Apr 9. Comput Biol Med. 2024. PMID: 38599069
-
Deep learning reveals personalized spatial spectral abnormalities of high delta and low alpha bands in EEG of patients with early Parkinson's disease.J Neural Eng. 2021 Dec 24;18(6). doi: 10.1088/1741-2552/ac40a0. J Neural Eng. 2021. PMID: 34875634
-
The study of brain functional connectivity in Parkinson's disease.Transl Neurodegener. 2016 Oct 28;5:18. doi: 10.1186/s40035-016-0066-0. eCollection 2016. Transl Neurodegener. 2016. PMID: 27800157 Free PMC article. Review.
Cited by
-
Exploring the application and challenges of fNIRS technology in early detection of Parkinson's disease.Front Aging Neurosci. 2024 Mar 8;16:1354147. doi: 10.3389/fnagi.2024.1354147. eCollection 2024. Front Aging Neurosci. 2024. PMID: 38524116 Free PMC article.
-
A Comparative Study of Machine Learning and Deep Learning Models for Automatic Parkinson's Disease Detection from Electroencephalogram Signals.Diagnostics (Basel). 2025 Mar 19;15(6):773. doi: 10.3390/diagnostics15060773. Diagnostics (Basel). 2025. PMID: 40150115 Free PMC article.
-
Distinguishing Parkinson's Disease with GLCM Features from the Hankelization of EEG Signals.Diagnostics (Basel). 2023 May 17;13(10):1769. doi: 10.3390/diagnostics13101769. Diagnostics (Basel). 2023. PMID: 37238253 Free PMC article.
-
Artificial intelligence for brain disease diagnosis using electroencephalogram signals.J Zhejiang Univ Sci B. 2024 Oct 15;25(10):914-940. doi: 10.1631/jzus.B2400103. J Zhejiang Univ Sci B. 2024. PMID: 39420525 Free PMC article. Review.
-
Parkinson's disease detection from EEG signal employing autoencoder and RBFNN-based hybrid deep learning framework utilizing power spectral density.Digit Health. 2024 Nov 12;10:20552076241297355. doi: 10.1177/20552076241297355. eCollection 2024 Jan-Dec. Digit Health. 2024. PMID: 39539721 Free PMC article.
References
-
- Chang C.-C., Lin C.-J. (2011). LIBSVM: a library for support vector machines. ACM Trans. Intell. Systems Technol. (TIST) 2 1–27.
LinkOut - more resources
Full Text Sources
Miscellaneous

