

Natural history and cycle threshold values analysis of COVID-19 in Xiamen City, China
- PMID: 35968394
- PMCID: PMC9361627
- DOI: 10.1016/j.idm.2022.07.007
Natural history and cycle threshold values analysis of COVID-19 in Xiamen City, China
Abstract
Objective: This study elaborated the natural history parameters of Delta variant, explored the differences in detection cycle thresholds (Ct) among cases.
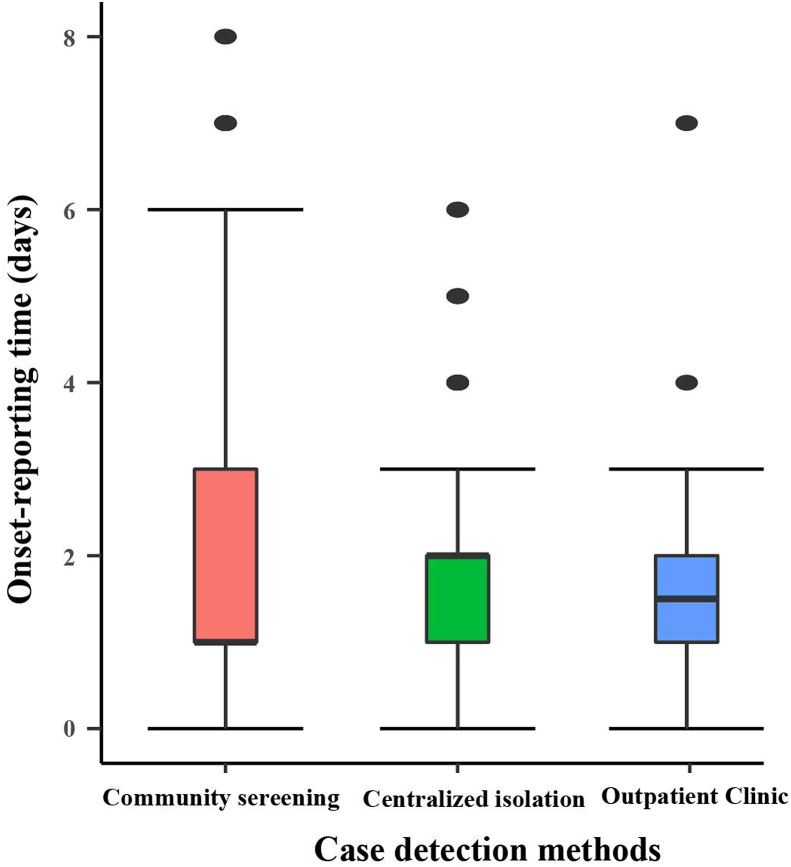
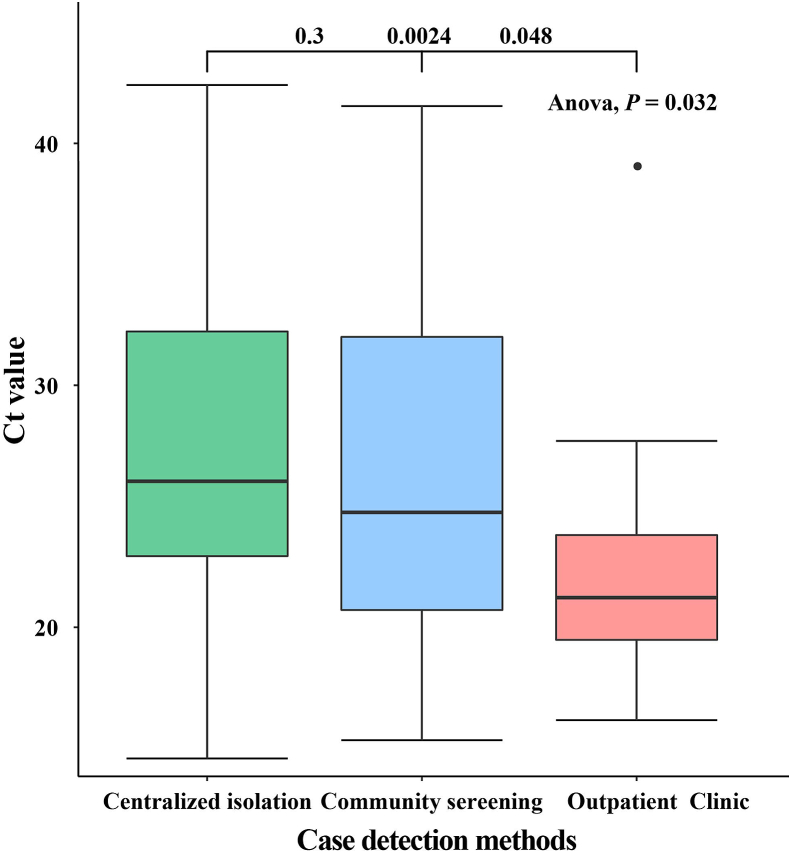
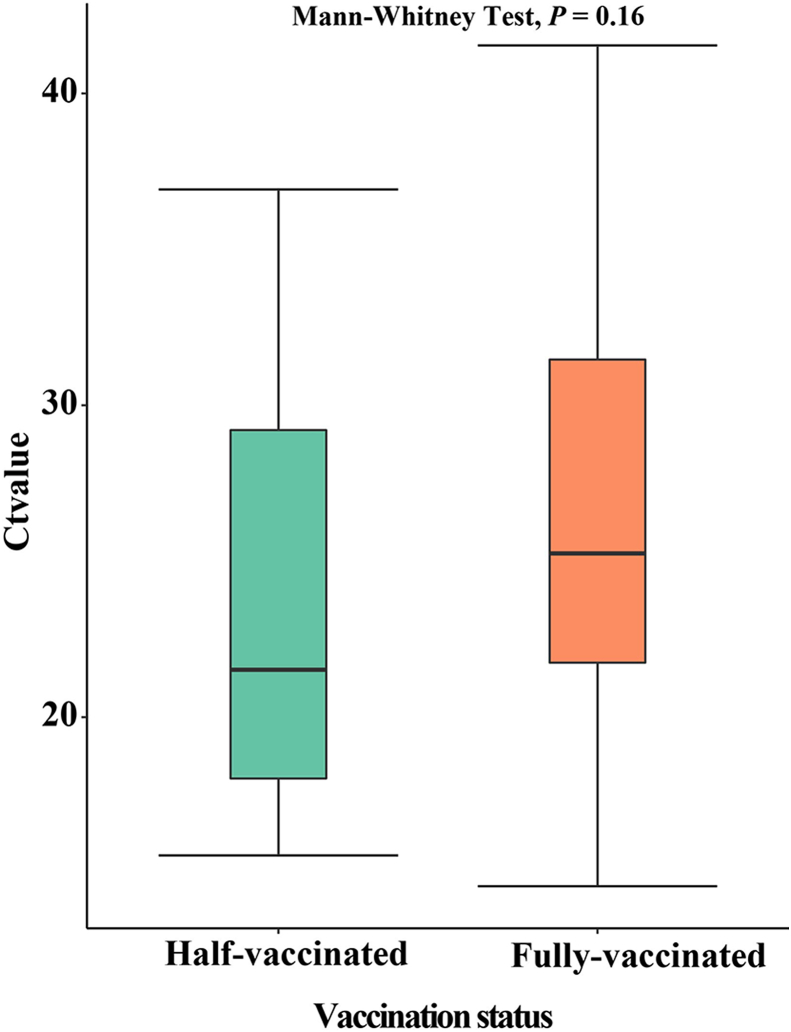
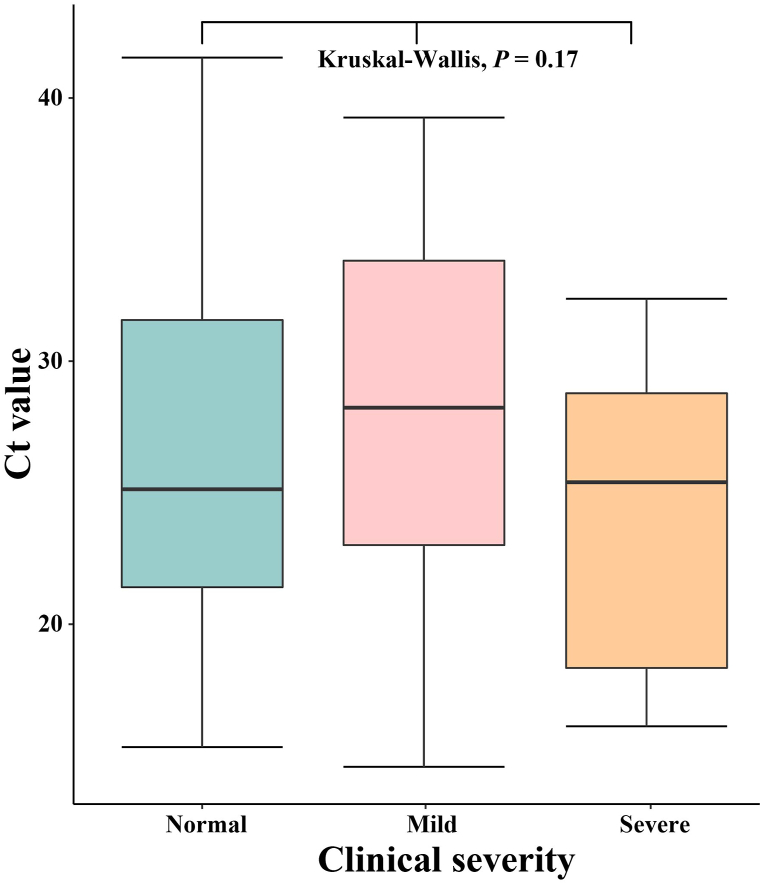
Methods: Natural history parameters were calculated based on the different onset time and exposure time of the cases. Intergenerational relationships between generations of cases were calculated. Differences in Ct values of cases by gender, age, and mode of detection were analyzed statistically to assess the detoxification capacity of cases.
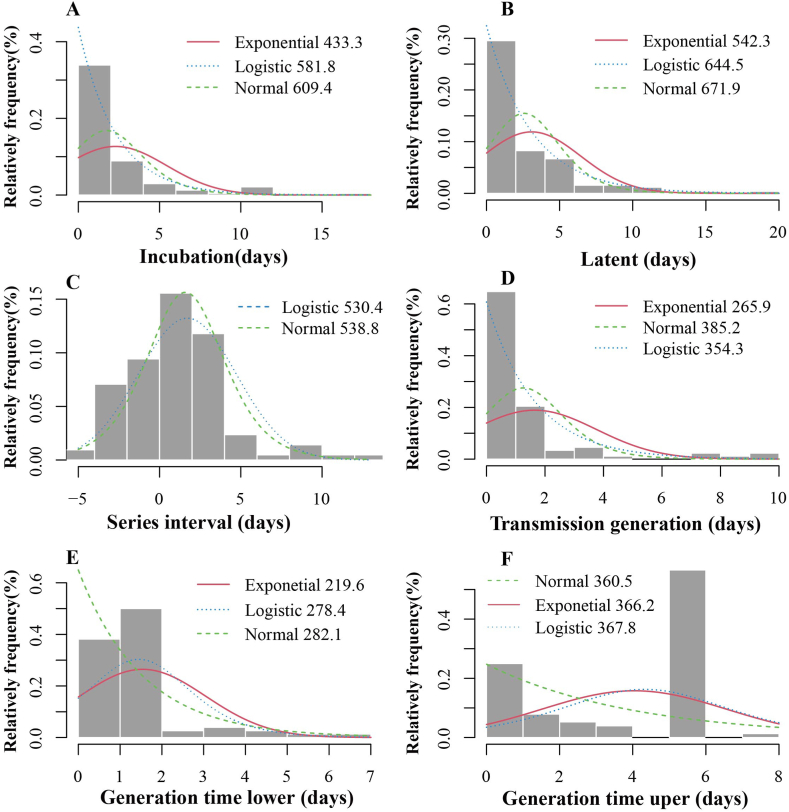
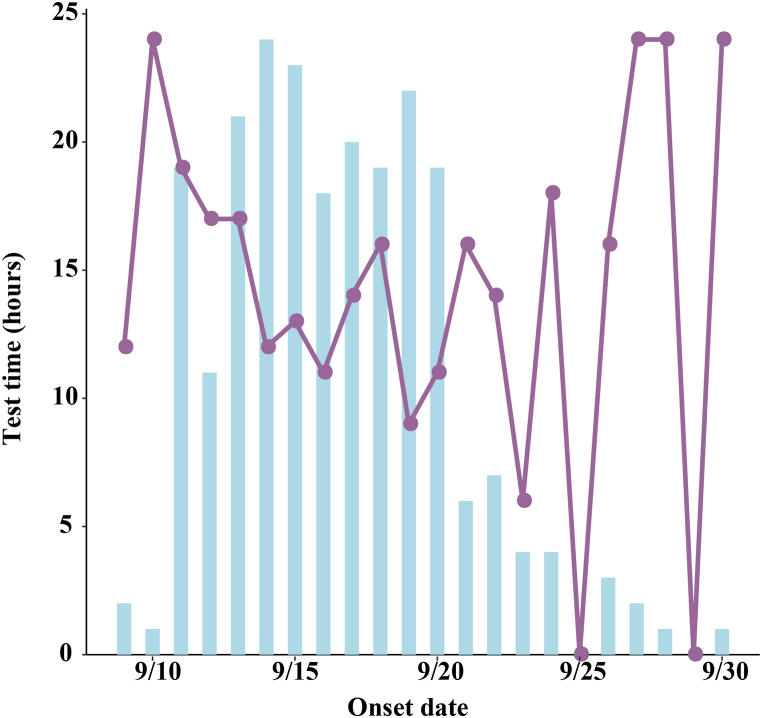
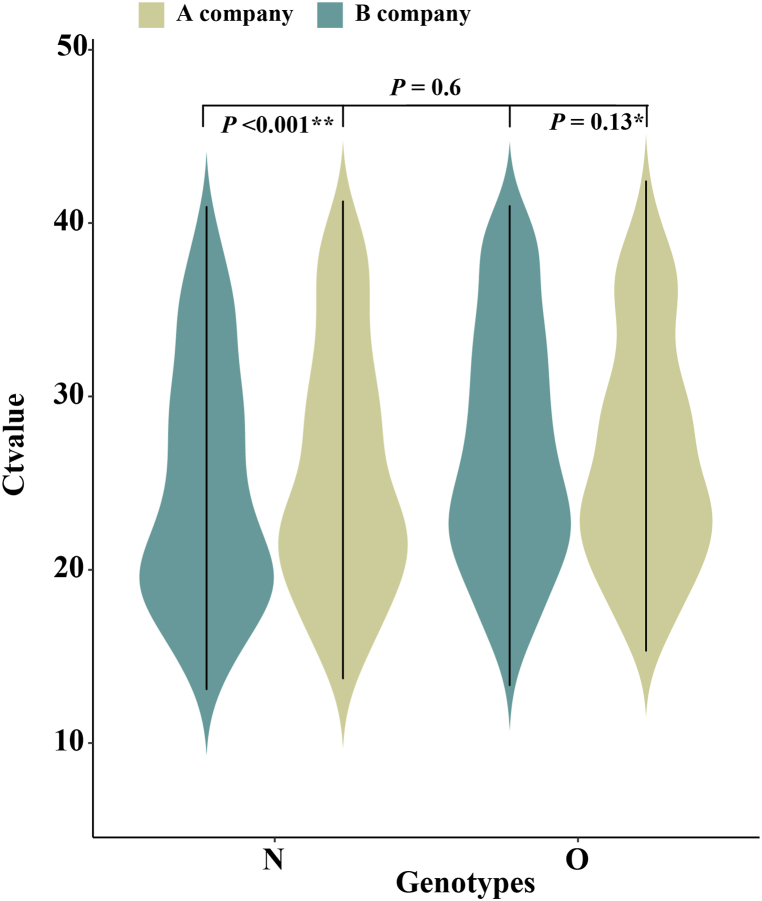
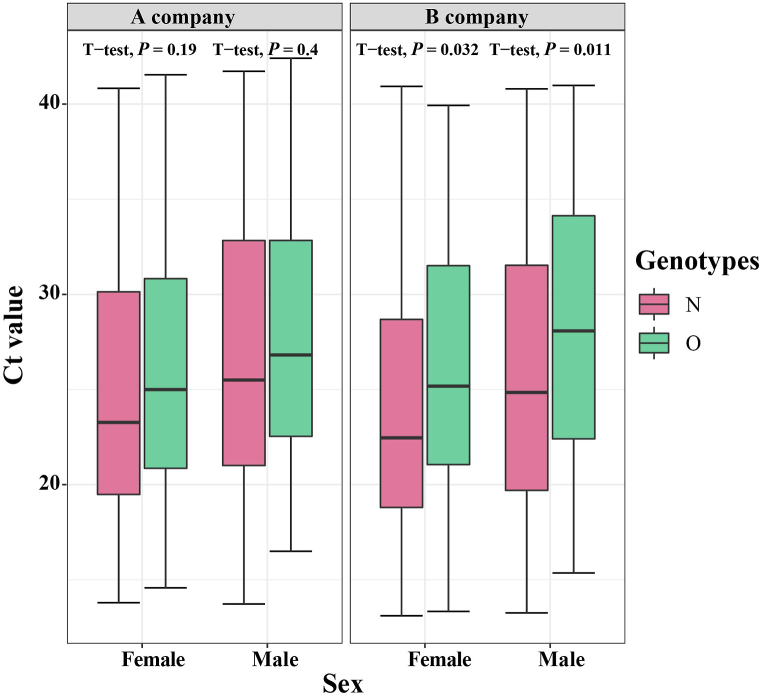
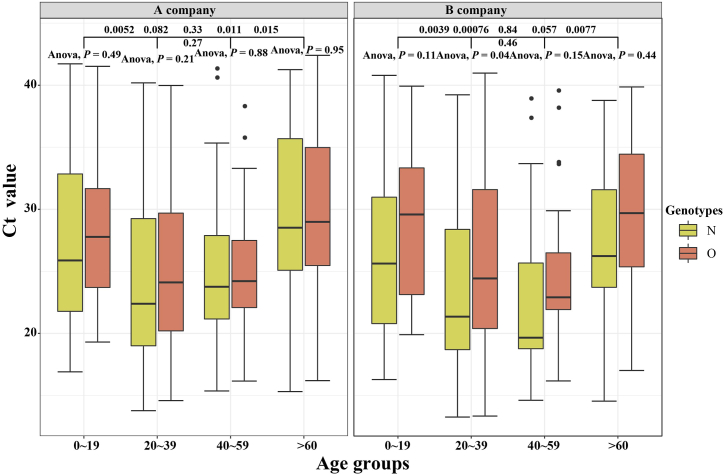
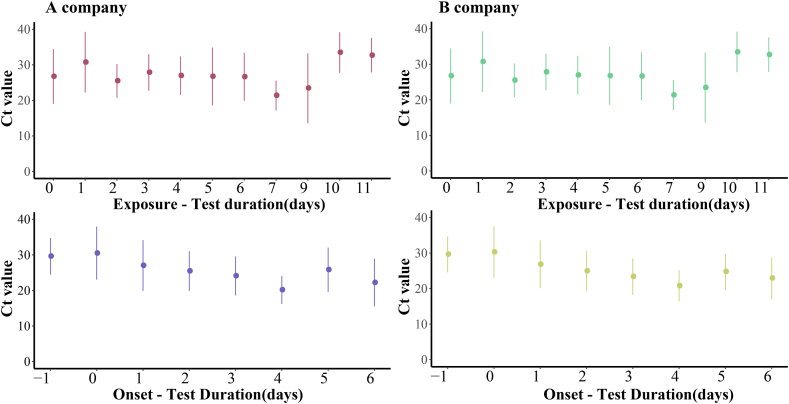
Results: The median incubation period was 4 days; the detection time for cases decreased from 25 to 7 h as the outbreak continued. The average generation time (GT), time interval between transmission generations (TG) and serial interval (SI) were 3.6 ± 2.6 days, 1.67 ± 2.11 days and 1.7 ± 3.0 days. Among the Ct values, we found little differences in testing across companies, but there were some differences in the gender of detected genes. The Ct values continuous to decreased with age, but increased when the age was greater than 60.
Conclusion: This epidemic was started from aggregation of factories. It is more reasonable to use SI to calculate the effective reproduction number and the time-varying reproduction number. And the analysis of Ct values can improve the positive detection rate and improve prevention and control measures.
Keywords: COVID-19; Cycle threshold value; Natural history.
© 2022 The Authors.
Conflict of interest statement
The authors declare that they have no known competing financial interests or personal relationships that could have appeared to influence the work reported in this paper.
Figures
Similar articles
-
A comparative study on the three calculation methods for reproduction numbers of COVID-19.Front Med (Lausanne). 2023 Jan 5;9:1079842. doi: 10.3389/fmed.2022.1079842. eCollection 2022. Front Med (Lausanne). 2023. PMID: 36687425 Free PMC article.
-
[Epidemiological characteristics of COVID-19 caused by 2019-nCoV Delta variant in Shangyu district, Shaoxing of Zhejiang province].Zhonghua Liu Xing Bing Xue Za Zhi. 2022 Jun 10;43(6):846-851. doi: 10.3760/cma.j.cn112338-20220128-00087. Zhonghua Liu Xing Bing Xue Za Zhi. 2022. PMID: 35725340 Chinese.
-
Transmission dynamics and successful control measures of SARS-CoV-2 in the mega-size city of Guangzhou, China.Medicine (Baltimore). 2021 Dec 3;100(48):e27846. doi: 10.1097/MD.0000000000027846. Medicine (Baltimore). 2021. PMID: 35049185 Free PMC article.
-
Model-Based Evaluation of Transmissibility and Intervention Measures for a COVID-19 Outbreak in Xiamen City, China.Front Public Health. 2022 Jul 13;10:887146. doi: 10.3389/fpubh.2022.887146. eCollection 2022. Front Public Health. 2022. PMID: 35910883 Free PMC article.
-
Early reports of epidemiological parameters of the COVID-19 pandemic.Western Pac Surveill Response J. 2021 May 11;12(2):65-81. doi: 10.5365/wpsar.2020.11.3.011. eCollection 2021 Apr-Jun. Western Pac Surveill Response J. 2021. PMID: 34540315 Free PMC article. Review.
Cited by
-
Assessing changes in incubation period, serial interval, and generation time of SARS-CoV-2 variants of concern: a systematic review and meta-analysis.BMC Med. 2023 Sep 29;21(1):374. doi: 10.1186/s12916-023-03070-8. BMC Med. 2023. PMID: 37775772 Free PMC article.
-
A comparative study on the three calculation methods for reproduction numbers of COVID-19.Front Med (Lausanne). 2023 Jan 5;9:1079842. doi: 10.3389/fmed.2022.1079842. eCollection 2022. Front Med (Lausanne). 2023. PMID: 36687425 Free PMC article.
-
Epidemiological features and risk factors of SARS-CoV-2 reinfection: a retrospective cohort analysis in Xiamen, China.J Thorac Dis. 2025 Jul 31;17(7):4732-4745. doi: 10.21037/jtd-24-1703. Epub 2025 Jul 28. J Thorac Dis. 2025. PMID: 40809228 Free PMC article.
References
-
- Aziz N.A., Othman J., Lugova H., Suleiman A. Malaysia's approach in handling COVID-19 onslaught: Report on the Movement Control Order (MCO) and targeted screening to reduce community infection rate and impact on public health and economy. J Infect Public Health. 2020;13(12):1823–1829. - PMC - PubMed
LinkOut - more resources
Full Text Sources
Miscellaneous
