

Single-Cell RNA Sequencing Reveals the Role of Epithelial Cell Marker Genes in Predicting the Prognosis of Colorectal Cancer Patients
- PMID: 35968507
- PMCID: PMC9372514
- DOI: 10.1155/2022/8347125
Single-Cell RNA Sequencing Reveals the Role of Epithelial Cell Marker Genes in Predicting the Prognosis of Colorectal Cancer Patients
Abstract
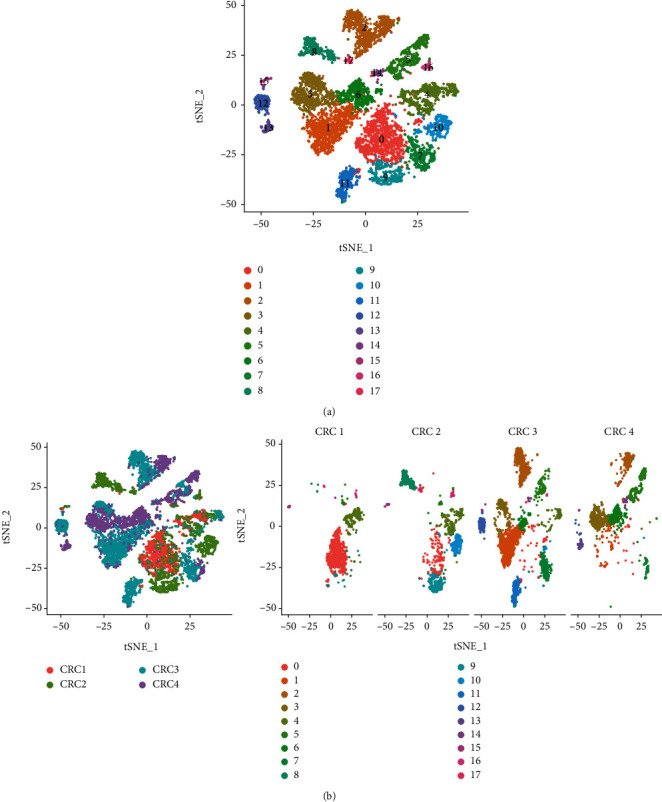
Single-cell RNA sequencing (scRNA-seq) is increasingly used in studies on gastrointestinal cancers. This study investigated the prognostic value of epithelial cell-associated biomarkers in colorectal cancer (CRC) using scRNA-seq data. We downloaded and analysed scRNA-seq data from four CRC samples from the Gene Expression Omnibus (GEO), and we identified marker genes of malignant epithelial cells (MECs) using CRC transcriptome and clinical data downloaded from The Cancer Genome Atlas (TCGA) and GEO as training and validation cohorts, respectively. In the TCGA training cohort, weighted gene correlation network analysis, univariate Cox proportional hazard model (Cox) analysis, and least absolute shrinkage and selection operator regression analysis were performed on the marker genes of MEC subsets to identify a signature of nine prognostic MEC-related genes (MECRGs) and calculate a risk score based on the signature. CRC patients were divided into high- and low-risk groups according to the median risk score. We found that the MECRG risk score was significantly correlated with the clinical features and overall survival of CRC patients, and that CRC patients in the high-risk group showed a significantly shorter survival time. The univariate and multivariate Cox regression analyses showed that the MECRG risk score can serve as an independent prognostic factor for CRC patients. Gene set enrichment analysis revealed that the MECRG signature genes are involved in fatty acid metabolism, p53 signalling, and other pathways. To increase the clinical application value, we constructed a MECRG nomogram by combining the MECRG risk score with other independent prognostic factors. The validity of the nomogram is based on receiver operating characteristics and calibration curves. The MECRG signature and nomogram models were well validated in the GEO dataset. In conclusion, we established an epithelial cell marker gene-based risk assessment model based on scRNA-seq analysis of CRC samples for predicting the prognosis of CRC patients.
Copyright © 2022 Kai-yu Shen et al.
Conflict of interest statement
The authors declare no conflicts of interest.
Figures


Similar articles
-
Integrated analysis of single-cell and bulk RNA-sequencing to predict prognosis and therapeutic response for colorectal cancer.Sci Rep. 2025 Mar 7;15(1):7986. doi: 10.1038/s41598-025-91761-y. Sci Rep. 2025. PMID: 40055390 Free PMC article.
-
Establishment of an ovarian cancer exhausted CD8+T cells-related genes model by integrated analysis of scRNA-seq and bulk RNA-seq.Eur J Med Res. 2024 Jul 5;29(1):358. doi: 10.1186/s40001-024-01948-8. Eur J Med Res. 2024. PMID: 38970067 Free PMC article.
-
Long non-coding RNA profile study identifies a metabolism-related signature for colorectal cancer.Mol Med. 2021 Aug 3;27(1):83. doi: 10.1186/s10020-021-00343-x. Mol Med. 2021. PMID: 34344319 Free PMC article.
-
A mitophagy-related gene signature associated with prognosis and immune microenvironment in colorectal cancer.Sci Rep. 2022 Nov 4;12(1):18688. doi: 10.1038/s41598-022-23463-8. Sci Rep. 2022. PMID: 36333388 Free PMC article.
-
Construction of a novel mRNA-signature prediction model for prognosis of bladder cancer based on a statistical analysis.BMC Cancer. 2021 Jul 27;21(1):858. doi: 10.1186/s12885-021-08611-z. BMC Cancer. 2021. PMID: 34315402 Free PMC article.
Cited by
-
How can HPV E6 manipulate host cell differentiation process to maintain the reservoir of infection.Tumour Virus Res. 2025 Jun;19:200313. doi: 10.1016/j.tvr.2025.200313. Epub 2025 Jan 19. Tumour Virus Res. 2025. PMID: 39832674 Free PMC article. No abstract available.
-
Single cell analysis reveals that SPP1+ macrophages enhance tumor progression by triggering fibroblast extracellular vesicles.Transl Oncol. 2025 May;55:102347. doi: 10.1016/j.tranon.2025.102347. Epub 2025 Mar 13. Transl Oncol. 2025. PMID: 40086324 Free PMC article.
-
Single-Cell Sequencing: An Emerging Tool for Biomarker Development in Nuclear Emergencies and Radiation Oncology.Cancers (Basel). 2025 May 28;17(11):1801. doi: 10.3390/cancers17111801. Cancers (Basel). 2025. PMID: 40507282 Free PMC article. Review.
-
Deciphering colorectal cancer progression features and prognostic signature by single-cell RNA sequencing pseudotime trajectory analysis.Biochem Biophys Rep. 2023 Jun 16;35:101491. doi: 10.1016/j.bbrep.2023.101491. eCollection 2023 Sep. Biochem Biophys Rep. 2023. PMID: 37601456 Free PMC article.
-
Action of circulating and infiltrating B cells in the immune microenvironment of colorectal cancer by single-cell sequencing analysis.World J Gastrointest Oncol. 2024 Jun 15;16(6):2683-2696. doi: 10.4251/wjgo.v16.i6.2683. World J Gastrointest Oncol. 2024. PMID: 38994150 Free PMC article.
References
MeSH terms
Substances
LinkOut - more resources
Full Text Sources
Medical
Research Materials
Miscellaneous
