. 2022 Sep 2;131(6):476-491.
doi: 10.1161/CIRCRESAHA.122.320888. Epub 2022 Aug 15.

Targeting SIRT1 Rescues Age- and Obesity-Induced Microvascular Dysfunction in Ex Vivo Human Vessels

Affiliations

Targeting SIRT1 Rescues Age- and Obesity-Induced Microvascular Dysfunction in Ex Vivo Human Vessels

Alessandro Mengozzi et al. Circ Res. .

Abstract

Background: Experimental evidence suggests a key role of SIRT1 (silent information regulator 1) in age- and metabolic-related vascular dysfunction. Whether these effects hold true in the human microvasculature is unknown. We aimed to investigate the SIRT1 role in very early stages of age- and obesity-related microvascular dysfunction in humans.

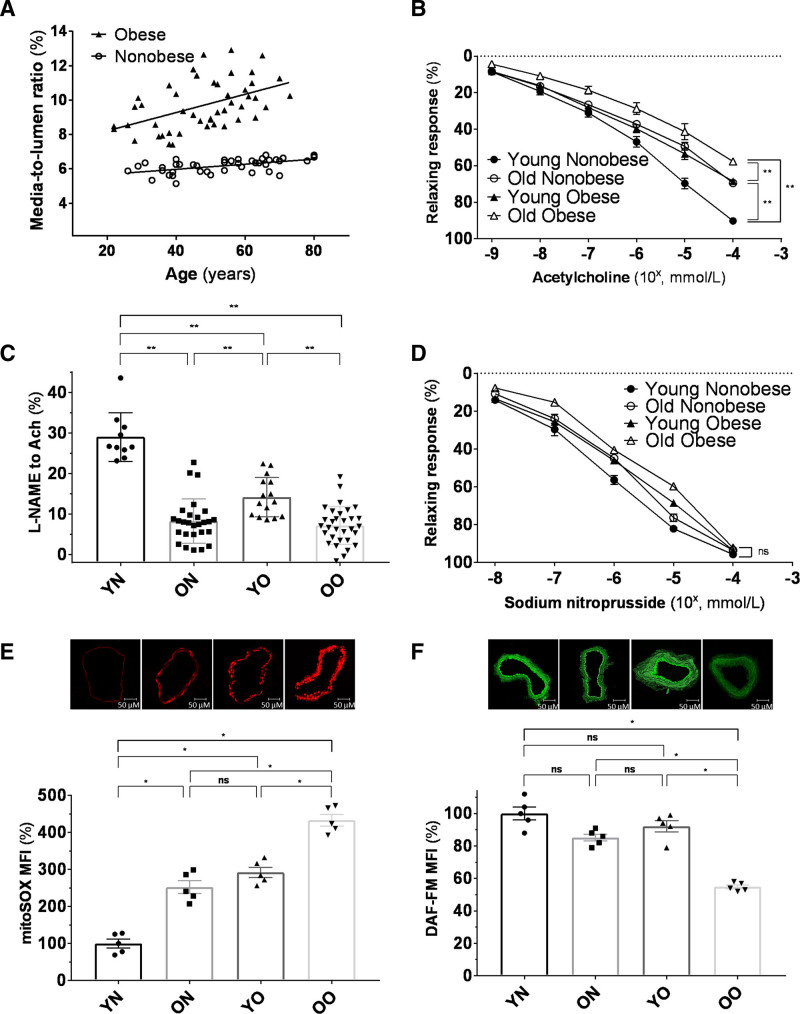
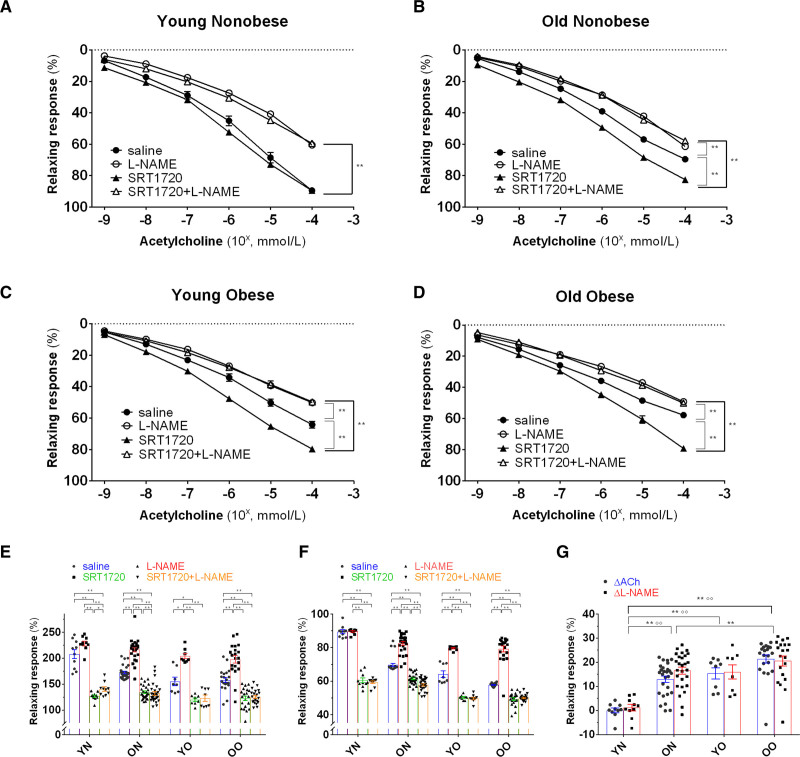
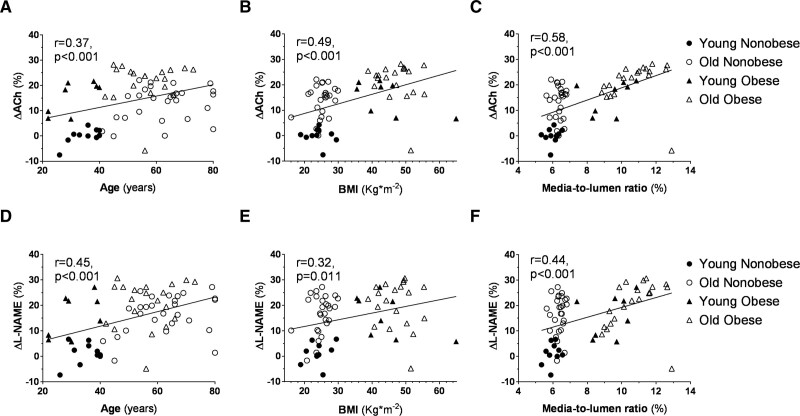
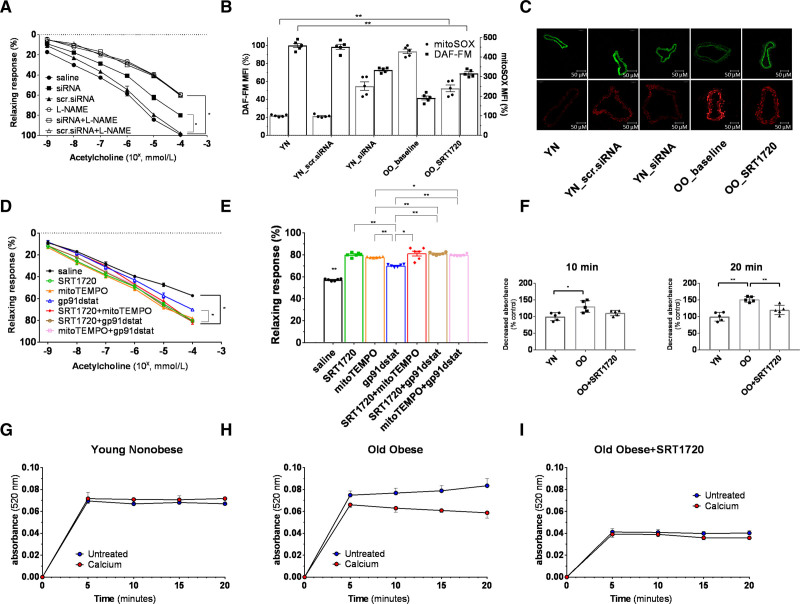
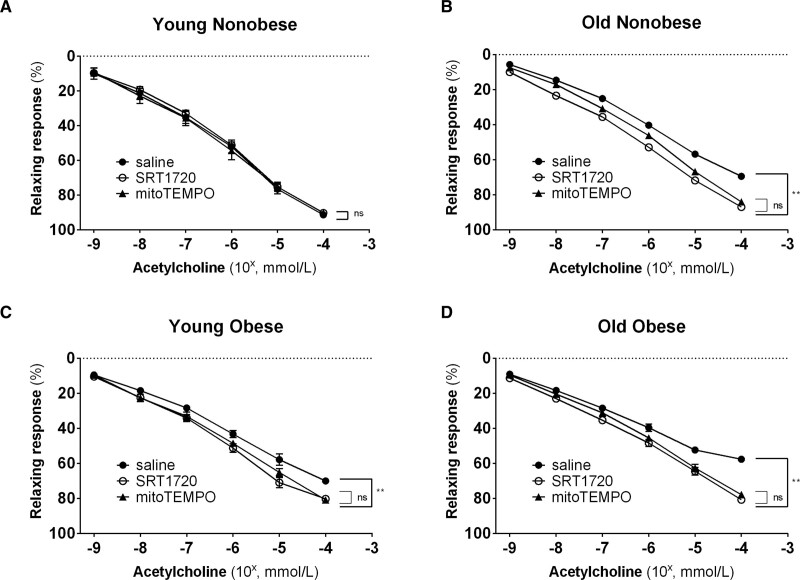
Methods: Ninety-five subjects undergoing elective laparoscopic surgery were recruited and stratified based on their body mass index status (above or below 30 kg/m2) and age (above or below 40 years) in 4 groups: Young Nonobese, Young Obese, Old Nonobese, and Old Obese. We measured small resistance arteries' endothelial function by pressurized micromyography before and after incubation with a SIRT1 agonist (SRT1720) and a mitochondria reactive oxygen species (mtROS) scavenger (MitoTEMPO). We assessed vascular levels of mtROS and nitric oxide availability by confocal microscopy and vascular gene expression of SIRT1 and mitochondrial proteins by qPCR. Chromatin immunoprecipitation assay was employed to investigate SIRT1-dependent epigenetic regulation of mitochondrial proteins.

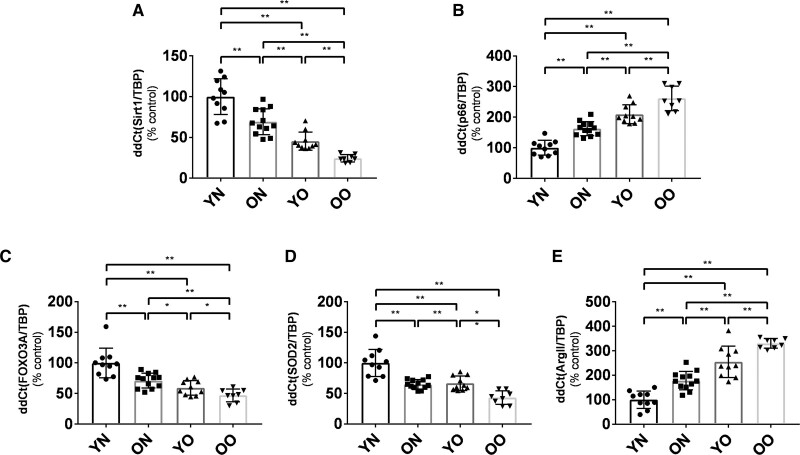
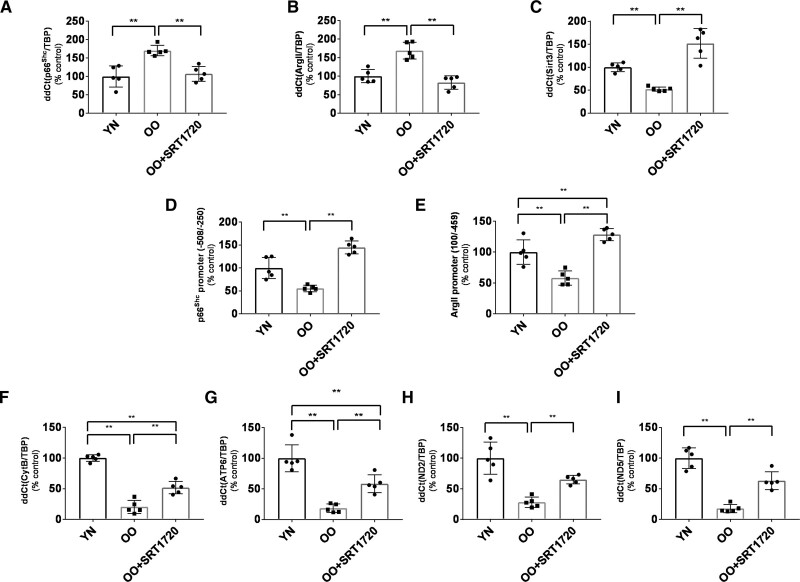
Results: Compared with Young Nonobese, obese and older patients showed lower vascular expression of SIRT1 and antioxidant proteins (FOXO3 [forkhead box protein O3] and SOD2) and higher expression of pro-oxidant and aging mitochondria proteins p66Shc and Arginase II. Old Obese, Young Obese and Old Nonobese groups endothelial dysfunction was rescued by SRT1720. The restoration was comparable to the one obtained with mitoTEMPO. These effects were explained by SIRT1-dependent chromatin changes leading to reduced p66Shc expression and upregulation of proteins involved in mitochondria respiratory chain.

Conclusions: SIRT1 is a novel central modulator of the earliest microvascular damage induced by age and obesity. Through a complex epigenetic control mainly involving p66Shc and Arginase II, it influences mtROS levels, NO availability, and the expression of proteins of the mitochondria respiratory chain. Therapeutic modulation of SIRT1 restores obesity- and age-related endothelial dysfunction. Early targeting of SIRT1 might represent a crucial strategy to prevent age- and obesity-related microvascular dysfunction.

Keywords: aging; endothelial cells; microcirculation; mitochondria; obesity; sirtuins.


Figures

Figure 1.
Figure 1.
Microvascular characterization of the study population. A, Media-to-Lumen (M/L) ratio per year of age in nonobese (white circle; n=42) and obese (black triangle; n=47) subjects. Regression lines for each group are shown. M/L ratio is expressed as percentage (%). Age and M/L are tightly related in both groups (obese: r=0.487, P<0.01; nonobese: r=0.555, P=0.001). The slope was 5-fold steeper in the obese group. In detail, the regression coefficients (x=0.05 in obese, x=0.01 in nonobese) depict how M/L increase of 0.5%/10 years in obese vs 0.1%/10 years in nonobese. Shapiro-Wilk test was adopted to assess normality. Linear regression analysis was conducted by adopting the M/L ratio as dependent variable, age as a covariate and BMI group (nonobese vs obese) as a factor. Interaction between terms was tested (P<0.01). B, Vasorelaxation to cumulative concentration of ACh in vessels precontracted with norepinephrine in the 4 groups (Young Nonobese: n=12; Old Nonobese: n=31; Young Obese: n=15; Old Obese: n=32). Vasodilatory response is expressed as % of the maximal diameter (Young Nonobese: black circle, Old Nonobese: white circle, Young Obese: black triangle, Old Obese: white triangle). C, Inhibition of ACh dilation by L-NAME expressed as the difference between the maximal vasodilatory response to ACh alone vs co-incubated with L-NAME. D, Vasorelaxation to cumulative concentration of SNP in vessels precontracted with norepinephrine in the 4 groups (young nonobese: n=12; old nonobese: n=31; young obese: n=15; old obese: n=32). Vasodilatory response is expressed as % of the maximal diameter (young nonobese: black circle, old nonobese: white circle, young obese: black triangle, old obese: white triangle). E and F, Differences in mtROS (E) and NO levels (F) assessed by mitoSOX and DAF-FM fluorescence in the 4 groups (n=5 for each group). Fluorescence is calculated as mean fluorescence intensity (MFI) and expressed as % of the Young Nonobese group. Original magnification is 40×. Shapiro-Wilk test was adopted to assess normality. Data are presented as mean±SEM and were compared by compared by 2-way ANOVA using age and BMI categories as fixed factors followed by Holm-Sidak post hoc correction (B–D) and Scheirer-Hare-Ray test using age and BMI categories as fixed factors followed by Dunn post hoc correction (E and F). A P<0.05 was considered significant. *P<0.05. **P<0.01. Ach indicates acetylcholine; M/L, media-to-lumen ratio; MFI, mean fluorescence intensity; ON, old nonobese; OO, old obese; SNP, sodium nitroprusside; YN, young nonobese; and YO, young obese.
Figure 2.
Figure 2.
Expression of SIRT1 (silent information regulator 1) and SIRT1-related genes in the vascular wall of the 4 groups. A, Expression of SIRT1. B, Expression of the pro-oxidant enzyme p66Shc. C, Expression of the antioxidant FOXO3 (Forkhead box protein O3). D, Expression of the SOD2 (superoxide dismutase-2). E, Expression of Arginase II. Results are expressed as % with respect to the Young Nonobese group. Shapiro-Wilk test was adopted to assess normality. FOXO3 and SOD2 were natural log-transformed for the means of the analyses. Young Nonobese: n=10, Old Nonobese: n=12, Young Obese: n=10, Old Obese: n=8. Data are presented as mean±SD and were compared by 2-way ANOVA followed by Holm-Sidak post hoc correction. A P<0.05 was considered significant. *P<0.05.**P<0.01. ArgII indicates Arginase II; FOXO3, Forkhead box protein O3; ON, old nonobese; OO, old obese; SOD-2, superoxide dismutase-2; YN, young nonobese; and YO, young obese.
Figure 3.
Figure 3.
SRT1720 rescues relaxing response to Ach and L-NAME inhibition in the 4 groups. A–D, Relaxing response to cumulative concentration to Ach in vessels precontracted with norepinephrine in the 4 groups (young nonobese: n=10; old nonobese: n=27; young obese: n=8; old obese: n=20). Vasodilatory response is expressed as % of the maximal diameter. The experiment was repeated 4 times for each patient by incubating the vessel with saline (black circle), L-NAME (white circle), SRT1720 (black triangle), SRT1720+L-NAME (white triangle). E and F, AUC (E) and maximal (F) vasodilatory response to Ach expressed as % of the maximal diameter in the 4 groups (young nonobese: n=10; old nonobese: n=27; young obese: n=8; old obese: n=20) in vessel precontracted with norepinephrine in the 4 groups. Vessels were incubated with saline (blue bars), SRT1720 (green bars), L-NAME (red bars) and SRT1720+L-NAME (orange bars). Baseline AUC and maximal vasodilatory response (blue bars) differ between the 4 groups (P<0.01), as expected. G, Maximal improvement in vasodilatory response to ACh (ΔACh, blue bars) or inhibitory response to L-NAME (ΔL-NAME, red bars) after SRT1720 incubation in the 4 groups (young nonobese: n=10; old nonobese: n=27; young obese: n=8; old obese: n=20). Shapiro-Wilk test was adopted to assess normality. Data are presented as mean±SEM and were compared by ANOVA for repeated measures followed by a post hoc test with Holm-Sidak post hoc correction. Baseline AUC and maximal vasodilatory response and maximal improvement in vasodilatory response to ACh (ΔACh) or inhibitory response to L-NAME in the 4 groups were compared by 2-way ANOVA followed by Holm-Sidak post hoc correction. A P<0.05 was considered significant. *P<0.05.**P<0.01. In the last panel (G): **P=0.01 or less for ΔACh response, °°P=0.01 or less for ΔL-NAME response. Ach indicates acetylcholine; ON, old nonobese; OO, old obese; YN, young nonobese; and YO, young obese.
Figure 4.
Figure 4.
Relationship between the improvement observed with SRT1720 in ACh and L-NAME response and age, body mass index (BMI), and vascular remodeling. SRT1720 induced improvement in vasodilatory response to ACh (A–C) and inhibitory response to L-NAME (D–F) shows a direct relationship with age, BMI and M/L in the 4 groups (young nonobese: black circle, old nonobese: white circle, young obese: black triangle, old obese: white triangle; young nonobese: n=10; old nonobese: n=27; young obese: n=8; old obese: n=20). The improved response is expressed as the improvement in maximal vasodilatory response to ACh (ΔACh) or inhibitory response to L-NAME (ΔL-NAME) after SRT1720 incubation. Shapiro-Wilk test was adopted to assess normality. Linear regression was used to model the relationship between the factors. Age, BMI and M/L were used as continuous variables in the model. Data are shown unadjusted. A P<0.05 was considered significant. Ach indicates acetylcholine; and M/L, media-to-lumen ratio.
Figure 5.
Figure 5.
Exploration of the effect and mechanism of the SRT1720-induced rescuing of age- and obesity-related endothelial dysfunction. A, Vasorelaxation to cumulative concentration of ACh in vessels precontracted with norepinephrine. Vasodilatory response is expressed as % of the maximal diameter. The experiment was conducted on vessels from Young Nonobese (n=5) at baseline (saline group), after overnight resting in transfection culture medium with scrambled siRNA (scr.siRNA group), and after overnight transfection with SIRT1 siRNA sc-40986 (siRNA group). The curves were repeated 2 times for each vessel, the first with ACh alone and the second after co-incubation with L-NAME (white triangle). Data are presented as mean±SEM and were compared by the Kruskal-Wallis test with Dwass-Steel-Critchlow-Flinger post hoc test. Within the same group, data were compared by the Friedman test. B and C, Differences in mtROS (red staining) and NO (green staining) levels assessed by mitoSOX and DAF-FM fluorescence between Young Nonobese vessels (n=5) at baseline (Young Nonobese), Young Nonobese vessels (n=5) after overnight resting in transfection culture medium with scrambled siRNA (Young Nonobese_scr.siRNA), Young Nonobese vessels (n=5) after overnight transfection with SIRT1 siRNA sc-40986 (Young Nonobese_siRNA) and between Young Nonobese vessels (n=5) at baseline (Young Nonobese), Old Obese vessels (n=5) before overnight incubation with SRT1720 (Old Obese_baseline), Old Obese vessels (n=5) after overnight incubation with SRT1720 (Old Obese_SRT1720). Data are presented as mean±SEM and were compared by the Kruskal-Wallis test with Dwass-Steel-Critchlow-Flinger post hoc test. Fluorescence is calculated as mean fluorescence intensity (MFI) and expressed as % of the Young Nonobese group. Original magnification is 40×. D, Relaxing response to cumulative concentration to Ach in vessels from Old Obese group (n=6) precontracted with norepinephrine. Vasodilatory response is expressed as % of the maximal diameter. The experiment was repeated 7 times for each patient, respectively by incubating the vessel with saline alone (black line), SRT1720 (green line), mitoTEMPO (orange line), gp91dstat (blue line), SRT1720+mitoTEMPO (red line), SRT1720+gp91dstat (brown line), mitoTEMPO+gp91dstat (pink line). Shapiro-Wilk test was adopted to assess normality. Data are presented as mean±SEM and were compared by ANOVA for repeated measures followed by a post hoc test with Holm-Sidak post hoc correction. E, Maximal vasodilatory response to Ach expressed as % of the maximal diameter in vessels from the Old Obese group (n=6) precontracted with norepinephrine. The experiment was repeated 7 times for each patient, respectively by incubating the vessel with saline alone (black bar), SRT1720 (green bar), mitoTEMPO (orange bar), gp91dstat (blue bar), SRT1720+mitoTEMPO (red bar), SRT1720+gp91dstat (brown bar), mitoTEMPO+gp91dstat (pink bar). Data are presented as mean±SEM and were compared by ANOVA for repeated measures followed by a post hoc test with Holm-Sidak post hoc correction. F–I, Mitochondria swelling assay of small resistance arteries of Young Nonobese (n=5) and Old Obese group (n=5). Mitochondria were tested before (blue dots) and after (red dots) the calcium load at baseline for Young Nonobese (G) and Old Obese groups (H) and, for the Old Obese group, after 24-hour incubation with SRT1720 (I). After the incubation with SRT1720, the reduction of absorbance was attenuated both at 10 and 20 minutes (F) and expressed as % of the Young Nonobese group, used as a control. Data are presented as mean±SEM and were compared by the Kruskal-Wallis test with Dwass-Steel-Critchlow-Flinger post hoc test. *P<0.05.**P<0.01. OO indicates old obese; and YN, young nonobese.
Figure 6.
Figure 6.
Genic profile of several proteins in the vessel wall of Old Obese subjects (n=5) before and after incubation with SRT1720. A, Expression of p66Shc. B, Expression of Arginase II. C, Expression of Sirt3. Notably, the ChIP assay did not detect the binding of SIRT1 (silent information regulator 1) on the Sirt3 promoter. D, qPCR after ChIP assay showing binding of SIRT1 on the promoter region of p66Shc before and after incubation with SRT1720. E, qPCR after ChIP assay showing binding of SIRT1 on the promoter region of Arginase II before and after incubation with SRT1720. F–I Expression of mitochondria respiratory chain enzymes: ATP synthase 6 (F), Cytochrome b (G), NADH dehydrogenase 2 (H) and NADH dehydrogenase 5 (I). Data are presented as mean±SD and were compared by the Kruskal-Wallis test with Dwass-Steel-Critchlow-Flinger post hoc test. A P<0.05 was considered significant. **P<0.01. ArgII indicates arginase II; ATP6, ATP synthase 6; Cytb, Cytochrome b; ND2, NADH dehydrogenase 2; OO, old obese; and YN, young nonobese.
Figure 7.
Figure 7.
Comparison of SRT1720 and mitoTEMPO rescuing microcirculatory dysfunction in the 4 groups. A–D, Relaxing response to cumulative concentration to Ach in vessels precontracted with norepinephrine in the 4 groups (young nonobese: n=5; old nonobese: n=16; young obese: n=8; old obese: n=22). Vasodilatory response is expressed as % of the maximal diameter. The experiment was repeated 3 times for each patient by incubating the vessel with saline (black circle), SRT1720 (white circle), and mitoTEMPO (black triangle). Shapiro-Wilk test was adopted to assess normality. Data are presented as mean±SEM and were compared by the Friedman test followed by Durbin-Conover as a post hoc test (A) and ANOVA for repeated measures followed by a post hoc test with Holm-Sidak correction (B–D). A P<0.05 was considered significant. **P<0.01.

References

    1. Costantino S, Paneni F, Cosentino F. Ageing, metabolism and cardiovascular disease. J Physiol. 2016;594:2061–2073. doi: 10.1113/JP270538 - PMC - PubMed
    1. Franceschi C, Garagnani P, Parini P, Giuliani C, Santoro A. Inflammaging: a new immune-metabolic viewpoint for age-related diseases. Nat Rev Endocrinol. 2018;14:576–590. doi: 10.1038/s41574-018-0059-4 - PubMed
    1. Ward ZJ, Bleich SN, Cradock AL, Barrett JL, Giles CM, Flax C, Long MW, Gortmaker SL. Projected U.S. State-level prevalence of adult obesity and severe obesity. N Engl J Med. 2019;381:2440–2450. doi: 10.1056/NEJMsa1909301 - PubMed
    1. Eckel N, Li Y, Kuxhaus O, Stefan N, Hu FB, Schulze MB. Transition from metabolic healthy to unhealthy phenotypes and association with cardiovascular disease risk across BMI categories in 90 257 women (the Nurses’ Health Study): 30 year follow-up from a prospective cohort study. Lancet Diabetes Endocrinol. 2018;6:714–724. doi: 10.1016/S2213-8587(18)30137-2 - PubMed
    1. Reddy MA, Zhang E, Natarajan R. Epigenetic mechanisms in diabetic complications and metabolic memory. Diabetologia. 2015;58:443–455. doi: 10.1007/s00125-014-3462-y - PMC - PubMed

Publication types