

Endosome maturation links PI3Kα signaling to lysosome repopulation during basal autophagy
- PMID: 35968799
- PMCID: PMC9531306
- DOI: 10.15252/embj.2021110398
Endosome maturation links PI3Kα signaling to lysosome repopulation during basal autophagy
Abstract
Autophagy depends on the repopulation of lysosomes to degrade intracellular components and recycle nutrients. How cells co-ordinate lysosome repopulation during basal autophagy, which occurs constitutively under nutrient-rich conditions, is unknown. Here, we identify an endosome-dependent phosphoinositide pathway that links PI3Kα signaling to lysosome repopulation during basal autophagy. We show that PI3Kα-derived PI(3)P generated by INPP4B on late endosomes was required for basal but not starvation-induced autophagic degradation. PI(3)P signals were maintained as late endosomes matured into endolysosomes, and served as the substrate for the 5-kinase, PIKfyve, to generate PI(3,5)P2 . The SNX-BAR protein, SNX2, was recruited to endolysosomes by PI(3,5)P2 and promoted lysosome reformation. Inhibition of INPP4B/PIKfyve-dependent lysosome reformation reduced autophagic clearance of protein aggregates during proteotoxic stress leading to increased cytotoxicity. Therefore under nutrient-rich conditions, PI3Kα, INPP4B, and PIKfyve sequentially contribute to basal autophagic degradation and protection from proteotoxic stress via PI(3,5)P2 -dependent lysosome reformation from endolysosomes. These findings reveal that endosome maturation couples PI3Kα signaling to lysosome reformation during basal autophagy.
Keywords: INPP4B; PI3Kα; PIKfyve; autophagy; lysosome.
© 2022 The Authors. Published under the terms of the CC BY 4.0 license.
Figures

- A
PI(3)P is synthesized directly by the class III PI3K Vps34, or via the sequential actions of PI3Kα, inositol polyphosphate 5‐phosphatses, and INPP4B in response to growth factor stimulation.
- B, C
MCF‐7 cells expressing GFP‐INPP4B or GFP‐vector were cultured in growth media or EBSS for the indicated times, then lysed and immunoblotted with LC3B antibodies and GAPDH antibodies as a loading control (B). Data represent the relative LC3B‐II levels normalized to GAPDH, and expressed relative to growth media‐treated GFP‐vector cells which were assigned an arbitrary value of 1 (n = 3 experiments) (C).
- D, E
MCF‐7 cells expressing nontargeted (NT), INPP4B #1, or INPP4B #2 shRNA were cultured in growth media or EBSS for the indicated times, then lysed and immunoblotted with LC3B antibodies and GAPDH antibodies as a loading control (D). Data represent the relative LC3B‐II levels normalized to GAPDH, and expressed relative to growth media‐treated NT shRNA cells which were assigned an arbitrary value of 1 (n = 3 experiments) (E).
- F, G
MCF‐7 cells expressing GFP‐INPP4B or GFP‐vector were cultured in growth media or EBSS for 4 h, then fixed and immunostained with p62 antibodies, and co‐stained with DAPI and phalloidin (F). Data represent the number of p62+ puncta relative to cell area (μm2) (n = 3 experiments, > 50 cells/experiment) (G).
- H, I
MCF‐7 cells expressing GFP‐INPP4B or GFP‐vector were treated with 100 nM bafilomycin A1 or DMSO as a vehicle control for 4 h, then lysed and immunoblotted with LC3B antibodies and GAPDH antibodies as a loading control (H). Data represent the relative LC3B‐II levels normalized to GAPDH, and expressed relative to DMSO‐treated GFP‐vector cells which were assigned an arbitrary value of 1 (I) (n = 3 experiments).
- J, K
MCF‐7 cells expressing GFP‐INPP4B or GFP‐vector were treated with 100 nM of bafilomycin A1 or DMSO as a vehicle control for 4 h, then fixed and immunostained with p62 antibodies, and co‐stained with DAPI and phalloidin (J). Data represent the number of p62+ puncta relative to cell area (μm2) (n = 3 experiments, > 50 cells/experiment) (K).
- L, M
MCF‐7 cells expressing GFP‐INPP4B or GFP‐vector were treated with 2 μM BYL719 (PI3Kα inhibitor) or DMSO as a vehicle control for the indicated times. Cells were lysed and immunoblotted with LC3B, pAKTS473, AKT(pan), pS6KT389, or S6K antibodies and GAPDH antibodies as a loading control (L). Data represent the relative LC3B‐II levels normalized to GAPDH, and expressed relative to DMSO‐treated GFP‐vector cells which were assigned an arbitrary value of 1 (n = 3 experiments) (M).
- N, O
MCF‐7 cells expressing GFP‐INPP4B or GFP‐vector were treated with 1 or 10 μM of SAR405 (Vps34 inhibitor) or DMSO as a vehicle control for 4 h. Cells were lysed and immunoblotted with LC3B antibodies and GAPDH antibodies as a loading control (N). Data represent the relative LC3B‐II levels normalized to GAPDH, and expressed relative to DMSO‐treated GFP‐vector cells which were assigned an arbitrary value of 1 (n = 3 experiments) (O).

- A, B
MCF‐7 cells expressing nontargeted (NT), INPP4B #1, or INPP4B #2 shRNA were fixed and immunostained with recombinant GST‐2xFYVEHrs (2xFYVE) (PI(3)P probe) and LAMP2 antibodies, and co‐stained with DAPI (A). Data represent the proportion of PI(3)P+ lysosomes (n = 3 experiments, > 40 cells/experiment) (B). Arrows indicate co‐localization between 2xFYVE and LAMP2.
- C
MCF‐7 cells were treated with 0.02% (w/v) saponin for 30 s, then fixed and immunostained with INPP4B and either LAMP1 or CD63 antibodies, and co‐stained with DAPI. Arrows indicate co‐localization between INPP4B and CD63.
- D, E
MCF‐7 cells co‐expressing GFP‐INPP4B or GFP‐vector, and Hrs or NT shRNA, were fixed and immunostained with recombinant 2xFYVE (PI(3)P probe) and LAMP2 antibodies, and co‐stained with DAPI (D). Data represent the proportion of PI(3)P+ lysosomes (n = 3 experiments, > 30 cells/experiment) (E). Arrows indicate co‐localization between 2xFYVE and LAMP2.
- F, G
MCF‐7 cells co‐expressing GFP‐INPP4B or GFP‐vector, and Hrs or NT shRNA, were fixed and immunostained with recombinant 2xFYVE (PI(3)P probe) and CD63 antibodies, and co‐stained with DAPI (F). Data represent the proportion of PI(3)P+ late endosomes (n = 3 experiments, > 30 cells/experiment) (G). Arrows indicate co‐localization between 2xFYVE and LAMP2.
- H, I
MCF‐7 cells co‐expressing GFP‐INPP4B or GFP‐vector, and Hrs or NT shRNA, were lysed and immunoblotted with LC3B antibodies, and GAPDH antibodies as a loading control (H). Data represent the relative LC3B‐II levels normalized to GAPDH, and expressed relative to GFP‐vector; NT shRNA cells which were assigned an arbitrary value of 1 (n = 3 experiments) (I).
- J
INPP4B generates PI(3)P on late endosomes, which is retained on endolysosomes following late endosome maturation.

- A
MCF‐7 cells were fixed and immunostained with INPP4B and either LAMP1 or CD63 antibodies, and co‐stained with DAPI.
- B, C
MCF‐7 cells expressing GFP‐INPP4B or GFP‐vector were transduced with lentiviral particles encoding nontargeted (NT) or Hrs shRNA. Cells were lysed and immunoblotted with Hrs antibodies, and GAPDH antibodies as a loading control (B). Data represent the relative Hrs levels normalized to GAPDH expression, and expressed relative to GFP‐vector;NT shRNA cells which were assigned an arbitrary value of 1 (n = 3 experiments) (C).
- D, E
MCF‐7 cells expressing GFP‐INPP4B or GFP‐vector were fixed and stained with CD63 and p62 antibodies, and co‐stained with DAPI (D). Data represent the number of late endosomes (CD63+/p62− puncta) and amphisomes (CD63+/p62+ puncta) per cell (n = 3 experiments, > 50 cells/experiment) (E). Arrows indicate amphisomes.

- A, B
MCF‐7 cells expressing GFP‐INPP4B or GFP‐vector were fixed and immunostained with LAMP1 or LAMP2 antibodies, and co‐stained with DAPI and phalloidin (A). Data represent the number of LAMP1+ or LAMP2+ puncta relative to cell area (μm2) (n = 3 experiments, > 50 cells/experiment) (B).
- C, D
Snapshots of Magic Red™ (MR) cathepsin B substrate and Hoechst 33342 captured in live MCF‐7 cells expressing GFP‐INPP4B or GFP‐vector (C). Data represent the number of MR cathepsin B+ puncta per cell (n = 3 experiments, > 50 cells/experiment) (D).
- E, F
MCF‐7 cells expressing nontargeted (NT) or INPP4B #1 shRNA were cultured in growth media or EBSS for the indicated times, then fixed and immunostained with LAMP1 antibodies and co‐stained with DAPI and phalloidin (E). Data represent the number of LAMP1+ puncta relative to cell area (μm2) (n = 3 experiments, > 30 cells per experiment) (F).
- G, H
MCF‐7 cells expressing GFP‐INPP4B or GFP‐vector were transfected with NT, PIK3CA #1, or PIK3CA #2 siRNA. After 24 h, cells were fixed and immunostained with LAMP1 antibodies, and co‐stained with DAPI and phalloidin (G). Data represent the number of LAMP1+ puncta relative to cell area (μm2) (n = 3 experiments, > 40 cells per experiment) (H).

- A, B
MCF‐7 cells expressing nontargeted (NT), INPP4B #1, or INPP4B #2 shRNA were fixed and immunostained with LAMP1 antibodies, and co‐stained with DAPI and phalloidin (A). Data represent the number of LAMP1+ puncta relative to cell area (μm2) (n = 3 experiments, > 50 cells/experiment) (B).
- C, D
HeLa cells were transfected with NT or INPP4B siRNA. After 24 h, cells were fixed and immunostained with LAMP2 antibodies, and co‐stained with DAPI and phalloidin (C). Data represent the number of LAMP2+ puncta relative to cell area (μm2) (n = 3 experiments, > 50 cells/experiment) (D).
- E, F
MCF‐7 cells were transfected with HA‐vector, HA‐INPP4B,WT or HA‐INPP4BC842A. Forty‐eight hours later, cells were fixed and immunostained with LAMP2 antibodies, and co‐stained with DAPI and phalloidin (E). Data represent the number of LAMP2+ puncta relative to cell area (μm2) (n = 3 experiments, > 20 cells/experiment) (F).
- G, H
MCF‐7 cells co‐expressing GFP‐INPP4B or GFP‐vector, and Hrs or NT shRNA, were fixed and immunostained with LAMP1 antibodies, and co‐stained with DAPI and phalloidin (G). Data represent the number of LAMP1+ puncta relative to cell area (μm2) (n = 3 experiments, > 40 cells per experiment) (H).
- I–K
MCF‐7 cells expressing GFP‐INPP4B or GFP‐vector were fixed and immunostained with LAMP1 antibodies, and imaged using super resolution microscopy (I). Data represent the LAMP1+ puncta size (J) and LAMP1+ puncta size distribution (K) (n = 3 experiments, > 20 cells/experiment).
- L, M
Data represent the distance of LAMP1+ puncta from the center of the nucleus (L), and the proportion of perinuclear LAMP1+ puncta (< 15 μm from center of nucleus) and peripheral LAMP1+ puncta (> 15 μm from center of nucleus) (M) (n = 3 experiments, > 20 cells/experiment).
- N
MCF‐7 cells expressing GFP‐INPP4B or GFP‐vector were transfected with NT, PIK3CA #1, or PIK3CA #2 siRNA. After 24 h, cells were lysed and immunoblotted with PI3K p110α antibodies, and GAPDH antibodies as a loading control.
- O, P
MCF‐7 cells expressing GFP‐INPP4B or GFP‐vector were treated with 2 μM BYL719 (PI3Kα inhibitor) or DMSO as a vehicle control for 24 h, then fixed and immunostained with LAMP1 antibodies, and co‐stained with DAPI and phalloidin (O). Data represent the number of LAMP1+ puncta relative to cell area (μm2) (n = 3 experiments, > 50 cells per experiment) (P).

- A–C
MCF‐7 cells expressing GFP‐INPP4B or GFP‐vector were cultured in growth media, EBSS (4 h), or EBSS (4 h) followed by 10% FCS (30 min). Cells were lysed and immunblotted with pAKTS473, AKT(pan), pS6KT389, and S6K antibodies, and GAPDH antibodies as a loading control (A). Data represent the relative pAKTS473 levels normalized to AKT(pan) (B) or pS6KT389 levels normalized to S6K (C), and expressed relative to growth media‐treated GFP‐vector cells which were assigned an arbitrary value of 1 (n = 3 experiments).
- D, E
MCF‐7 cells expressing GFP‐INPP4B or GFP‐vector were cultured in growth media, EBSS (4 h) or EBSS (4 h) followed by 10% FCS (30 min). Cells were fixed and immunostained with pmTORS2448 and LAMP1 antibodies, and co‐stained with DAPI (D). Data represent mean pmTORS2448 fluorescence intensity overlapping with LAMP1+ puncta expressed relative to growth media‐treated GFP‐vector cells which were assigned an arbitrary value of 1 (n = 3 experiments) (E).
- F
MCF‐7 cells expressing GFP‐INPP4B or GFP‐vector were cultured in growth media or EBSS for 4 h. RNA was extracted and two‐step quantitative RT‐PCR was performed using primers for LAMP1, ATP6V1C1, ATP6V0D1, CTNS, TPP1, or M6PR, and expression was normalized to ACTB. Expression was determined using the ΔΔCt method and expressed relative to growth media‐treated GFP‐vector cells, which were assigned an arbitrary value of 1 (n = 3 experiments).

- A, B
Snapshots of LAMP1‐GFP, Magic Red™ (MR) cathepsin B substrate, and Hoechst 33342 captured in live HeLa cells transfected with INPP4B or nontargeted siRNA (A). Data represent the number of LAMP1+/MR cathepsin B+ and LAMP1+/MR cathepsin B− lysosomes (terminal storage lysosomes) per cell (n = 3 experiments, > 50 cells/experiment) (B). Yellow arrows indicate LAMP1+/MR cathepsin B+ lysosomes, and white arrows indicate terminal storage lysosomes.
- C
Timelapse snapshots of LAMP1‐mCherry signals from MCF‐7 cells expressing GFP‐INPP4B or GFP‐vector captured by spinning disk microscopy. Maximum intensity projections of three z‐planes taken 0.27 μm apart are shown. Arrows indicate lysosome reformation.
- D
Overview of analysis workflow used to quantify lysosome reformation from spinning disk microscopy. Maximum intensity projections of lysosomes were converted to three‐dimensional kymographs using x, y, and time dimensions, then segmented and skeletonized to track tubulation and fission events (depicted in red) that branch off the parent lysosome (depicted in black).
- E
Data represent the number of LAMP1+ reformation events per cell per minute (n = 12 GFP‐vector cells, n = 15 GFP‐INPP4B cells).
- A, B
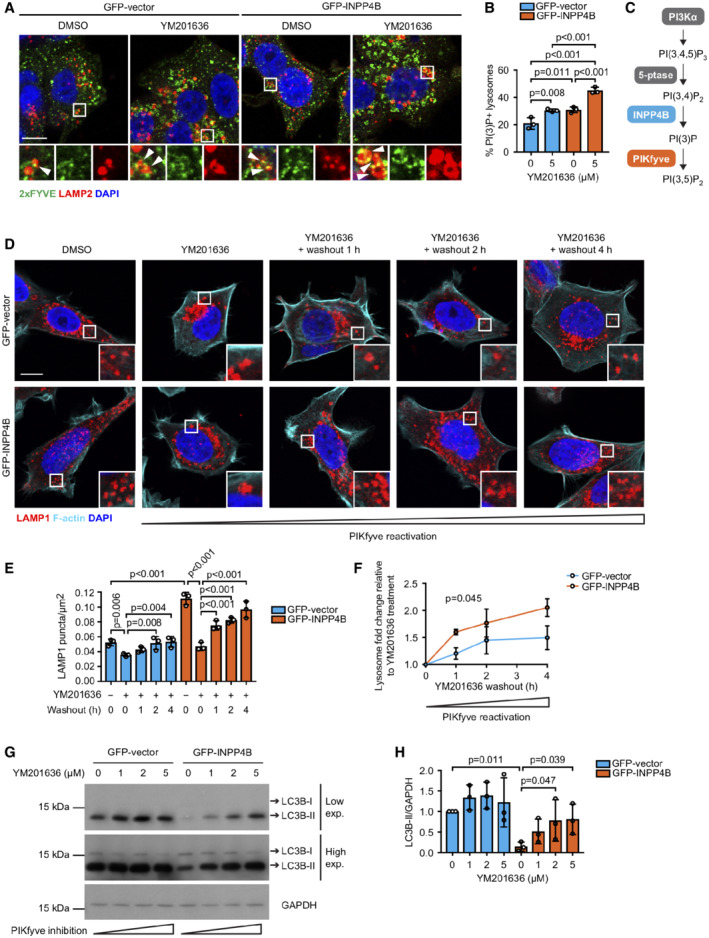
MCF‐7 cells expressing GFP‐INPP4B or GFP‐vector were treated with 5 μM YM201636 (PIKfyve inhibitor) or DMSO as a vehicle control for 2 h. Cells were fixed and immunostained with recombinant GST‐2xFYVEHrs (2xFYVE) (PI(3)P probe) and LAMP2 antibodies, and co‐stained with DAPI (A). Data represent the proportion of PI(3)P+ lysosomes (n = 3 experiments, > 30 cells/experiment) (B). Arrows show co‐localization between 2xFYVE and LAMP2.
- C
INPP4B generates PI(3)P downstream of PI3Kα signaling, which is predicted to act as a substrate for phosphorylation to PI(3,5)P2 by PIKfyve.
- D–F
MCF‐7 cells expressing GFP‐INPP4B or GFP‐vector were treated with 5 μM YM201636 (PIKfyve inhibitor) or DMSO as a vehicle control for 2 h, then YM201636 was washed out for 1, 2, or 4 h. Cells were fixed and immunostained with LAMP1 antibodies, and co‐stained with DAPI and phalloidin (D). Data represent the number of LAMP1+ puncta relative to cell area (μm2) (E), and the lysosome fold change relative to the YM201636‐treated condition for each cell line (F) (n = 3 experiments, > 30 cells per experiment).
- G, H
MCF‐7 cells expressing GFP‐INPP4B or GFP‐vector were treated with 1, 2, or 5 μM YM201636 (PIKfyve inhibitor) or DMSO as a vehicle control for 4 h. Cells were lysed and immunoblotted with LC3B antibodies, and GAPDH antibodies as a loading control (G). Data represent the relative LC3B‐II levels normalized to GAPDH, and expressed relative to DMSO‐treated GFP‐vector cells which were assigned an arbitrary value of 1 (n = 3 experiments) (H).

- A, B
MCF‐7 cells expressing GFP‐INPP4B or GFP‐vector were transfected with nontargeted (NT), SNX1, or SNX2 siRNA. After 24 h, cells were fixed and immunostained with LAMP2 antibodies, and co‐stained with DAPI and phalloidin (A). Data represent the number of LAMP2+ puncta relative to cell area (μm2; n = 3 experiments, > 40 cells per experiment) (B).
- C
Timelapse snapshots of LAMP1‐mCherry and GFP‐SNX2 signals from MCF‐7 cells captured by spinning disk microscopy. Maximum intensity projections of two z‐planes taken 0.27 μm apart are shown.
- D, E
MCF‐7 cells expressing GFP‐INPP4B or GFP‐vector were treated with 5 μM YM201636 (PIKfyve inhibitor) for 2 h, then YM201636 was washed out for 1 h. Cells were fixed and immunostained with SNX2 and LAMP1 antibodies, and co‐stained with DAPI (D). Data represent the proportion of SNX2+ LAMP2 puncta (n = 3 experiments, > 40 cells/experiment) (E). Arrows show co‐localization between SNX2 and LAMP2.
- F
HeLa cells were transfected with GFP‐SNX2. After 24 h, cells were treated with 5 μM YM201636 (PIKfyve inhibitor) for 2 h, then YM201636 was washed out for 1 h. Cells were fixed and subjected to immuno‐electron microscopy analysis using GFP (10 nm) antibodies. Arrows show GFP‐SNX2 localization on a lysosome.
- G
HeLa cells were transfected with GFP‐PIKfyve. After 24 h, cells were treated with 5 μM YM201636 (PIKfyve inhibitor) for 2 h, then YM201636 was washed out for 1 h. Cells were fixed and immunostained with SNX2, GFP, and LAMP2 antibodies, and imaged using super resolution microscopy. Arrows show co‐localization between GFP‐PIKfyve, SNX2, and LAMP2.
- H
MCF‐7 cells expressing LAMP1‐mCherry were transfected with NT or SNX2 siRNA. After 24 h, cells were imaged by spinning disk microscopy for 20 min. Representative time‐lapse snapshots of LAMP1‐mCherry from a maximum projection of three z‐planes taken 0.27 μm apart are shown. Arrow indicates lysosome reformation.
- I
Data represent the number of LAMP1+ reformation events per cell per minute (n = 21 NT siRNA cells, n = 27 SNX2 siRNA cells).

- A
MCF‐7 cells expressing GFP‐INPP4B or GFP‐vector were transfected with nontargeted (NT), PIKFYVE #1, or PIKFYVE #2 siRNA. After 24 h, RNA was extracted and two‐step quantitative RT‐PCR was performed using primers for PIKFYVE, and expression was normalized to ACTB. Expression was determined using the ΔΔCt method and expressed relative to GFP‐vector;NT siRNA cells which were assigned an arbitrary value of 1 (n = 3 experiments).
- B, C
MCF‐7 cells expressing GFP‐INPP4B or GFP‐vector were transfected with NT, PIKFYVE #1, or PIKFYVE #2 siRNA. After 24 h, cells were fixed and immunostained with LAMP2 antibodies, and co‐stained with DAPI and phalloidin (B). Data represent the number of LAMP2+ puncta relative to cell area (μm2) (n = 3 experiments, > 40 cells per experiment) (C).
- D, E
MCF‐7 cells expressing GFP‐INPP4B or GFP‐vector were treated with 2 or 5 μM YM201636 (PIKfyve inhibitor) or DMSO as a vehicle control for 4 h. Cells were fixed and immunostained with LAMP1 antibodies, and co‐stained with DAPI and phalloidin (D). Data represent the number of LAMP1+ puncta relative to cell area (μm2) (n = 3 experiments, > 30 cells/experiment) (E).

- A, B
HeLa cells transfected with INPP4B or nontargeted (NT) siRNA were treated for 1 h with 5 μg/ml puromycin. Cells were fixed and immunostained with ubiquitin antibodies, and co‐stained with DAPI and phalloidin (A). Data represent the percentage of cells with ubiquitinated protein aggregates (n = 3 experiments, > 200 cells/experiment) (B).
- C, D
HeLa cells were treated with 5 μM YM201636 (PIKfyve inhibitor) or DMSO as a vehicle control for 2 h, then 5 μg/ml puromycin for 1 h. Cells were fixed and immunostained with ubiquitin antibodies, and co‐stained with DAPI and phalloidin (C). Data represent the percentage of cells with ubiquitinated protein aggregates (n = 3 experiments, > 200 cells/experiment) (D).
- E, F
MCF‐7 cells expressing GFP‐INPP4B or GFP‐vector were treated for 4 h with 10 μg/ml puromycin, 5 μm MG132, and either 5 μM YM201636 (PIKfyve inhibitor) or DMSO as a vehicle control. Cells were fixed and immunostained with ubiquitin antibodies, and co‐stained with DAPI and phalloidin (E). Data represent the percentage of cells with ubiquitinated protein aggregates (n = 3 experiments, > 200 cells/experiment) (F).
- G
HeLa cells transfected with INPP4B or NT siRNA were treated with 10 μg/ml puromycin for 2–6 h, then cell viability was assessed using CellTiter‐Glo® assays. Data represent the relative cell viability normalized to untreated cells (n = 3 experiments).
- H
HeLa cells were treated 10 μg/ml puromycin ±5 μM YM201636 (PIKfyve inhibitor) or DMSO as a vehicle control for 2–6 h, then cell viability was assessed using CellTiter‐Glo® assays. Data represent the relative cell viability normalized to untreated cells (n = 3 experiments).


- A, B
MCF‐7 cells expressing GFP‐INPP4B or GFP‐vector were treated for 4 h with 10 μg/ml puromycin ±5 μm MG132 or DMSO as a vehicle control. Cells were fixed and immunostained with ubiquitin antibodies, and co‐stained with DAPI and phalloidin (A). Data represent the percentage of cells with ubiquitinated protein aggregates (n = 3 experiments, > 200 cells/experiment) (B).
- C, D
MCF‐7 cells expressing GFP‐INPP4B or GFP‐vector were treated for 4 h with 10 μg/ml of puromycin, 5 μm of MG132, and either 100 nM of bafilomycin A1 or DMSO as a vehicle control. Cells were fixed and immunostained with ubiquitin antibodies, and co‐stained with DAPI and phalloidin (C). Data represent the percentage of cells with ubiquitinated protein aggregates (n = 3 experiments, > 200 cells/experiment) (D).
References
-
- Baranov MV, Bianchi F, Schirmacher A, van Aart MAC, Maassen S, Muntjewerff EM, Dingjan I, Ter Beest M, Verdoes M, Keyser SGL et al (2019) The phosphoinositide kinase PIKfyve promotes cathepsin‐S‐mediated major histocompatibility complex class II antigen presentation. iScience 11: 160–177 - PMC - PubMed
-
- Bissig C, Hurbain I, Raposo G, van Niel G (2017) PIKfyve activity regulates reformation of terminal storage lysosomes from endolysosomes. Traffic 18: 747–757 - PubMed
Publication types
MeSH terms
Substances
LinkOut - more resources
Full Text Sources
Other Literature Sources
Research Materials
Miscellaneous
