. 2022 Aug 15:11:e80643.
doi: 10.7554/eLife.80643.

PLK4 drives centriole amplification and apical surface area expansion in multiciliated cells

Affiliations

PLK4 drives centriole amplification and apical surface area expansion in multiciliated cells

Gina M LoMastro et al. Elife. .

Abstract

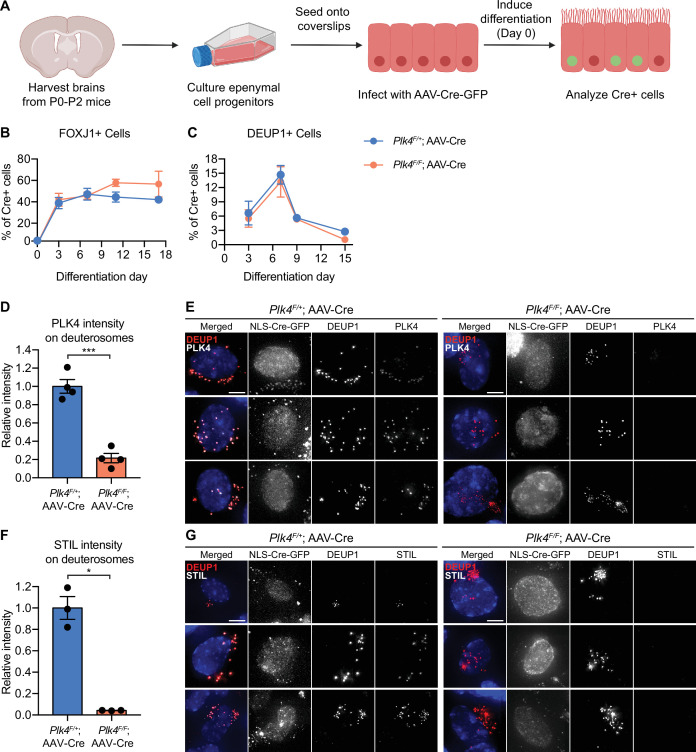
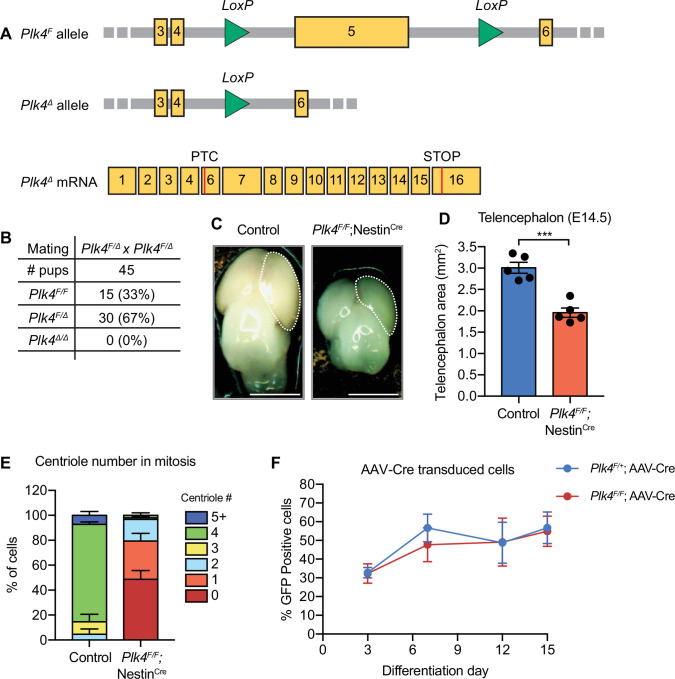
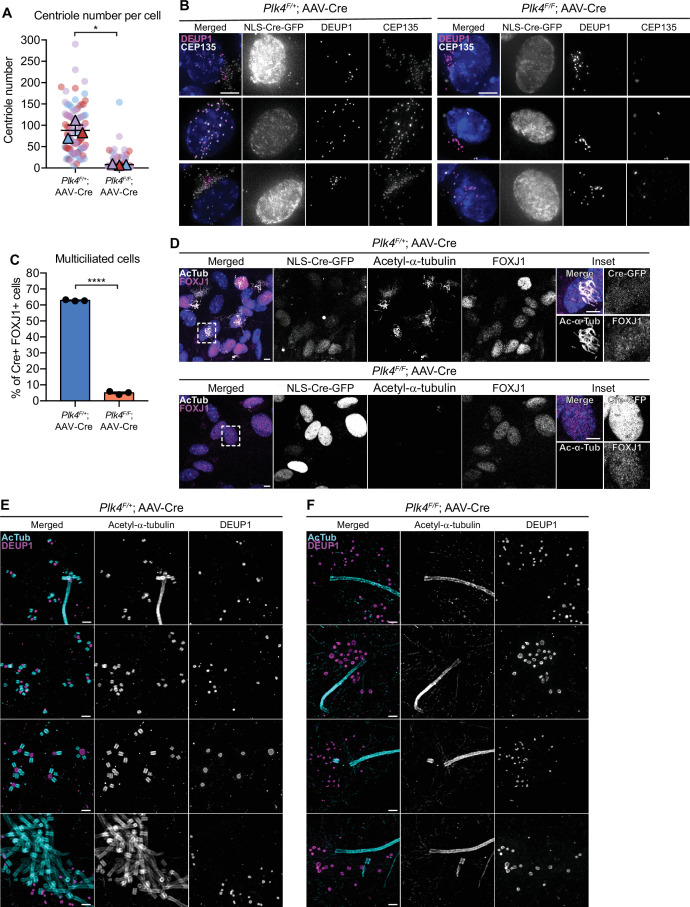
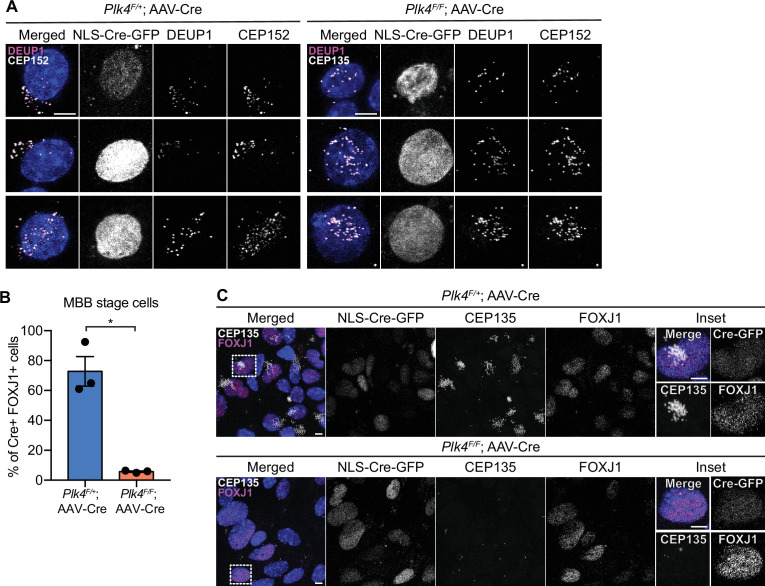
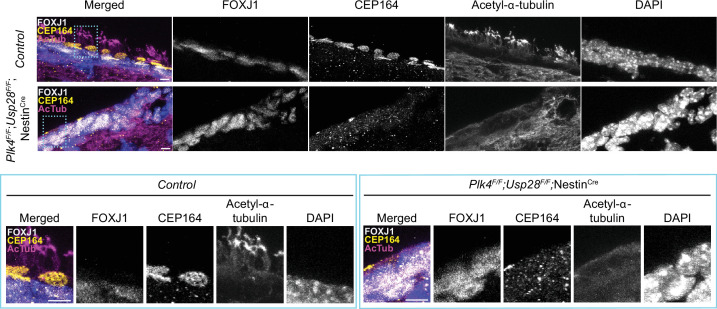
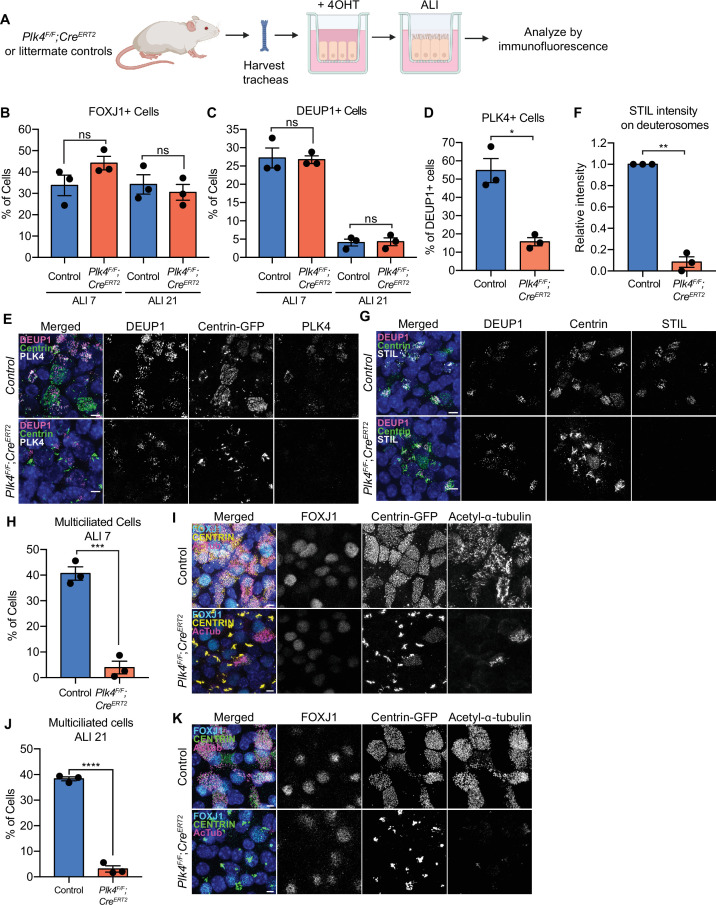
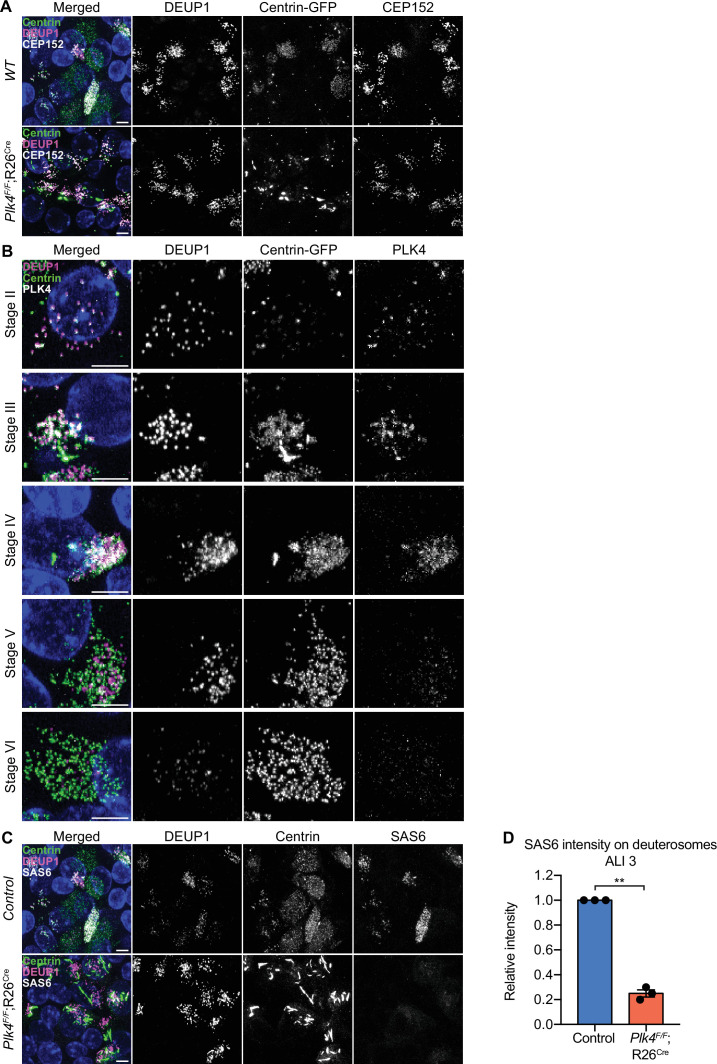
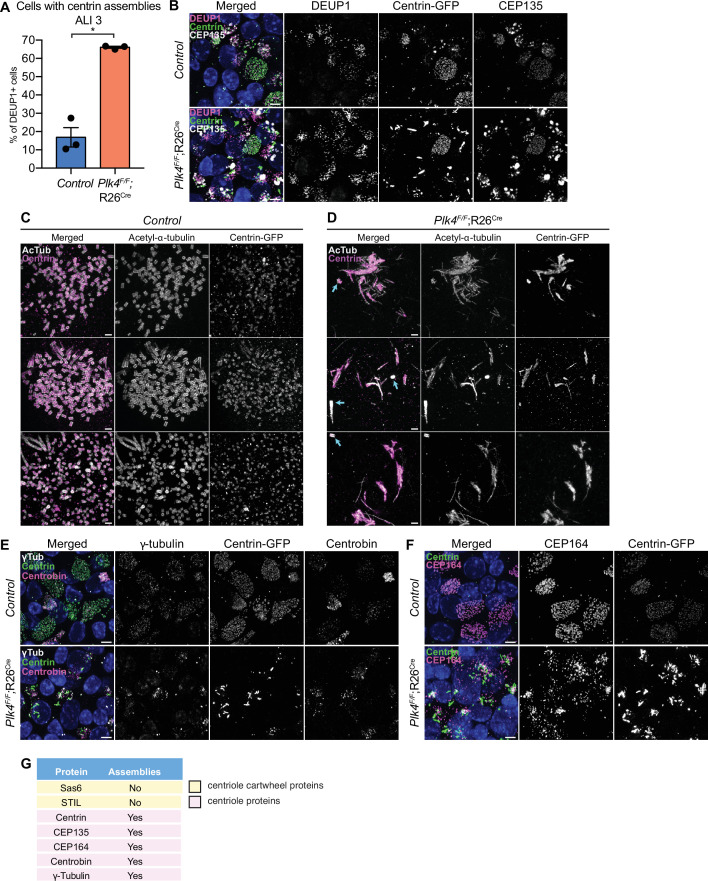
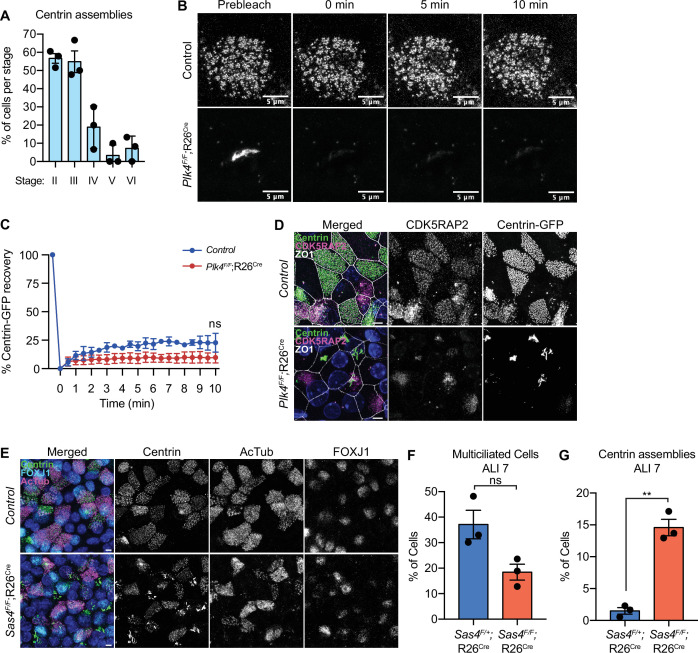
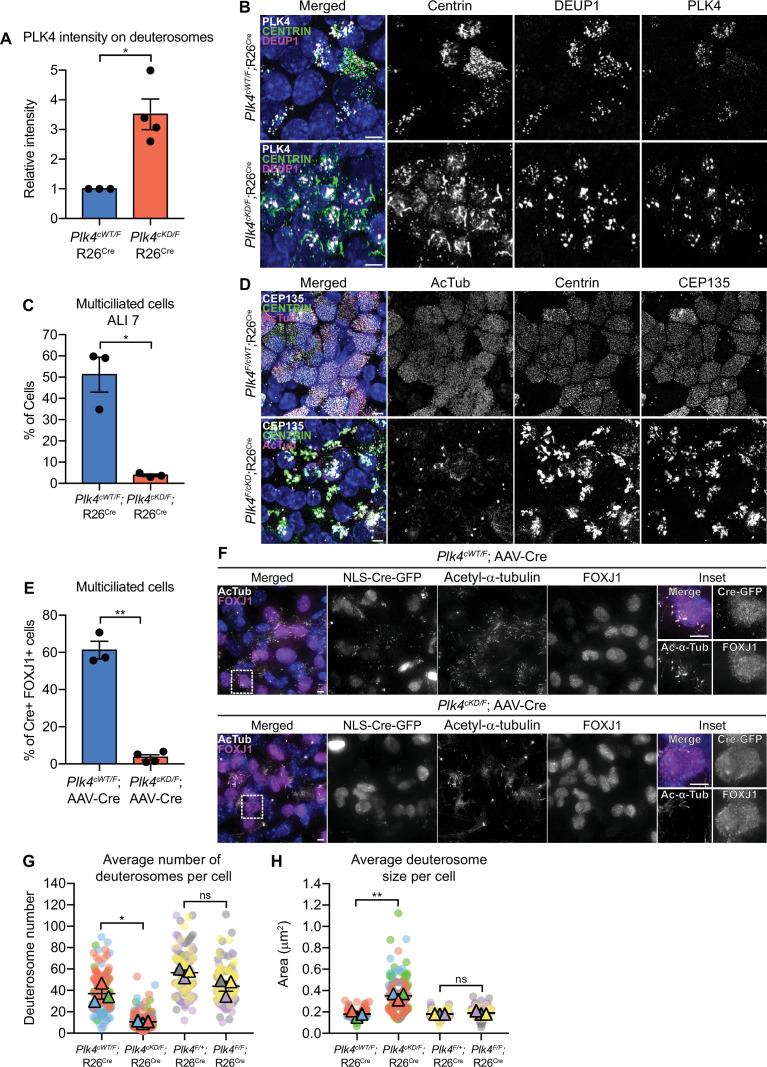
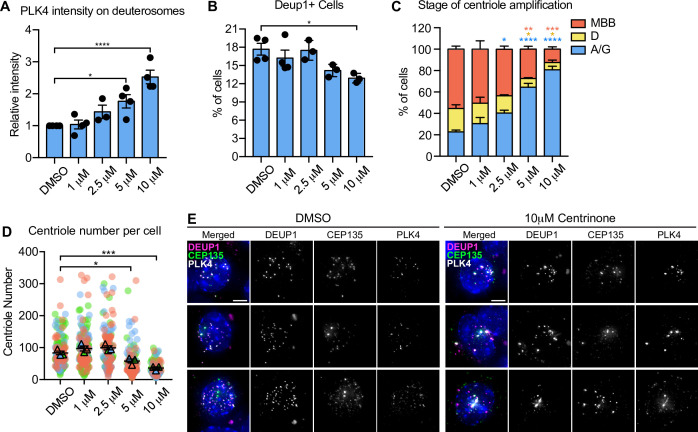
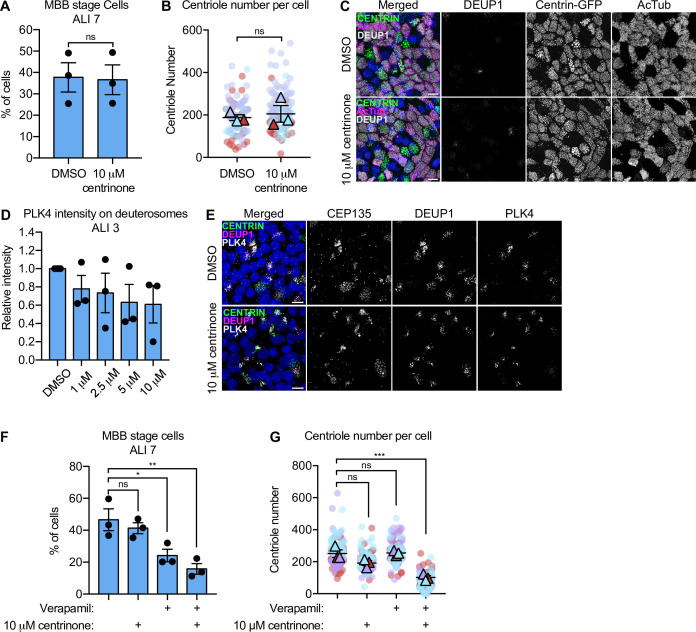
Multiciliated cells (MCCs) are terminally differentiated epithelia that assemble multiple motile cilia used to promote fluid flow. To template these cilia, MCCs dramatically expand their centriole content during a process known as centriole amplification. In cycling cells, the master regulator of centriole assembly Polo-like kinase 4 (PLK4) is essential for centriole duplication; however recent work has questioned the role of PLK4 in centriole assembly in MCCs. To address this discrepancy, we created genetically engineered mouse models and demonstrated that both PLK4 protein and kinase activity are critical for centriole amplification in MCCs. Tracheal epithelial cells that fail centriole amplification accumulate large assemblies of centriole proteins and do not undergo apical surface area expansion. These results show that the initial stages of centriole assembly are conserved between cycling cells and MCCs and suggest that centriole amplification and surface area expansion are coordinated events.

Keywords: Plk4; cell biology; centriole; cilia; deuterosome; mouse; multiciliated.

Plain language summary

Every day, we inhale thousands of viruses, bacteria and pollution particles. To protect against these threats, cells in our airways produce mucus that traps inhaled particles before they reach the lungs. This mucus then needs to be removed to prevent it from becoming a breeding ground for microbes that may cause a respiratory infection. This is the responsibility of cells covered in tiny hair-like structures called cilia that move together to propel the mucus-trapped particles out of the airways. These specialized cells can have up to 300 motile cilia on their surface, which grow from structures called centrioles that then anchor the cilia in place. Multiciliated cells are generated from precursor cells that only have two centrioles. Therefore, as these precursors develop, they must produce large numbers of centrioles, considerably more than other cells that only need a couple of extra centrioles during cell division. However, recent studies have questioned whether the precursors of multiciliated cells rely on the same regulatory proteins to produce centrioles as dividing cells. To help answer this question, LoMastro et al. created genetically engineered mice that lacked or had an inactive form of PLK4, a protein which controls centriole formation in all cell types lacking multiple cilia. This showed that multiciliated cells also need this protein to produce centrioles. LoMastro et al. also found that multiciliated cells became larger while building centrioles, suggesting that this amplification process helps control the cell’s final size. Defects in motile cilia activity can lead to fluid build-up in the brain, respiratory infections and infertility. Unfortunately, these disorders are difficult to diagnose currently and there is no cure. The findings of LoMastro et al. further our understanding of how motile cilia are built and maintained, and may help future scientists to develop better diagnostic tools and treatments for patients.


Conflict of interest statement

GL, CD, AM, CJ, MS, AH No competing interests declared

Figures

Figure 1.
Figure 1.. Ependymal cells lacking PLK4 differentiate but fail to recruit STIL to deuterosomes.
(A) Schematic overview of the experiment to recombine the Plk4F/F allele in ependymal cells in vitro. Ependymal cells were harvested from Plk4F/F mice or Plk4F/+ controls and seeded onto coverslips. On differentiation day 0, the ependymal cells were transduced with AAV-Cre in serum-free media. (B) Quantification of the percent of FOXJ1-expressing ependymal cells transduced with AAV-Cre-GFP. N=3–4 brains, n>300 cells. Two-tailed Welch’s t-test. (C) Quantification of the percent of AAV-Cre-GFP transduced ependymal cells with deuterosomes, using DEUP1 as a maker. Day 0 N=3, day 7 N=5, day 9 N=2, day 15 N=3; n>300 cells. Two-tailed Welch’s t-test. (D) Quantification of the intensity of PLK4 on deuterosomes in ependymal cells on differentiation day 7. Cells in all stages of centriole amplification were measured and pooled. N=4, n≥20. Two-tailed Welch’s t-test. (E) Confocal images of Plk4F/F or Plk4F/+ ependymal cells transduced with AAV-Cre-GFP. Cells were stained with DEUP1 to mark deuterosomes (red) and PLK4 (white). Scale bar=5 μm. (F) Quantification of the intensity of STIL on deuterosomes in ependymal cells on differentiation day 7. Cells in all stages of centriole amplification were measured and pooled. N=3, n≥30. Two-tailed Welch’s t-test. (G) Confocal images of Plk4F/F or Plk4F/+ ependymal cells transduced with AAV-Cre-GFP. Cells were stained with DEUP1 (red) and STIL (white). Scale bar=5 μm. Data information: All data represent the means ± SEM. *p<0.05; ***<0.001.
Figure 1—figure supplement 1.
Figure 1—figure supplement 1.. Knockout of PLK4 leads to centriole loss in neural progenitor cells (NPCs).
(A) Diagram of the Plk4F allele showing LoxP sites surrounding exon 5 (top). Diagram of the Plk4Δ allele following Cre-mediated recombination (middle). Diagram of the mRNA product created from the Plk4Δ allele showing the premature termination codon (PTC) in exon 6 (bottom). (B) Frequency of progeny generated from intercrosses of Plk4F/Δ mice. N=45. (C) Representative whole-mount images of control and Plk4F/F;NestinCre brains at E14.5. Scale bar=0.2 cm. (D) Telencephalon area of control and Plk4F/F;NestinCre brains at E14.5. N=5; Two-tailed Welch’s t-test. (E) Graph showing centriole number per cell in mitotic NPCs from control and Plk4F/F;NestinCre brains at E14.5. N=3. Two-tailed Welch’s t-test. (F) Quantification of the percent of ependymal cells expressing GFP following transduction with AAV-Cre-GFP. N≥3, n>300. Two-tailed Welch’s t-test. Data information: All data represent the means ± SEM. ***p<0.001.
Figure 2.
Figure 2.. Loss of PLK4 blocks centriole assembly in ependymal cells.
(A) Quantification of the number of centrioles per cell in disengagement (D) phase. Plk4F/F or Plk4F/+ ependymal cells transduced with AAV-Cre-GFP were analyzed at differentiation days 7 and 8. N=3, n≥20. Two-tailed Welch’s t-test. (B) Images of Plk4F/F or Plk4F/+ ependymal cells transduced with AAV-Cre-GFP. Cells were stained with DEUP1 (magenta) and CEP135 to mark centrioles (white). Scale bar=5 μm. (C) Quantification of the percent of FOXJ1+Plk4F/F or Plk4F/+ ependymal cells transduced with AAV-Cre-GFP that have multiple cilia at differentiation day 12. Acetylated tubulin staining was used to identify multiciliated cells. N=3, n>300. Two-tailed Welch’s t-test. (D) Confocal images of Plk4F/F or Plk4F/+ ependymal cells transduced with AAV-Cre-GFP. Cells were stained with antibodies against FOXJ1 (magenta) and acetylated-α-tubulin (white). Scale bar=5 μm. (E, F) Expansion microscopy of Plk4F/F or Plk4F/+ ependymal cells at differentiation day 5 transduced with AAV-Cre-GFP. Cells were stained with acetylated-α-tubulin (cyan) and DEUP1 (magenta). Scale bar=0.5 μM. Data information: All data represent the means ± SEM. **p<0.01; ****<0.0001.
Figure 2—figure supplement 1.
Figure 2—figure supplement 1.. Ependymal cells lacking PLK4 recruit CEP152 but fail centriole amplification.
(A) Representative images of Plk4F/F or Plk4F/+ ependymal cells transduced with AAV-Cre-GFP. Cells were stained with antibodies against DEUP1 (white) and CEP152 (magenta). Scale bar=5 μm. (B) Quantification of the percent of AAV-Cre-GFP transduced FOXJ1+Plk4F/F or Plk4F/+ ependymal cells with amplified centrioles (MBB stage) at differentiation day 11. N=3, n>100. Two-tailed Welch’s t-test. (C) Representative images of Plk4F/F or Plk4F/+ ependymal cells transduced with AAV-Cre-GFP. Cells were stained with antibodies against CEP135 (white) and FOXJ1 (magenta). Scale bar=5 μm. Data information: All data represent the means ± SEM. *p<0.05.
Figure 3.
Figure 3.. PLK4 is required for multicliogenesis in vivo.
Confocal images of the lateral ventricle from control or Plk4F/F;Usp28F/F;NestinCre mouse brains at P21. Sections were stained with antibodies against FOXJ1 (white), CEP164 (yellow), and acetylated-α-tubulin (magenta). Scale bar=5 μm.
Figure 4.
Figure 4.. PLK4 promotes centriole assembly in mTECs.
(A) Schematic of the experimental design to genetically deplete PLK4 in mTECs. Plk4F/F;R26Cre tracheal epithelial cells were seeded onto collagen-coated transwell filters and allowed to proliferate until confluence (day 3). At this point, Cre-mediated recombination of the Plk4F/F allele was induced by the addition of 4OHT to the media. After 2 days, mTECs were exposed to ALI to initiate differentiation. (B) Quantification of the percent of control or Plk4F/F;R26Cre mTECs expressing FOXJ1 at ALI 7 and ALI 21. N=3, n>500. Two-tailed Welch’s t-test. (C) Quantification of the percent of control or Plk4F/F;R26Cre mTECs with deuterosomes at ALI 7 and ALI 21. N=3, n>500. Two-tailed Welch’s t-test. (D) Quantification of the percent of control or Plk4F/F;R26Cre mTECs that express PLK4 at ALI 3. N=3, n>500. Two-tailed Welch’s t-test. (E) Confocal images of control and Plk4F/F;R26Cre mTECs at ALI 3. Cells were expressing Centrin-GFP and stained with DEUP1 (magenta) and PLK4 (white). Scale bar=5 μm. (F) Quantification of the intensity of STIL on deuterosomes in control or Plk4F/F;R26Cre mTECs at ALI 3. Cells in all stages of centriole amplification were measured and pooled. N=3, n>500. Two-tailed Welch’s t-test. (G) Confocal images of control and Plk4F/F;R26Cre mTECs at ALI 3. Cells were expressing Centrin-GFP and stained with DEUP1 (magenta) and STIL (white). Scale bar=5 μm. (H) Quantification of multiciliated mTECs at ALI 7. N=3, n>500. Two-tailed Welch’s t-test. (I) Confocal images of control and Plk4F/F;R26Cre mTECs at ALI 7. Cells were expressing Centrin-GFP (yellow) and stained with FOXJ1 (cyan) and acetylated-α-tubulin (magenta). Scale bar=5 μm. (J) Quantification of multiciliated mTECs at ALI 21. N=3, n>500. Two-tailed Welch’s t-test. (K) Confocal images of control and Plk4F/F;R26Cre mTECs at ALI 21. Cells were expressing Centrin-GFP (green) and stained with FOXJ1 (cyan) and acetylated-α-tubulin (magenta). Scale bar=5 μm. Data information: All data represent the means ± SEM. *p<0.05; **<0.01; ***<0.001; ****<0.0001 and not significant indicates p>0.05. ALI, air-liquid interface; mTEC, mouse trachea epithelial cell.
Figure 4—figure supplement 1.
Figure 4—figure supplement 1.. mTECs lacking PLK4 recruit CEP152 but fail centriole amplification.
(A) Representative confocal images of control and Plk4F/F;R26Cre mTECs at ALI 3. Cells were expressing Centrin-GFP and stained with antibodies against DEUP1 (magenta) and CEP152 (white). Scale bar=5 μm. (B) Representative images of control mTECs in stages II–VI of centriole amplification demonstrating PLK4 localization during differentiation. Cells are expressing Centrin-GFP and stained with antibodies against DEUP1 (magenta) and PLK4 (white). Scale bar=5 μm. (C) Representative images of control and Plk4F/F;R26Cre mTECs at ALI 3 stained with antibodies against DEUP1 (magenta), Centrin (green), and SAS6 (white). Scale bar=5 μm. (D) Quantification of the average total intensity of SAS6 on deuterosomes per cell in control or Plk4F/F;R26Cre mTECs at ALI 3. Cells in all stages of centriole amplification were measured and pooled. N=3, n>50. Two-tailed Welch’s t-test. Data information: All data represent the means ± SEM. **p<0.01.
Figure 5.
Figure 5.. mTECs that fail centriole amplification form aberrant assemblies of centriole proteins.
(A) Quantification of the percent of control and Plk4F/F;R26Cre mTECs with Centrin aggregates at ALI 3. N=3, n>150. Two-tailed Welch’s t-test. (B) Confocal images of control and Plk4F/F;R26Cre mTECs at ALI 3. Cells were expressing Centrin-GFP and stained with DEUP1 (magenta) and CEP135 (white). Scale bar=5 μm. (C, D) Confocal images of control and Plk4F/F;R26Cre mTECs expanded by ultrastructure expansion microscopy (UExM). Cells were stained with antibodies against acetylated-α-tubulin (white) and GFP (magenta). Blue arrows indicate parent centrioles. Scale bar=0.5 μM. (E) Confocal images of control and Plk4F/F;R26Cre mTECs. Cells were expressing Centrin-GFP and stained with antibodies against γ-tubulin (white) and Centrobin (magenta). Scale bar=5 μm. (F) Confocal images of control and Plk4F/F;R26Cre mTECs. Cells were expressing Centrin-GFP and stained with an antibody against CEP164 (magenta). Scale bar=5 μm. (G) Table showing which of the centriole proteins form assemblies in Plk4F/F;R26Cre mTECs. Data information: All data represent the means ± SEM. *p<0.05. ALI, air-liquid interface; mTEC, mouse trachea epithelial cell.
Figure 5—figure supplement 1.
Figure 5—figure supplement 1.. Blocking centriole amplification in mTECs results in assemblies of some centriole proteins.
(A) Graph showing the percent of cells with Centrin aggregates in stages II-VI of centriole amplification in control mTECs at ALI 3. N=3, n>50. (B) Representative images of control and Plk4F/F;R26Cre mTECs expressing Centrin-GFP before and at various time points after photobleaching. (C) Quantification of the percent of Centrin-GFP fluorescence recovery after photobleaching in control and Plk4F/F;R26Cre mTECs. (D) Confocal images of control and Plk4F/F;R26Cre mTECs at ALI 7 expressing. Cells expressed Centrin-GFP and were stained with antibodies against CDK5RAP2 (magenta) and ZO1 (white). Scale bar=5 μm. (E) Representative images of control and Sas4F/F;R26Cre mTECs at ALI 7. Cells were stained with antibodies against DEUP1 (white), Centrin (green), and CEP135 (magenta). Scale bar=5 μm. (F) Quantification of the percent of control and Plk4F/F;R26Cre mTECs that have multiple cilia at ALI 7. N=3, n>300. Two-tailed Welch’s t-test. (G) Quantification of the percent of control and Plk4F/F;R26Cre mTECs that have Centrin assemblies at ALI 7. N=3, n>300. Two-tailed Welch’s t-test. Data information: All data represent the means ± SEM. **p<0.01 and not significant indicates p>0.05.
Figure 6.
Figure 6.. Plk4 kinase activity is critical for centriole amplification in MCCs.
(A) Quantification of the intensity of PLK4 on deuterosomes in mTECs at ALI 2. N=3 (Plk4cWT/F;R26Cre) or 4 (Plk4cKD/F;R26Cre), n=158 (Plk4cWT/F;R26Cre) or 187 (Plk4cKD/F;R26Cre). Two-tailed Welch’s t-test. (B) Representative confocal images of Plk4cWT/F;R26Cre or Plk4cKD/F;R26Cre mTECs at ALI 2 stained with antibodies against PLK4 (white), Centrin (green), and DEUP1 (magenta). Scale bar=5 μm. (C) Quantification of the percent of multiciliated Plk4cWT/F;R26Cre or Plk4cKD/F;R26Cre mTECs at ALI 7. N=3, n>200. Two-tailed Welch’s t-test. (D) Representative confocal images of Plk4cWT/F;R26Cre or Plk4cKD/F;R26Cre mTECs at ALI 7 stained with antibodies against CEP135 (white), Centrin (green), and acetylated-α-tubulin. Scale bar=5 μm. (E) Quantification of the percent of FOXJ1+Plk4cWT/F or Plk4cKD/F ependymal cells transduced with AAV-Cre-GFP that have multiple cilia at differentiation day 12. N=3, n≥100. Two-tailed Welch’s t-test. (F) Confocal images of Plk4cWT/F or Plk4cKD/F ependymal cells transduced with AAV-Cre-GFP at differentiation day 12. Cells were stained with antibodies against FOXJ1 (magenta) and acetylated-α-tubulin (white). Scale bar=5μm. (G) Quantification of the average number of deuterosomes per cell in Plk4cWT/F;R26Cre, Plk4cKD/F;R26Cre, Plk4F/+;R26Cre, or Plk4F/F;R26Cre mTECs. N=3, n≥50. Two-tailed Welch’s t-test. (H) Quantification of the average deuterosome size per cell Plk4cWT/F;R26Cre, Plk4cKD/F;R26Cre, Plk4F/+;R26Cre, or Plk4F/F;R26Cre mTECs. N=3, n≥50. Two-tailed Welch’s t-test. Data information: All data represent the means ± SEM. *p<0.05; **<0.01; and not significant indicates p>0.05. MCC, multiciliated cell.
Figure 6—figure supplement 1.
Figure 6—figure supplement 1.. Inhibition of PLK4 kinase activity with centrinone delays centriole amplification in ependymal cells.
(A) Quantification of the intensity of PLK4 on deuterosomes in ependymal cells treated with DMSO or increasing concentrations of centrinone on differentiation day 5. Cells in all stages of centriole amplification were measured and pooled. N≥3, n>20. One-way ANOVA with post hoc analysis. (B) Quantification of the percent of ependymal cells with deuterosomes (marked by DEUP1). Cells were treated with DMSO or increasing concentrations of centrinone and analyzed at differentiation day 7. N≥3, n>100. One-way ANOVA with post hoc analysis. (C) Quantification of the percent of DEUP1+ ependymal cells in A or G stage, D stage, or MBB stage of centriole amplification. Cells were treated with DMSO or centrinone at the indicated concentrations. N=3, n≥67. One-way ANOVA with post hoc analysis. (D) Quantification of the number of centrioles per cell in disengagement (D) phase. Ependymal cells were treated with DMSO or centrinone and analyzed at differentiation day 7. N=3, n≥17. One-way ANOVA with post hoc analysis. (E) Representative images of ependymal cells treated with DMSO or 10 μM of centrinone. Cells were stained with antibodies against CEP135 (green), DEUP1 (magenta), and PLK4 (white). Scale bar=5μm.
Figure 6—figure supplement 2.
Figure 6—figure supplement 2.. Inhibition of PLK4 kinase activity with centrinone does not perturb centriole amplification in mTECs.
(A) Quantification of the percent of MBB stage mTECs at ALI 7 treated with either DMSO or 10 μM of centrinone. N=3, n>300. Two-tailed Welch’s t-test. (B) Quantification of the number of centrioles per cell in MBB stage mTECs treated with DMSO or 10 μM of centrinone at ALI 7. N=3, n>50. Two-tailed Welch’s t-test. (C) Representative confocal images of mTECs treated with DMSO or 10 μM of centrinone. Cells were analyzed at ALI 7 and stained with antibodies against Centrin (green), DEUP1 (white), and acetylated-α-tubulin (magenta). Scale bar=10μm. (D) Quantification of the intensity of PLK4 on deuterosomes in mTECs treated with DMSO or increasing concentrations of centrinone at ALI 7. Cells in all stages of centriole amplification were measured and pooled. N≥3, n>50. One-way ANOVA with post hoc analysis. (E) Representative confocal images of mTECs treated with DMSO or 10 μM centrinone at ALI 7. Cells were stained with antibodies against centrin (green), DEUP1 (magenta), and PLK4 (white). Scale bar=10μm. (F G) Quantification of the percent of multiciliated mTECs (F) or centriole number per MBB stage cell (G) at ALI 7 treated with either DMSO, 10 μM of centrinone, 10 μM of the broad-spectrum efflux pump inhibitor verapamil, or both 10 μM of centrinone and 10 μM of verapamil. Data information: All data represent the means ± SEM. *p<0.05; **<0.01; ***<0.001; ****<0.0001 and not significant indicates p>0.05. ALI, air-liquid interface; MBB, multiple basal body; mTEC, mouse trachea epithelial cell.
Figure 6—figure supplement 3.
Figure 6—figure supplement 3.. A mouse model for the conditional expression of kinase-dead PLK4.
(A, B) Diagram of the Plk4cKD (A) and Plk4cWT (B) alleles showing LoxP sites surrounding a stop cassette between exons 4 and 5 (top). The stop cassette prevents transcription of either the wild-type or kinase-dead gene. Diagram of the Plk4KD (A) and Plk4WT (B) alleles following Cre-mediated recombination (middle). Excision of the LoxP-STOP-LoxP cassette allows for transcription. Diagram of the mRNA product created from Plk4KD (A) and Plk4WT (B) alleles (bottom).
Figure 6—figure supplement 4.
Figure 6—figure supplement 4.. PLK4 kinase activity is required for centriole amplification in ependymal cells.
(A) Percent of AAV-Cre transduced ependymal cells with PLK4 on deuterosomes. N=3, n>70. Two-tailed Welch’s t-test. (B) Representative images of AAV-Cre transduced Plk4cWT/F and Plk4cKD/F ependymal cells stained with DEUP1 (magenta) and PLK4 (white). Scale bar=5 μm. (C) Quantification of the intensity of PLK4 on deuterosomes in ependymal cells on differentiation day 5. Cells in all stages of centriole amplification were measured and pooled. N=3, n≥50. Two-tailed Welch’s t-test. (D) Representative images of AAV-Cre transduced ependymal cells stained with antibodies against DEUP1 (magenta) and STIL (white). Scale bar=5 μm. (E) Quantification of the percent of AAV-Cre transduced Plk4cWT/F and Plk4cKD/F ependymal cells with STIL + deuterosomes. N>3, n≥50. Two-tailed Welch’s t-test. (F) Quantification of the average number of deuterosomes per cell in AAV-Cre transduced Plk4cWT/F, Plk4cKD/F, Plk4F/+, or Plk4F/F ependymal cells. N=3, n≥50. Two-tailed Welch’s t-test. (G) Quantification of the average deuterosome size per cell in AAV-Cre transduced Plk4cWT/F, Plk4cKD/F, Plk4F/+, or Plk4F/F ependymal cells. N=3, n≥50. Two-tailed Welch’s t-test. Data information: All data represent the means ± SEM. *p<0.05; ***<0.001; and not significant indicates p>0.05.
Figure 7.
Figure 7.. Centriole amplification promotes apical surface area expansion in mTECs.
(A) Representative confocal images of control mTECs in stages II-VI of centriole amplification. Cells were expressing Centrin-GFP and stained with antibodies against DEUP1 (magenta) and ZO1 (white). Scale bar = 2 μm. (B) Graph of the apical area of control mTECs (marked with ZO1) at ALI 3 at different stages of centriole amplification. Circles represent individual cells and triangles represent the average per biological replicate. N=3, n≥20. One-way ANOVA with post hoc analysis. (C) Graph of the apical area of control, Plk4F/F;R26Cre and Sas4F/F;R26Cre mTECs at ALI 3 and ALI 7. The area across all stages of centriole amplification was pooled per condition. MBB phase cells that presumably escaped Cre-mediated recombination serve as an internal control. Circles represent individual cells and triangles represent the average per biological replicate. N≥3, n≥50. Two-tailed Welch’s t-test (ALI 3). One-way ANOVA with post hoc analysis (ALI 7). (D) Representative confocal images of control and Plk4F/F;R26Cre mTECs at ALI 3. Cells were expressing Centrin-GFP and stained with antibodies against DEUP1 (magenta) and ZO1 (white). Scale bar = 5 μm. (E) Representative confocal images of control mTECs at ALI 7. Plk4F/+;R26Cre cells were expressing Centrin-GFP and stained with antibodies against FOXJ1 (magenta) and ZO1 (white). Sas4F/F cells were stained with antibodies against Centrin (green) and ZO1 (white). Scale bar = 5 μm. (F) Representative confocal images of Plk4F/F;R26Cre and Sas4F/F;R26Cre mTECs at ALI 7. Plk4F/F;R26Cre cells were expressing Centrin-GFP and stained with antibodies against FOXJ1 (magenta) and ZO1 (white). Sas4F/F;R26Cre cells were stained with antibodies against Centrin (green) and ZO1 (white). MBB phase cells that presumably escaped Cre-mediated recombination are marked with an *. Scale bar = 5 μm. Data information: All data represent the means ± SEM. *P < 0.05; **< 0.01; ***< 0.001; ****< 0.0001 and not significant indicates P > 0.05.
Author response image 1.

Comment in

  • One master to rule them all.
    Barbeito P, Garcia-Gonzalo FR. Barbeito P, et al. Elife. 2022 Sep 23;11:e82873. doi: 10.7554/eLife.82873. Elife. 2022. PMID: 36149392 Free PMC article.

Similar articles

Cited by

References

    1. Al Jord A, Lemaître A-I, Delgehyr N, Faucourt M, Spassky N, Meunier A. Centriole amplification by mother and daughter centrioles differs in multiciliated cells. Nature. 2014;516:104–107. doi: 10.1038/nature13770. - DOI - PubMed
    1. Al Jord A, Shihavuddin A, Servignat d’Aout R, Faucourt M, Genovesio A, Karaiskou A, Sobczak-Thépot J, Spassky N, Meunier A. Calibrated mitotic oscillator drives motile ciliogenesis. Science. 2017;358:803–806. doi: 10.1126/science.aan8311. - DOI - PubMed
    1. Anderson RG, Brenner RM. The formation of basal bodies (centrioles) in the rhesus monkey oviduct. The Journal of Cell Biology. 1971;50:10–34. doi: 10.1083/jcb.50.1.10. - DOI - PMC - PubMed
    1. Bellamy WT. P-glycoproteins and multidrug resistance. Annual Review of Pharmacology and Toxicology. 1996;36:161–183. doi: 10.1146/annurev.pa.36.040196.001113. - DOI - PubMed
    1. Bettencourt-Dias M, Rodrigues-Martins A, Carpenter L, Riparbelli M, Lehmann L, Gatt MK, Carmo N, Balloux F, Callaini G, Glover DM. SAK/PLK4 is required for centriole duplication and flagella development. Current Biology. 2005;15:2199–2207. doi: 10.1016/j.cub.2005.11.042. - DOI - PubMed

Publication types

Substances