. 2022 Aug 15:11:e80530.
doi: 10.7554/eLife.80530.

Tissue-specific modifier alleles determine Mertk loss-of-function traits

Affiliations

Tissue-specific modifier alleles determine Mertk loss-of-function traits

Yemsratch T Akalu et al. Elife. .

Abstract

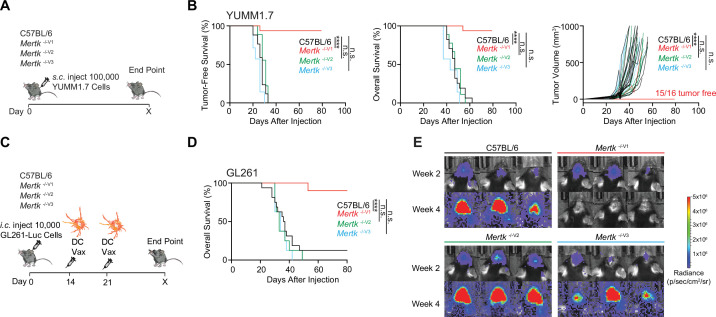
Knockout (KO) mouse models play critical roles in elucidating biological processes behind disease-associated or disease-resistant traits. As a presumed consequence of gene KO, mice display certain phenotypes. Based on insight into the molecular role of said gene in a biological process, it is inferred that the particular biological process causally underlies the trait. This approach has been crucial towards understanding the basis of pathological and/or advantageous traits associated with Mertk KO mice. Mertk KO mice suffer from severe, early-onset retinal degeneration. MERTK, expressed in retinal pigment epithelia, is a receptor tyrosine kinase with a critical role in phagocytosis of apoptotic cells or cellular debris. Therefore, early-onset, severe retinal degeneration was described to be a direct consequence of failed MERTK-mediated phagocytosis of photoreceptor outer segments by retinal pigment epithelia. Here, we report that the loss of Mertk alone is not sufficient for retinal degeneration. The widely used Mertk KO mouse carries multiple coincidental changes in its genome that affect the expression of a number of genes, including the Mertk paralog Tyro3. Retinal degeneration manifests only when the function of Tyro3 is concomitantly lost. Furthermore, Mertk KO mice display improved anti-tumor immunity. MERTK is expressed in macrophages. Therefore, enhanced anti-tumor immunity was inferred to result from the failure of macrophages to dispose of cancer cell corpses, resulting in a pro-inflammatory tumor microenvironment. The resistance against two syngeneic mouse tumor models observed in Mertk KO mice is not, however, phenocopied by the loss of Mertk alone. Neither Tyro3 nor macrophage phagocytosis by alternate genetic redundancy accounts for the absence of anti-tumor immunity. Collectively, our results indicate that context-dependent epistasis of independent modifier alleles determines Mertk KO traits.

Keywords: Mertk knockout mice; anti-tumor immunity; immunology; inflammation; mouse; retinal degeneration.


Conflict of interest statement

YA, MM, MA, LH, JN, EA, XL, YK, WP, MB, SF, AI, AL No competing interests declared, LH, DA, TK is affiliated with Celldex Therapeutics. The author has no financial interests to declare, CR Senior editor, eLife, SG has received grant support from Mirati Therapeutics

Figures

Figure 1.
Figure 1.. Generation of B6 embryonic stem (ES) cell-derived mice with genetic ablation of Mertk.
(A) Schematic showing the differences in approach between the generation of Mertk -/-V1 mice by targeting Mertk in 129P2/OlaHsd (129P2)-derived ES cells by Camenisch et al. and our Mertk knockout mouse lines. 129P2 ES cells were microinjected into C57BL/6 (B6) blastocysts to generate chimeric mice with germline transmission of deleted Mertk allele by Camenisch et al. Chimeric mice were subsequently backcrossed onto B6 mice for >10 generations in our laboratory to obtain Mertk -/-V1 mice. Our two independent Mertk knockout mouse lines, Mertk -/-V2 and Mertk -/-V3 mice, were generated by targeting Mertk in B6 ES cells. Red stars indicate at least one copy of the mutant allele of Mertk. (B) Schematic indicating Mertk -/-V1 mice have deletion of exon 17 that encodes for the kinase domain of Mertk. A neomycin cassette is also present at this site. Mertk -/-V2 mice have targeted excision of exon 18, which also encodes for residues in the kinase domain. Mertk -/-V3 mice have exons 3 and 4 targeted with CRISPR/Cas9 approach. (C, D) Representative and quantification of independent MERTK Western blot data depicting total MERTK protein expression in spleen, brain, testis, retinal pigment epithelia (RPE), and peritoneal cavity cells (PerC) from C57BL/6, Mertk -/-V1, Mertk -/-V2, and Mertk -/-V3 mice (mean ± SEM of n = 3–4 mice/genotype). **p<0.01. ***p<0.001, ****p<0.0001, one-way ANOVA Dunnett’s test. Source files for the representative Western blot images (C) and the corresponding quantitative analysis (D) performed are available in Figure 1—source data 1. Supporting data for (B) is available in Figure 1—figure supplement 1A–C.
Figure 1—figure supplement 1.
Figure 1—figure supplement 1.. PCR genotyping of mouse lines targeting Mertk (including a mouse line with the simultaneous ablation of Mertk and Tyro3).
(A) PCR amplification of genomic DNA (gDNA) from Mertk -/-V1 mice using primers P1–P2 and P3–P4. Binding sites for primers P1–P2 and P3–P4 are indicated in Figure 1B. (B) Excision of targeted allele in Mertk -/-V2 mice was confirmed using primers P5–P6. Binding sites for primers P5–P6 are indicated in Figure 1B. (C) PCR amplification of gDNA from Mertk -/-V3 mice, using primers P7–P8, confirming excision. Binding sites for primers P7–P8 are indicated in Figure 1B. (D) PCR amplification of genomic DNA from Mertk -/-V2 Tyro3 -/-V2 mice, using primers P9–P10, confirming excision. Binding sites for primers P9–P10 are indicated in Figure 5C. Source files for all gel images shown are available in .
Figure 2.
Figure 2.. Retinal degeneration of Mertk -/-V1 mice is not phenocopied by Mertk -/-V2 and Mertk -/-V3 mice.
Morphological and functional changes in the eye were assessed in 6-month-old C57BL/6, Mertk -/-V1, Mertk -/- V2, and Mertk -/-V3 mice. (A) Representative hematoxylin-eosin-stained transverse sections of the retina. Boxed section is shown as inset and indicates the area quantified in (B). Scale bars = 200 mm (left panels) and 10 mm (insets). (B) Quantification of outer nuclear layer (ONL) thickness in the area indicated in (A) (mean ± SEM of 10 measurements/mouse, n = 6 mice/genotype). ****p<0.0001, one-way ANOVA Dunnett’s test. (C) Ultrastructure at the photoreceptor outer segment–retinal pigment epithelia (POS–RPE) interface (dashed line) by transmission electron microscopy. Scale bars = 1 mm. (D) Representative scotopic electroretinogram traces are shown at the highest luminance tested. (E) Quantification of a-wave amplitude at highest luminance tested (25 cd.s/m2) (mean ± SEM of n = 3–6 mice/ genotype). *p<0.05, one-way ANOVA Dunnett’s test. (F) Quantification of b-wave amplitude at the highest luminance tested (25 cd.s/m2) (mean ± SEM of n = 3–6 mice/ genotype). *p<0.05, one-way ANOVA Dunnett’s test. (G) a-wave amplitude at increasing luminance (mean ± SEM of n = 3–6 mice/ genotype). *p<0.05, **p<0.01, two-way ANOVA. Source files for (B) ONL thickness, (E) a-wave amplitude, (F) b-wave amplitude, and (G) a-wave amplitude at increasing luminance are available in Figure 2—source data 1. GCL,-ganglion cell layer; IPL, inner plexiform layer; INL, inner nuclear layer; OPL, outer plexiform layer.
Figure 3.
Figure 3.. Significant gene expression differences in retinal pigment epithelia (RPE) of Mertk -/-V1 versus Mertk -/-V2 and Mertk -/-V3 mice.
(A) Haplotype map comparing 20 microsatellite markers across chromosome 2 in C57BL/6, Mertk -/-V1, Mertk -/-V2, and Mertk -/-V3 mice. Black rectangles indicate homozygosity for C57BL/6 (B6) alleles, and gray rectangles indicate homozygosity for 129P2/OlaHsd (129P2) alleles. (B) Distribution of differentially expressed genes (DEGs) in RPE across chromosomes (n = 3–6 samples/genotype). *p<0.05, **p<0.01, ***p<0.001, ****p<0.0001, hypergeometric test. (C) Schematic showing genes neighboring Mertk that are significantly upregulated or downregulated in the RPE of Mertk -/-V1 mice. (D) qPCR quantification of indicated chromosome 2 genes in C57BL/6, Mertk -/-V1, Mertk -/-V2, and Mertk -/-V3 RPEs (mean ± SEM, n = 4–5 samples/genotype). *p<0.05, **p<0.01, ***p<0.001, one-way ANOVA Dunnett’s test. Source files for the distribution of DEGs in RPEs across chromosomes (B) and qPCR quantification of various chromosome 2 genes (D) are available in Figure 3—source data 1. Supporting data for (A) is available in Figure 3—figure supplement 1.
Figure 3—figure supplement 1.
Figure 3—figure supplement 1.. A 129P2-specific genomic interval is present in Mertk -/-V1 but not in Mertk -/-V2 and Mertk -/-V3 mice.
Representative PCR amplification products corresponding to 24 different microsatellite markers on chromosome 2 using genomic DNA extracted from C57BL/6, Mertk -/-V1, Mertk -/-V2, and Mertk -/-V3 mice. The presence of a 129P2/OlaHsd (129P2)-derived segment of DNA on chromosome 2 in Mertk -/- V1 mice was confirmed, at each microsatellite location shown, in at least three animals. Source files for the gel images shown are available in .
Figure 4.
Figure 4.. Tyro3 is epistatic with Mertk for the retinal degeneration trait.
(A) qPCR quantification of Tyro3 in C57BL/6, Mertk -/-V1, Mertk -/-V2, and Mertk -/-V3 retinal pigment epithelia (RPE) (mean ± SEM, n = 4–5 samples/genotype). **p<0.01, one-way ANOVA Dunnett’s test. (B) Representative and independent measurements of TYRO3 amounts in RPE. Western blot (WB) from C57BL/6, Mertk -/-V1, Mertk -/-V2, Mertk -/-V3, and Tyro3 -/-V1 mice RPE (mean ± SEM of n = 5 mice/ genotype). *p<0.05, **p<0.01, ***p<0.001, and ****p<0.0001, one-way ANOVA Dunnett’s test. (C) Schematic showing targeting of Tyro3 exons 7–18 with CRISPR/Cas9 in Mertk -/-V2 ES cells to generate the Mertk -/- V2 Tyro3 -/- V2 mouse line. Image not drawn to scale. (D, E) Representative and independent measurements of TYRO3 amounts in RPE. WB from C57BL/6, Mertk -/-V2 Tyro3 -/-V2, and Tyro3 -/-V1 mice RPE (mean ± SEM of n = 4 mice/ genotype). ****p<0.0001, one-way ANOVA Dunnett’s test. (F) Representative hematoxylin-eosin-stained transverse sections of the retina. Boxed section is shown as inset and indicates the areas quantified in (G). Scale bars = 200 mm (left panels) and 10 mm (insets). (G) Quantification of outer nuclear layer (ONL) thickness in the area indicated in (F) (mean ± SEM of 10 measurements/mouse, n = 3–6 mice/genotype). ****p<0.0001, one-way ANOVA Dunnett’s test. (H) Representative scotopic electroretinogram traces are shown at the highest luminance tested. (I) Quantification of a-wave amplitude and b-wave amplitude at highest luminance tested (mean ± SEM of n = 3–6 mice/genotype). *p<0.05, **p<0.01, ***p<0.001, ****p<0.0001, one-way ANOVA Dunnett’s test. a-wave amplitude at increasing luminances. **p<0.01, ****p<0.0001, two-way ANOVA. Morphological and functional changes in the eye were assessed in 6-month-old C57BL/6, Mertk -/-V1, and Mertk -/-V2 Tyro3 -/-V2 mice. Source files for (A) qPCR quantification of Tyro3, (B, E) quantification of TYRO3 levels, (G) ONL thickness, (I) a-wave amplitude, b-wave amplitude, and a-wave amplitude at increasing luminances are available in Figure 4—source data 1. Supporting data for (C) is available in Figure 1—figure supplement 1D. GCL, ganglion cell layer; IPL, inner plexiform layer; INL, inner nuclear layer; OPL,-outer plexiform layer.
Figure 5.
Figure 5.. Anti-tumor response of Mertk -/-V1 mice is not phenocopied by Mertk -/-V2 and Mertk -/-V3 mice.
(A) Schematic showing subcutaneous injection of 100,000 Braf V600E Pten -/- YUMM1.7 mouse melanoma cells into mice of different genotypes. (B) Tumor-free survival (TFS), overall survival (OS), and tumor volume in C57BL/6 (n = 17), Mertk -/-V1 (n = 16), Mertk -/-V2 (n = 9), and Mertk -/-V3 (n = 7) mice implanted with YUMM1.7 cells. ****p<0.0001, Log-rank Mantel–Cox test or two-way ANOVA, Dunnett’s multiple-comparison test. (C) Schematic showing intracranial injection of 10,000 GL261-Luc glioma cells and intraperitoneal dendritic cell vaccination of mice at 14 and 21 days post-tumor implantation. (D) OS in C57BL/6 (n = 16), Mertk -/-V1 (n = 10), Mertk -/-V2 (n = 8), and Mertk -/- V3 (n = 8) mice implanted with GL261 tumors. ****p<0.0001, Log-rank Mantel–Cox test. (E) Representative IVIS images of intracranial tumors at D14 and D28 post-implantation. Source files for TFS (B) and OS (B, D) plots shown are available in Figure 5—source data 1. Supporting data relating to (C–E) is available in Figure 5—figure supplement 1.
Figure 5—figure supplement 1.
Figure 5—figure supplement 1.. Unvaccinated Mertk -/- V1 mice are not protected against GL261 tumors.
(A) Schematic of intracranial injection of 10,000 GL261-Luc glioma cells in mice. (B) Overall survival (OS) in C57BL/6 (n = 9) and Mertk -/-V1 (n = 11) mice. n.s., Log-rank Mantel–Cox test. (C) Representative IVIS images of intracranial tumors in mice at D14 and D28 post-implantation. Source file for the OS plot (B) shown is available in Figure 5—source data 2.
Figure 6.
Figure 6.. Anti-tumor response of Mertk -/-V1 mice is neither the result of deficient efferocytosis by macrophages nor hypomorphic TYRO3.
(A) Distribution of differentially expressed genes (DEGs) in bone marrow-derived macrophages (BMDMs) across chromosomes. (n = 3 samples/genotype). *p<0.05, ****p<0.0001, hypergeometric test. (B) Schematic indicating chromosome 2 genes that are upregulated or downregulated in Mertk -/-V1 BMDMs. (C) qPCR quantification of the indicated chromosome 2 genes in C57BL/6, Mertk -/-V1, Mertk -/-V2, and Mertk -/-V3 BMDMs (mean ± SEM, n = 5 samples/genotype). *p<0.05, **p<0.01, ***p<0.001, ****p<0.0001, one-way ANOVA Dunnett’s test. (D) BMDMs from C57BL/6, Mertk -/-V1, Mertk -/-V2, and Mertk -/-V3 mice were co-cultured with apoptotic thymocytes for 1 hr. Representative plots show uptake of pHrodo-labeled apoptotic thymocytes by CD11b+F4/80+ BMDMs by flow cytometry. (E) Quantification of (D) (mean ± SEM, n = 3–6 mice/group). **p<0.01, Mann–Whitney or Student’s t-test. (F) Tumor-free survival (TFS), overall survival (OS), and tumor volume in C57BL/6 (n = 7), Mertk -/-V1 (n = 7), and Mertk -/-V2 Tyro3 -/-V2 (n = 7) mice implanted with YUMM1.7 tumors. n.s., Log-rank Mantel–Cox test. (G) OS in C57BL/6 (n = 5) and Mertk -/-V2 Tyro3 -/-V2 (n = 6) mice implanted with GL261 tumors. n.s., Log-rank Mantel–Cox test. (H) Representative IVIS images of intracranial tumors in C57BL/6 and Mertk -/-V2 Tyro3 -/-V2 mice at D14 and D28 post-implantation. Source files for the distribution of DEGs in BMDMs across chromosomes (A), qPCR quantification of various chromosome 2 genes (C), quantification of percentage of pHrodo+ BMDMs (E), TFS (F), and OS (F, G) plots are available in Figure 6—source data 1. Supporting data for (D, E) is available in Figure 6—figure supplement 1.
Figure 6—figure supplement 1.
Figure 6—figure supplement 1.. Significantly diminished MERTK expression in bone marrow-derived macrophages (BMDMs) isolated from Mertk knockout mice.
(A, B) Representative flow cytometry and independent quantification of MERTK levels in BMDMs from C57BL/6, Mertk -/-V1, Mertk -/-V2, and Mertk -/-V3 mice (mean ± SEM of n = 4–5 mice/genotype). ****p<0.0001, one-way ANOVA Dunnett’s test; **p<0.01, Mann–Whitney test. Source files for quantification of MERTK levels in BMDMs are available in Figure 6—source data 2.

Similar articles

Cited by

References

    1. Akalu YT, Rothlin CV, Ghosh S. TAM receptor tyrosine kinases as emerging targets of innate immune checkpoint blockade for cancer therapy. Immunological Reviews. 2017;276:165–177. doi: 10.1111/imr.12522. - DOI - PMC - PubMed
    1. Bolivar VJ, Cook MN, Flaherty L. Mapping of quantitative trait loci with knockout/congenic strains. Genome Research. 2001;11:1549–1552. doi: 10.1101/gr.194001. - DOI - PMC - PubMed
    1. Camenisch TD, Koller BH, Earp HS, Matsushima GK. A novel receptor tyrosine kinase, mer, inhibits TNF-alpha production and lipopolysaccharide-induced endotoxic shock. Journal of Immunology. 1999;162:3498–3503. - PubMed
    1. Chan PY, Carrera Silva EA, De Kouchkovsky D, Joannas LD, Hao L, Hu D, Huntsman S, Eng C, Licona-Limón P, Weinstein JS, Herbert DR, Craft JE, Flavell RA, Repetto S, Correale J, Burchard EG, Torgerson DG, Ghosh S, Rothlin CV. The TAM family receptor tyrosine kinase TYRO3 is a negative regulator of type 2 immunity. Science. 2016;352:99–103. doi: 10.1126/science.aaf1358. - DOI - PMC - PubMed
    1. Chen Y, Wang H, Qi N, Wu H, Xiong W, Ma J, Lu Q, Han D. Functions of TAM rtks in regulating spermatogenesis and male fertility in mice. Reproduction. 2009;138:655–666. doi: 10.1530/REP-09-0101. - DOI - PubMed

Associated data