. 2022 Nov 2;82(21):3903-3916.
doi: 10.1158/0008-5472.CAN-21-3819.

Single-Cell Dissection of the Multiomic Landscape of High-Grade Serous Ovarian Cancer

Affiliations

Single-Cell Dissection of the Multiomic Landscape of High-Grade Serous Ovarian Cancer

Yicheng Wang et al. Cancer Res. .

Abstract

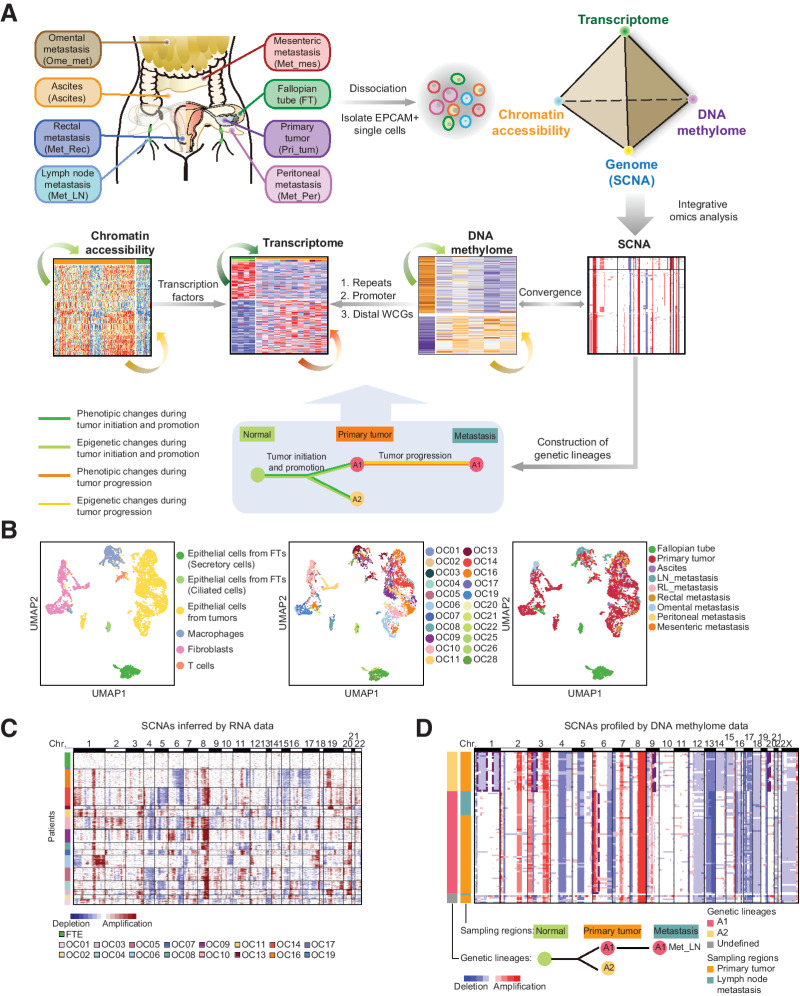
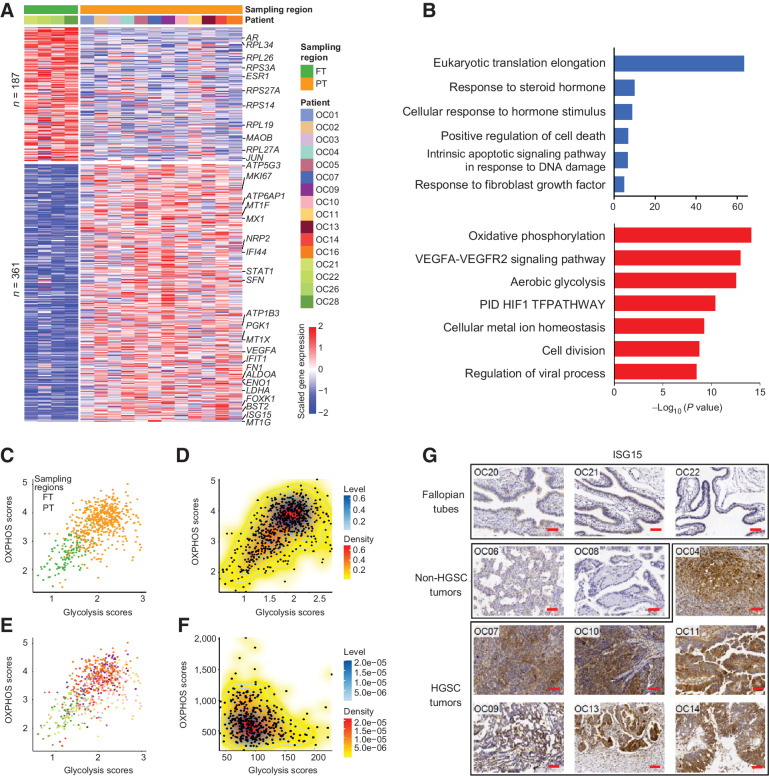
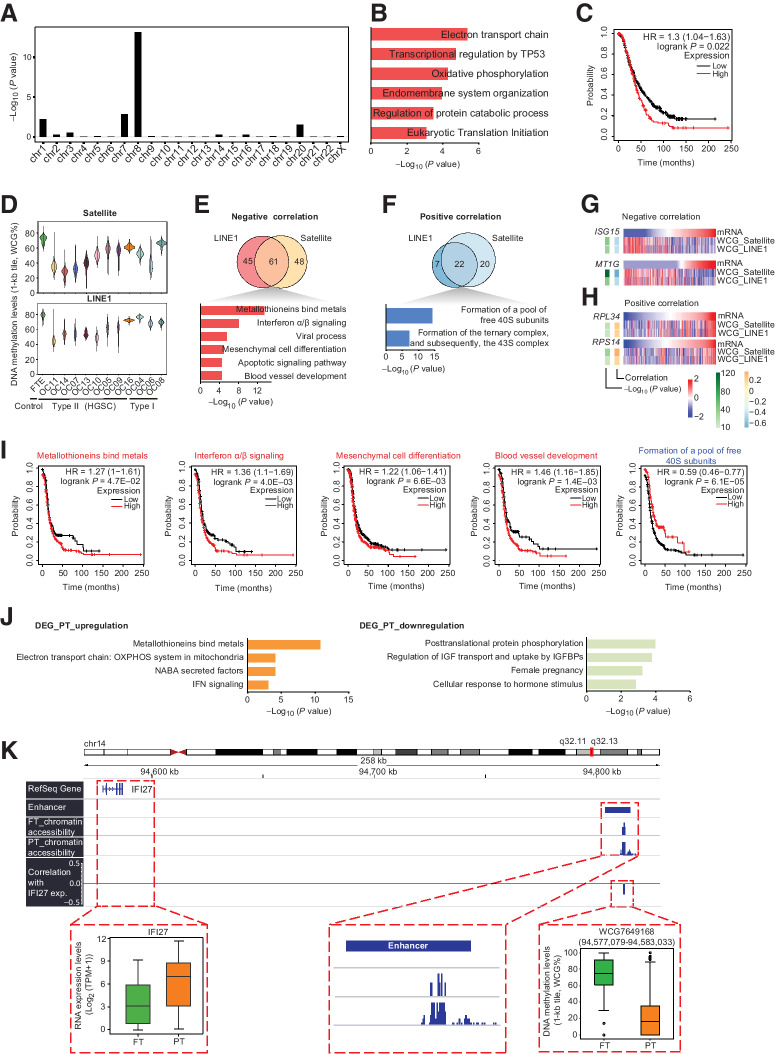
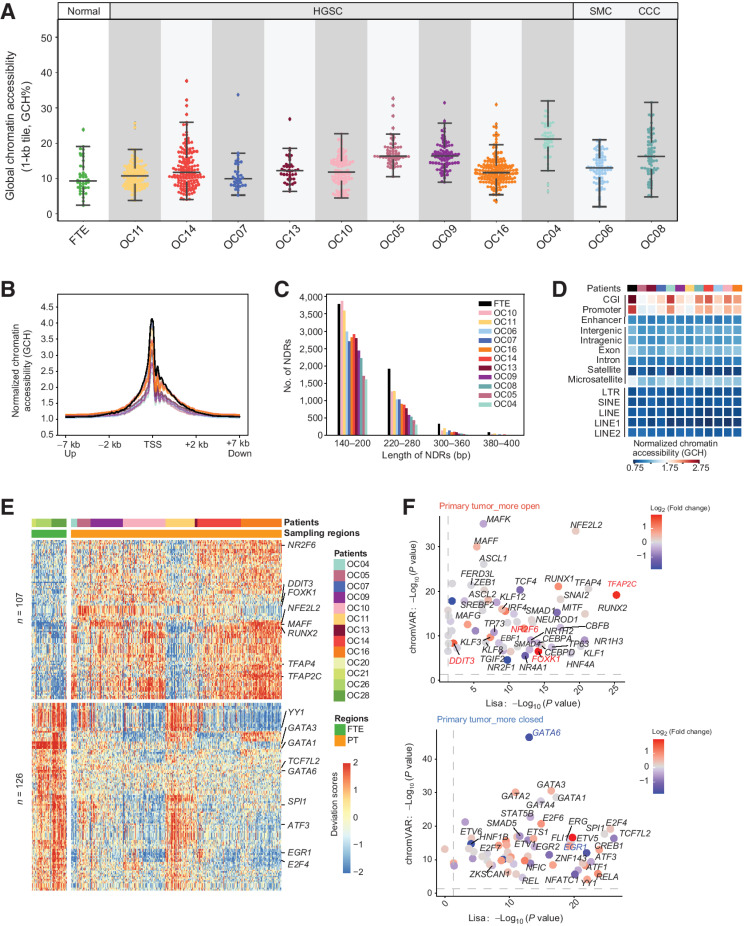
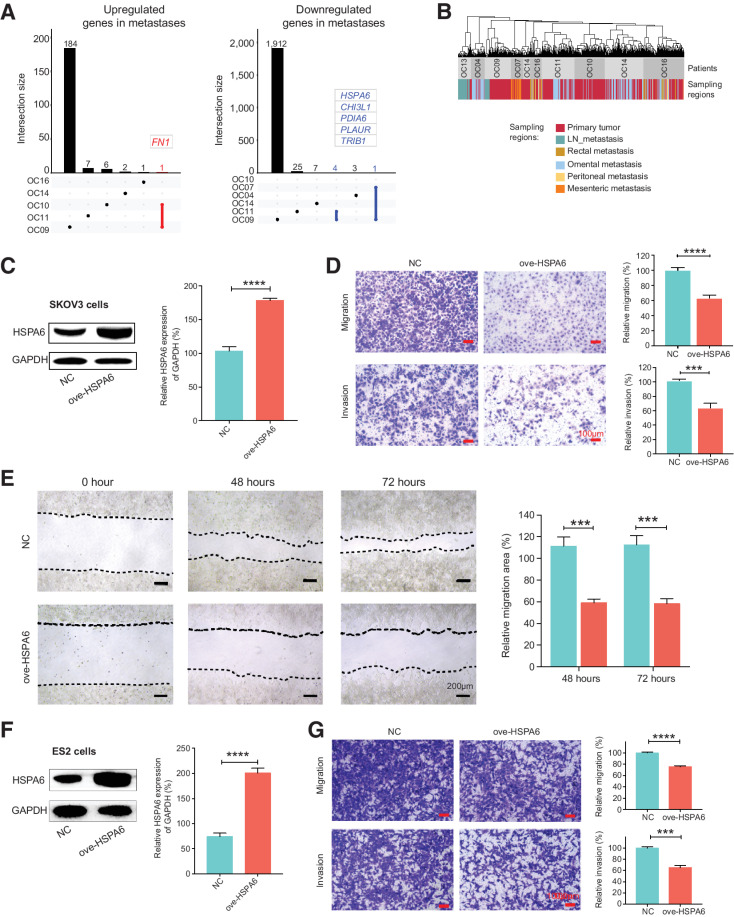
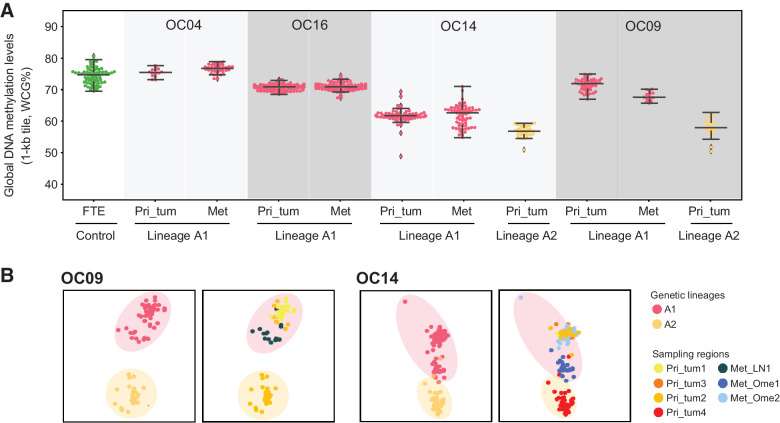
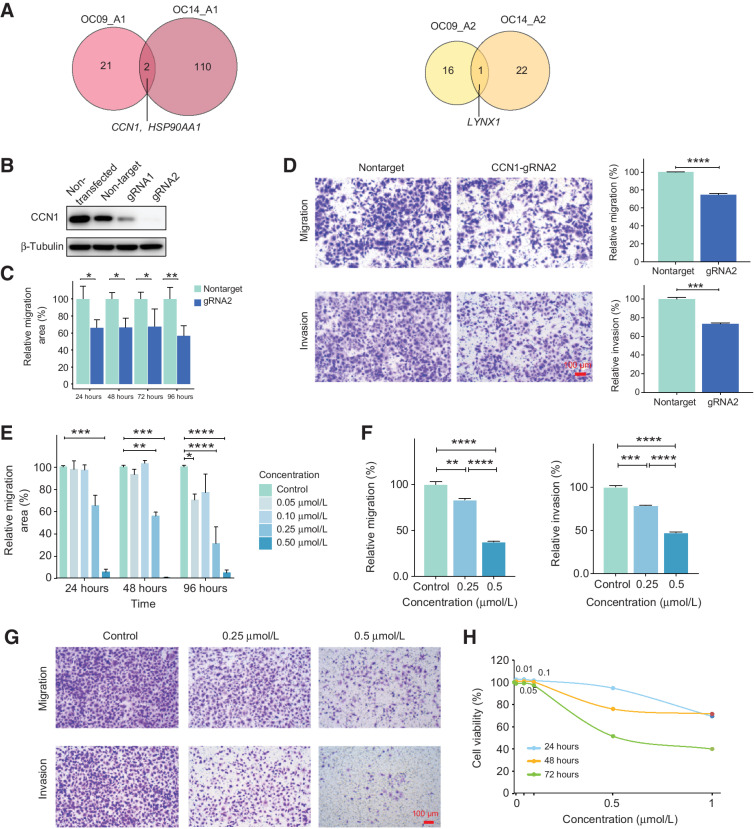
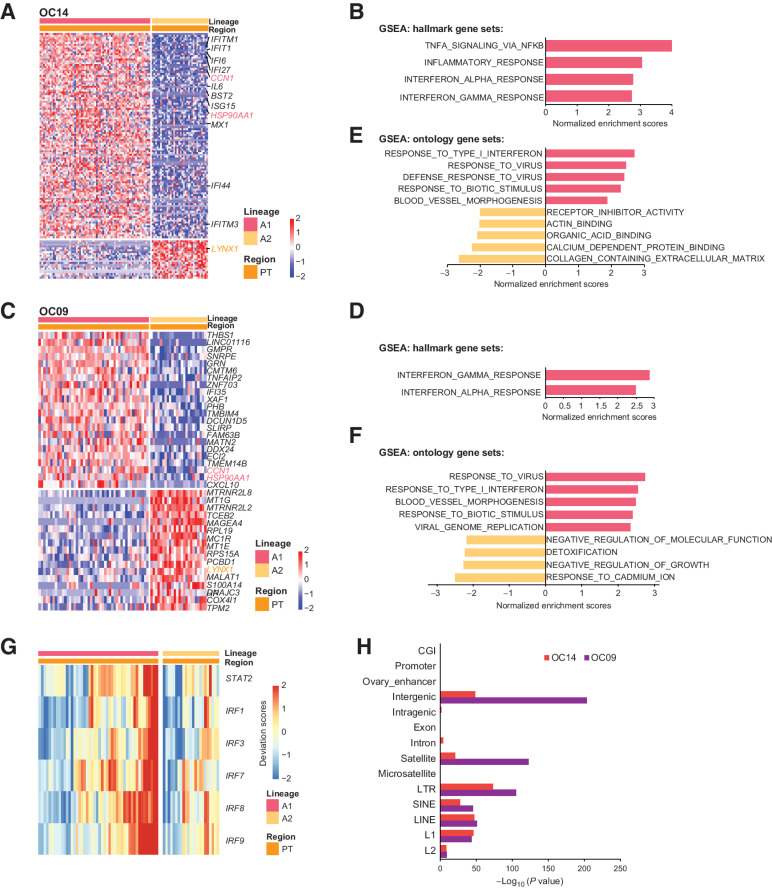
High-grade serous cancer (HGSC) is the most common subtype of ovarian cancer. HGSC is highly aggressive with poor patient outcomes, and a deeper understanding of HGSC tumorigenesis could help guide future treatment development. To systematically characterize the underlying pathologic mechanisms and intratumoral heterogeneity in human HGSC, we used an optimized single-cell multiomics sequencing technology to simultaneously analyze somatic copy-number alterations (SCNA), DNA methylation, chromatin accessibility, and transcriptome in individual cancer cells. Genes associated with interferon signaling, metallothioneins, and metabolism were commonly upregulated in ovarian cancer cells. Integrated multiomics analyses revealed that upregulation of interferon signaling and metallothioneins was influenced by both demethylation of their promoters and hypomethylation of satellites and LINE1, and potential key transcription factors regulating glycolysis using chromatin accessibility data were uncovered. In addition, gene expression and DNA methylation displayed similar patterns in matched primary and abdominal metastatic tumor cells of the same genetic lineage, suggesting that metastatic cells potentially preexist in the subclones of primary tumors. Finally, the lineages of cancer cells with higher residual DNA methylation levels and upregulated expression of CCN1 and HSP90AA1 presented greater metastatic potential. This study characterizes the critical genetic, epigenetic, and transcriptomic features and their mutual regulatory relationships in ovarian cancer, providing valuable resources for identifying new molecular mechanisms and potential therapeutic targets for HGSC.

Significance: Integrated analysis of multiomic changes and epigenetic regulation in high-grade serous ovarian cancer provides insights into the molecular characteristics of this disease, which could help improve diagnosis and treatment.


Figures

Figure 1. Identification of cancer cells and normal fallopian tube epithelial cells. A, The workflow diagram illustrates the sampling and analysis strategies. B, Uniform manifold approximation and projection (UMAP) plot of all single cells we sequenced. Colors indicate cell types (left), patients (middle), and sampling regions (right). LN, lymph node; RL, round ligament. C, Global SCNA patterns inferred from RNA data of single cells. Each row of the heatmap represents a single cell. The color bar on the left represents the patient origin of each single cell. D, The global SCNA patterns profiled by DNA methylome data of single cells at 1-M resolution (top) and schematic diagram of the evolutionary histories of genetic lineages during tumorigenesis (bottom) for OC09. Each row of the top panel represents a single cell. Each column represents a chromosome. The representative focal aberrations within chromosome arms used to define genetic lineages are marked. The global SCNA patterns of other patients were introduced in Supplementary Fig. S2.
Figure 1.
Identification of cancer cells and normal fallopian tube epithelial cells. A, The workflow diagram illustrates the sampling and analysis strategies. B, Uniform manifold approximation and projection (UMAP) plot of all single cells we sequenced. Colors indicate cell types (left), patients (middle), and sampling regions (right). LN, lymph node; RL, round ligament. C, Global SCNA patterns inferred from RNA data of single cells. Each row of the heatmap represents a single cell. The color bar on the left represents the patient origin of each single cell. D, The global SCNA patterns profiled by DNA methylome data of single cells at 1-M resolution (top) and schematic diagram of the evolutionary histories of genetic lineages during tumorigenesis (bottom) for OC09. Each row of the top panel represents a single cell. Each column represents a chromosome. The representative focal aberrations within chromosome arms used to define genetic lineages are marked. The global SCNA patterns of other patients were introduced in Supplementary Fig. S2.
Figure 2. Dynamic changes of RNA expression from normal FTE to primary tumors. A, Heatmap showing DEGs between normal FTE and primary tumor cells. Each row represents a DEG. The color bar at the top represents sampling regions and patient origins. B, The GO enrichment of DEGs. Red: upregulated genes in primary tumor cells; blue: downregulated genes in primary tumor cells. C and E, Scatterplots of the OXPHOS and glycolysis scores of cells in our study colored by sampling regions (C) and patients (E). The colors of patients are the same as A. D and F, 2D density plots of the OXPHOS and glycolysis scores of cells in our study (D) and patients in TCGA project (F). G, IHC determination of ISG15 expression in FTE, non-HGSC, and HGSC tumors. Scale bar, 40 μmol/L.
Figure 2.
Dynamic changes of RNA expression from normal FTE to primary tumors. A, Heatmap showing DEGs between normal FTE and primary tumor cells. Each row represents a DEG. The color bar at the top represents sampling regions and patient origins. B, The GO enrichment of DEGs. Red, upregulated genes in primary tumor cells; blue, downregulated genes in primary tumor cells. C and E, Scatterplots of the OXPHOS and glycolysis scores of cells in our study colored by sampling regions (C) and patients (E). The colors of patients are the same as A. D and F, 2D density plots of the OXPHOS and glycolysis scores of cells in our study (D) and patients in TCGA project (F). G, IHC determination of ISG15 expression in FTE, non-HGSC, and HGSC tumors. Scale bar, 40 μm.
Figure 3. The regulation of SCNAs and DNA methylation on RNA expression. A, The enrichment of chromosomes using 361 DEGs upregulated in primary tumors. B and C, GO enrichment (B) and survival analysis (C) using the 46 upregulated DEGs on chromosome 8. D, DNA methylation levels (1-kb tile) of satellites and LINE1. E and F, Top: venn plot showing the DEGs whose expression levels were correlated with the methylation levels of satellites and LINE1. E, Upregulated DEGs whose expression levels were negatively correlated with the methylation levels of satellites and LINE1. F, Downregulated DEGs whose expression levels were positively correlated with the methylation levels of satellites and LINE1. Bottom: the GO enrichment analysis of the genes which may potentially regulated by both of satellite and LINE1 methylation. G, Examples of genes derived from E. mRNA, the gene expression of the corresponding gene; WCG, the DNA methylation levels of satellites or LINE1. H, Examples of genes derived from F. I, Survival analysis of gene sets derived from E and F. The mean expression of selected genes from gene sets were used to group patients. J, The GO enrichment analysis of upregulated DEGs (left panel) and downregulated DEGs (right panel) whose expression levels were negatively correlated with their promoter methylation. PT, primary tumor. K, Genome browser view showing that a distal region (WCG7649168: chr14: 94,577,079-94,583,033) potentially regulated the expression of IFI27. The left bottom boxplot shows the expression of IFI27. The middle bottom panel shows the zoomed-in views of a known enhancer which is overlapped with WCG7649168 and the chromatin accessibility of corresponding locations. The right bottom boxplot shows the DNA methylation levels of WCG7649168. PT, primary tumor.
Figure 3.
The regulation of SCNAs and DNA methylation on RNA expression. A, The enrichment of chromosomes using 361 DEGs upregulated in primary tumors. B and C, GO enrichment (B) and survival analysis (C) using the 46 upregulated DEGs on chromosome 8. D, DNA methylation levels (1-kb tile) of satellites and LINE1. E and F, Top, Venn plot showing the DEGs whose expression levels were correlated with the methylation levels of satellites and LINE1. E, Upregulated DEGs whose expression levels were negatively correlated with the methylation levels of satellites and LINE1. F, Downregulated DEGs whose expression levels were positively correlated with the methylation levels of satellites and LINE1. Bottom, the GO enrichment analysis of the genes that may be potentially regulated by both of satellite and LINE1 methylation. G, Examples of genes derived from E. mRNA, the gene expression of the corresponding gene; WCG, the DNA methylation levels of satellites or LINE1. H, Examples of genes derived from F. I, Survival analysis of gene sets derived from E and F. The mean expression of selected genes from gene sets were used to group patients. J, The GO enrichment analysis of upregulated DEGs (left) and downregulated DEGs (right) whose expression levels were negatively correlated with their promoter methylation. K, Genome browser view showing that a distal region (WCG7649168: chr14: 94,577,079-94,583,033) potentially regulated the expression of IFI27. The left bottom boxplot shows the expression of IFI27. The middle bottom panel shows the zoomed-in views of a known enhancer, which is overlapped with WCG7649168 and the chromatin accessibility of corresponding locations. The right bottom boxplot shows the DNA methylation levels of WCG7649168. PT, primary tumor.
Figure 4. Characteristics of chromatin accessibility in HGSC. A, Chromatin accessibility of the whole genome in cancer cells and FTE cells. B, Normalized chromatin accessibility around TSS (±7 kb) in different patients. Each line is colored by different patient, which is the same as the colors in B. C, The number and length of NDRs in FTE and cancer cells, colored by patients. D, The normalized GCH levels of different genomic elements. E, Heatmap representing chromVAR bias-corrected deviations of the TFs whose binding motif presented different accessibility across FTE cells and primary tumor cells. F, Scatterplot showing the TFs whose binding motifs exhibit different deviation scores predicted by chromVAR and may regulate the DEGs inferred by Lisa. Top: TFs were more active in primary tumor cells and its target genes were upregulated in primary tumor cells. Bottom: TFs were more inert in primary tumor cells and its target genes were downregulated in primary tumor cells. The colors of the dots represent the fold changes of the expression in cancer cells and FTE cells.
Figure 4.
Characteristics of chromatin accessibility in HGSC. A, Chromatin accessibility of the whole genome in cancer cells and FTE cells. B, Normalized chromatin accessibility around TSS (±7 kb) in different patients. Each line is colored by different patient, which is the same as the colors in C. C, The number and length of NDRs in FTE and cancer cells, colored by patients. D, The normalized GCH levels of different genomic elements. E, Heatmap representing chromVAR bias-corrected deviations of the TFs whose binding motif presented different accessibility across FTE cells and primary tumor cells. F, Scatterplot showing the TFs whose binding motifs exhibit different deviation scores predicted by chromVAR and may regulate the DEGs inferred by Lisa. Top, TFs were more active in primary tumor cells and its target genes were upregulated in primary tumor cells. Bottom, TFs were more inert in primary tumor cells and its target genes were downregulated in primary tumor cells. The colors of the dots represent the fold changes of the expression in cancer cells and FTE cells.
Figure 5. Dynamic changes of RNA expression from primary tumors to metastases. A, UpSet plot visualization of the DEGs between primary tumors and matched metastases. Left: genes upregulated in metastases; right: genes downregulated in metastases. B, Shared nearest neighbor (SNN) clustering of cancer cells of patients with metastases based on RNA expression. C and F, Western blot analysis to verify the overexpression of HSPA6 in SKOV3 cells (C) and ES2 cells (F; *, P < 0.05; **, P < 0.01; ***, P < 0.001; ****, P < 0.0001). D and G, The migration and invasion ability of SKOV3 cells (D) and ES2 cells (G) after HSPA6 overexpression were assessed by transwell assay. Scale bar, 100 μmol/L (*, P < 0.05; **, P < 0.01; ***, P < 0.001; ****, P < 0.0001). E, The migration ability of SKOV3 cells after HSPA6 overexpression was assessed by wound healing assay. Scale bar, 200 μmol/L (**, P < 0.01).
Figure 5.
Dynamic changes of RNA expression from primary tumors to metastases. A, UpSet plot visualization of the DEGs between primary tumors and matched metastases. Left, genes upregulated in metastases; right, genes downregulated in metastases. B, Shared nearest neighbor (SNN) clustering of cancer cells of patients with metastases based on RNA expression. C and F, Western blot analysis to verify the overexpression of HSPA6 in SKOV3 cells (C) and ES2 cells (F). D and G, The migration and invasion ability of SKOV3 cells (D) and ES2 cells (G) after HSPA6 overexpression was assessed by transwell assay. Scale bar, 100 μm. E, The migration ability of SKOV3 cells after HSPA6 overexpression was assessed by wound healing assay. Scale bar, 200 μm. ***, P < 0.001; ****, P < 0.0001.
Figure 6. Dynamic changes of DNA methylation from primary tumors to metastases. A, Single-cell global DNA methylation levels of primary tumor cells and matched metastases within the same lineage. Each point represents a single cell, colored by genetic lineages. The lines at the bottom, middle, and top represent 25%ile, median, and 75%ile values, respectively. “Pri_tum” and “Met” represent primary tumor and metastasis, respectively. B, Clustering of cancer cells based on DNA methylation for OC09 and OC14, colored by genetic lineages (left) and sampling regions (right). Pri_tum, primary tumor; Met_LN, lymph node metastasis; Met_Ome, omental metastasis.
Figure 6.
Dynamic changes of DNA methylation from primary tumors to metastases. A, Single-cell global DNA methylation levels of primary tumor cells and matched metastases within the same lineage. Each point represents a single cell, colored by genetic lineages. The lines at the bottom, middle, and top represent 25 percentile, median, and 75%ile values, respectively. “Pri_tum” and “Met” represent primary tumor and metastasis, respectively. B, Clustering of cancer cells based on DNA methylation for OC09 and OC14, colored by genetic lineages (left) and sampling regions (right). Pri_tum, primary tumor; Met_LN, lymph node metastasis; Met_Ome, omental metastasis.
Figure 7. Intratumor heterogeneities of primary tumors reveal key genes involved in the metastasis. A, Venn plot showing the number of DEGs between lineage A1 and lineage A2 for OC09 and OC14. Left: upregulated genes in lineage A1; right: upregulated genes in lineage A2. B, Western blot analysis to verify the knockout of CCN1 in SKOV3 cells. C, The migration of SKOV3 cells knocked out of CCN1 was detected by wound healing assay, which was compared with the cells treated with the nontarget gRNA (*, P < 0.05; **, P < 0.01). D, The migration and invasion of SKOV3 cells after CCN1 knockout were assessed by transwell assay. Scale bar, 100 μmol/L (***, P < 0.001; ****, P < 0.0001). E, The migration of SKOV3 cells treated with the indicated concentrations of TAS-116 was evaluated using wound healing assay (*, P < 0.05; **, P < 0.01; ***, P < 0.001; ****, P < 0.0001). F and G, The migration and invasion of SKOV3 cells treated with the indicated concentrations of TAS-116 were assessed by transwell assay. Scale bar, 100 μmol/L (**, P < 0.01; ***, P < 0.001; ****, P < 0.0001). H, The cell viability of SKOV3 cells treated with the indicated concentrations of TAS-116 for 24, 48, and 72 hours.
Figure 7.
Intratumor heterogeneities of primary tumors reveal key genes involved in the metastasis. A, Venn plot showing the number of DEGs between lineage A1 and lineage A2 for OC09 and OC14. Left, upregulated genes in lineage A1; right, upregulated genes in lineage A2. B, Western blot analysis to verify the knockout of CCN1 in SKOV3 cells. C, The migration of SKOV3 cells knocked out of CCN1 was detected by wound healing assay, which was compared with the cells treated with the nontarget gRNA. D, The migration and invasion of SKOV3 cells after CCN1 knockout were assessed by transwell assay. Scale bar, 100 μm. E, The migration of SKOV3 cells treated with the indicated concentrations of TAS-116 was evaluated using wound healing assay. F and G, The migration and invasion of SKOV3 cells treated with the indicated concentrations of TAS-116 were assessed by transwell assay. Scale bar, 100 μm. H, The cell viability of SKOV3 cells treated with the indicated concentrations of TAS-116 for 24, 48, and 72 hours. *, P < 0.05; **, P < 0.01; ***, P < 0.001; ****, P < 0.0001.
Figure 8. Intratumor heterogeneities of primary tumors reveal critical pathways involved in the metastasis. A and C, Heatmaps of DEGs between primary tumor cells of lineage A1 and lineage A2 for OC14 (A) and OC09 (C). B and D, GSEA analysis for OC14 (B) and OC09 (D) showing the enriched pathways of lineage A1 using hallmark gene sets. E and F, GSEA analysis for OC14 (E) and OC09 (F) showing the enriched pathways of lineage A1 using ontology gene sets. G, Heat map showing that the binding motifs of TFs involved in interferon responses is more open in lineage A1 than lineage A2 for OC09. H, Enrichment analysis of annotated genomic elements on hypomethylated tiles in lineage A2 compared with lineage A1.
Figure 8.
Intratumor heterogeneities of primary tumors reveal critical pathways involved in the metastasis. A and C, Heatmaps of DEGs between primary tumor cells of lineage A1 and lineage A2 for OC14 (A) and OC09 (C). B and D, GSEA analysis for OC14 (B) and OC09 (D) showing the enriched pathways of lineage A1 using hallmark gene sets. E and F, GSEA analysis for OC14 (E) and OC09 (F) showing the enriched pathways of lineage A1 using ontology gene sets. G, Heat map showing that the binding motifs of TFs involved in interferon responses is more open in lineage A1 than lineage A2 for OC09. H, Enrichment analysis of annotated genomic elements on hypomethylated tiles in lineage A2 compared with lineage A1.

Similar articles

Cited by

References

    1. Torre LA, Trabert B, DeSantis CE, Miller KD, Samimi G, Runowicz CD, et al. . Ovarian cancer statistics, 2018. CA Cancer J Clin 2018;68:284–96. - PMC - PubMed
    1. Kim S, Han Y, Kim SI, Kim H-S, Kim SJ, Song YS. Tumor evolution and chemoresistance in ovarian cancer. NPJ Precis Oncol 2018;2:20. - PMC - PubMed
    1. Bashashati A, Ha G, Tone A, Ding J, Prentice LM, Roth A, et al. . Distinct evolutionary trajectories of primary high-grade serous ovarian cancers revealed through spatial mutational profiling. J Pathol 2013;231:21–34. - PMC - PubMed
    1. Network CGAR. Integrated genomic analyses of ovarian carcinoma. Nature 2011;474:609. - PMC - PubMed
    1. Verhaak RG, Tamayo P, Yang J-Y, Hubbard D, Zhang H, Creighton CJ, et al. . Prognostically relevant gene signatures of high-grade serous ovarian carcinoma. J Clin Invest 2013;123:517–25. - PMC - PubMed

Publication types