

Bipolar-associated miR-499-5p controls neuroplasticity by downregulating the Cav1.2 subunit CACNB2
- PMID: 35969184
- PMCID: PMC9535808
- DOI: 10.15252/embr.202154420
Bipolar-associated miR-499-5p controls neuroplasticity by downregulating the Cav1.2 subunit CACNB2
Abstract
Bipolar disorder (BD) is a chronic mood disorder characterized by manic and depressive episodes. Dysregulation of neuroplasticity and calcium homeostasis are frequently observed in BD patients, but the underlying molecular mechanisms are largely unknown. Here, we show that miR-499-5p regulates dendritogenesis and cognitive function by downregulating the BD risk gene CACNB2. miR-499-5p expression is increased in peripheral blood of BD patients, as well as in the hippocampus of rats which underwent juvenile social isolation. In rat hippocampal neurons, miR-499-5p impairs dendritogenesis and reduces surface expression and activity of the L-type calcium channel Cav1.2. We further identified CACNB2, which encodes a regulatory β-subunit of Cav1.2, as a direct functional target of miR-499-5p in neurons. miR-499-5p overexpression in the hippocampus in vivo induces short-term memory impairments selectively in rats haploinsufficient for the Cav1.2 pore forming subunit Cacna1c. In humans, miR-499-5p expression is negatively associated with gray matter volumes of the left superior temporal gyrus, a region implicated in auditory and emotional processing. We propose that stress-induced miR-499-5p overexpression contributes to dendritic impairments, deregulated calcium homeostasis, and neurocognitive dysfunction in BD.
Keywords: bipolar disorder; calcium channel; cognitive function; microRNA; neuroplasticity.
© 2022 The Authors. Published under the terms of the CC BY 4.0 license.
Figures
- A
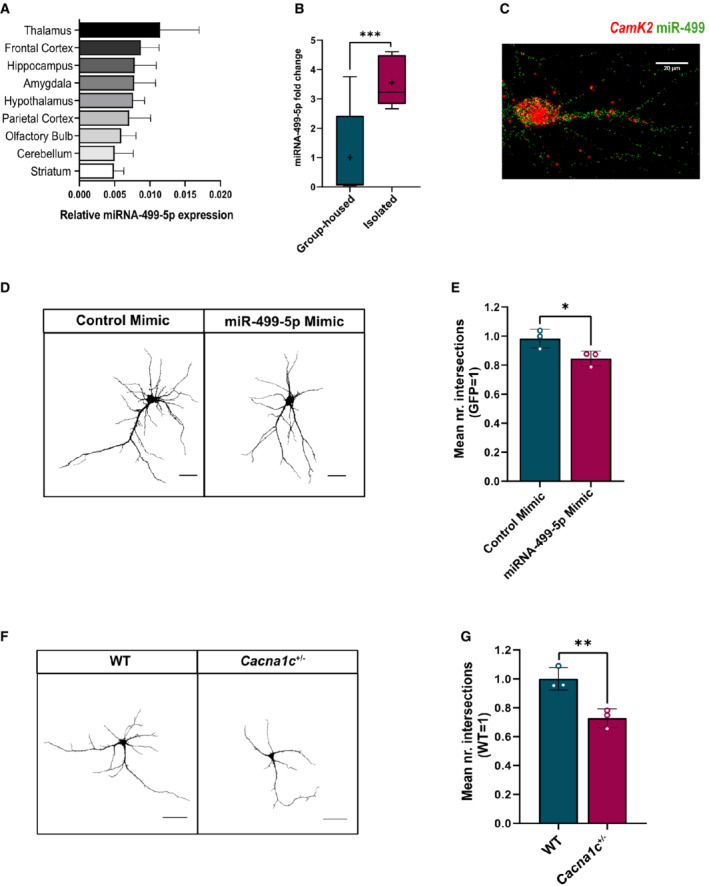
miR‐499‐5p qPCR analysis using total RNA isolated from different areas of the adult female rat brain. U6 snRNA was used for normalization. Data are represented as bar graphs, mean ± SD (n = 3 animals).
- B
miR‐499‐5p qPCR analysis using total RNA isolated from the hippocampus of male rats that were either group‐housed or socially isolated for 4 weeks postweaning. Data are represented as box plot with whiskers (+: mean, line: median; whiskers: Tukey) (n = 9 rats per group; Mann–Whitney U‐test; ***P = 0.0008). Fold changes represent changes in gene expression relative to the control condition. U6 snRNA was used for normalization.
- C
Representative picture of single‐molecule fluorescence in situ hybridization (smFISH) performed in rat hippocampal neurons at DIV7 using probes directed against miR‐499‐5p (red channel) and CamK2a (green channel) to identify excitatory neurons. Scale bar: 20 mm.
- D
Representative gray‐scale images of primary rat hippocampal neurons (DIV 10) transfected with GFP and the indicated miRNA mimics. Scale bars: 50 μm.
- E
Quantification of the mean number of intersections by Sholl analysis. GFP‐only transfected conditions were set to one in each experiment. Data are represented as scattered dot plots with bar, mean ± SD (n = 3; Unpaired two‐sample t‐test, *P = 0.0435).
- F
Representative gray‐scale images of GFP‐transfected Cacna1c +/+ (WT) or Cacna1c +/− primary rat hippocampal neurons (DIV 10). Scale bars = 50 μm.
- G
Quantification of the mean number of intersections by Sholl analysis. Data are represented as scattered dot plots with bar, mean ± SD (n = 3 independent experiments; Unpaired two‐sample t‐test, **P = 0.0096). Fold changes represent changes in dendritic complexity relative to the control condition.
- A
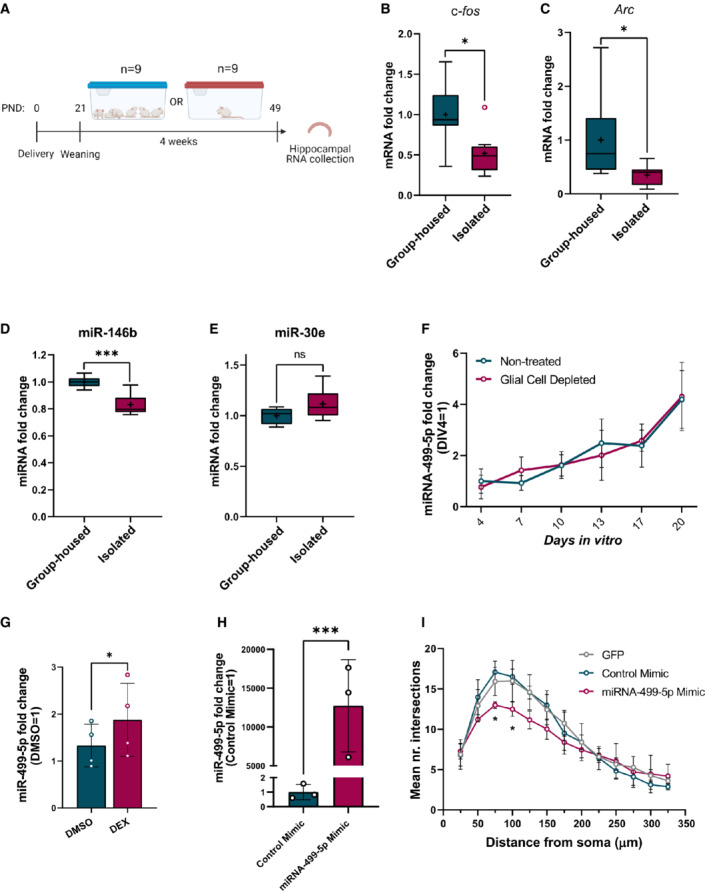
Schematic representation of juvenile social isolation (JSI) experiment.
- B–E
qPCR analysis for c‐fos (B), arc (C), miR‐146b (D), and miR‐30e‐5p (E) using total RNA isolated from the hippocampus of male rats that were either group‐housed or socially isolated for 4 weeks postweaning (n = 9 rats per group). Data are represented as box plot with whiskers (+: mean, line: median; whiskers: Tukey) (*P = 0.0207 (c‐fos), *P = 0.0207 (arc); ***P = 0.0006 (miR‐146‐5p); P = 0.1049 (miR‐30e‐5p); Mann–Whitney U‐test). Fold changes represent changes in gene expression relative to the control condition. U6 snRNA was used for normalization. ns = not significant.
- F
Relative expression of miR‐499‐5p in primary hippocampal neurons at different DIVs (n = 3 independent experiments). Total RNA was obtained from nontreated developing hippocampal neurons or treated from DIV 3 with FUDR to stop the proliferation of nonneuronal glial cells at the six indicated time points. Fold changes represent changes in miR‐499‐5p expression relative to DIV 4. Data are represented on XY graph as mean ± SD.
- G
Relative expression of miR‐499‐5p is significantly induced in hippocampal neurons treated with DEX compared to DMSO‐treated neurons (n = 4; Paired two‐sample t‐test, *P = 0.0462). Data are represented as scattered dot plots with bar, mean ± SD. Fold change represents changes in miR‐499‐5p expression of DEX‐treated neurons relative to DMSO‐treated neurons.
- H
Relative expression of miR‐499‐5p is significantly induced in hippocampal neurons transfected with miR‐499‐5p mimics (n = 3 independent experiments; Ratio paired t‐test, ***P = 0.003). Data are represented as scattered dot plots with bar, mean ± SD. Fold change represents changes in miR‐499‐5p expression of miR‐499‐5p mimic transfected‐neurons relative to control mimic‐transfected‐neurons.
- I
Mean of the Sholl profile averages from biological replicates of Fig 1D and E. Data are represented on XY graph as mean ± SD. *P < 0.05.
- A
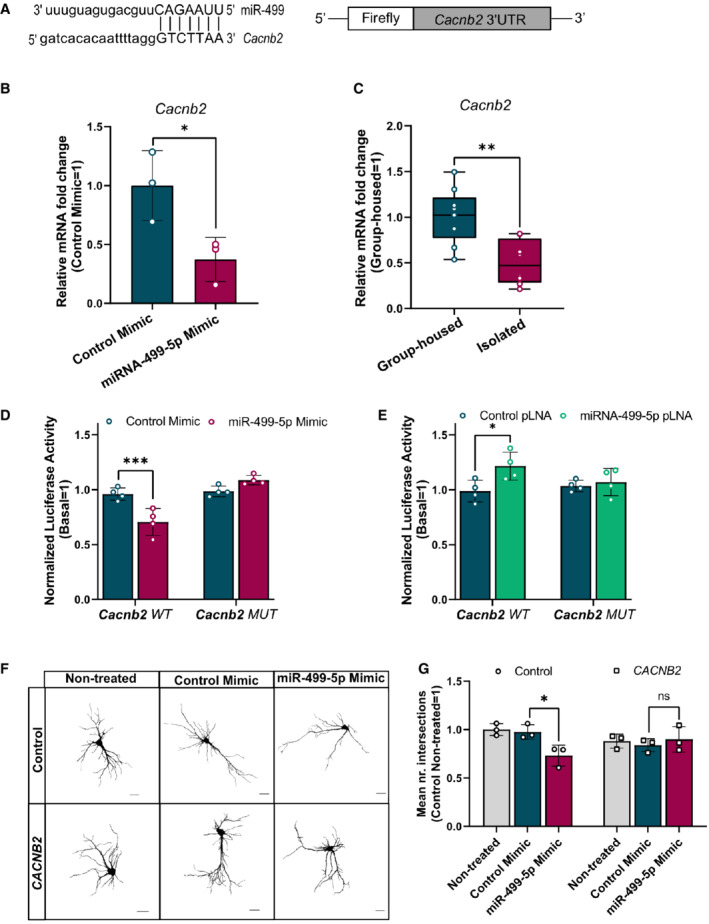
Nucleotide base pairing of miR‐499‐5p with Cacnb2 3′UTR (left) and schematic representation of the Cacnb2 luciferase reporter (right).
- B
qPCR analysis of Cacnb2 mRNA levels using total RNA isolated from rat hippocampal neurons transfected with either a control or miR‐499‐5p mimic. Data are represented as scattered dot plots with bar, mean ± SD (n = 3 independent experiments; Unpaired two‐sample t‐test, *P = 0.0363).
- C
qPCR analysis of Cacnb2 mRNA levels using total RNA from the hippocampus of either socially isolated or group‐housed rats. Data are represented as box plot with whiskers (+: mean, line: median; whiskers: Tukey) (n = 9 rats per group; Unpaired two‐sample t‐test, **P = 0.0020).
- D
Relative luciferase activity of rat hippocampal neurons transfected with the indicated miRNA mimics and expressing either a Cacnb2 WT or MUT reporter. Data are represented as scattered dot plots with bar, mean ± SD (n = 4 independent experiments; Two‐way ANOVA: main effect of the miRNA mimic P = 0.0087, of the Cacnb2 luciferase reporter P < 0.0001 and of the miRNA mimic by Cacnb2 luciferase reporter interaction P < 0.0001, Tukey's HSD: ***P = 0.0002).
- E
Relative luciferase activity of rat hippocampal neurons transfected with the indicated pLNAs and expressing either a Cacnb2 WT or MUT reporter. Data are represented as scattered dot plots with bar, mean ± SD (n = 4 independent experiments; Two‐way ANOVA: main effect of the miRNA pLNA P = 0.0061, no main effect of the Cacnb2 luciferase reporter P = 0.3590 or the miRNA pLNA by Cacnb2 luciferase reporter P = 0.0910, Tukey's HSD: *P = 0.0152). Fold changes represent changes in relative luciferase activity of transfected neurons relative to the nontransfected neurons.
- F
Representative images of DIV 10 hippocampal neurons co‐transfected with control or miR‐499‐5p mimics and a pMT2‐CACNB2 expression plasmid (CACNB2). Scale bars = 50 μm.
- G
Quantification of the mean number of intersections by Sholl analysis. Data are represented as scattered dot plots with bar, mean ± SD (n = 3 independent experiments; Two‐way ANOVA: no main effect of the CACNB2 transfection P = 0.5027 or the miRNA mimics P = 0.0805, main effect of the CACBN2 transfection by miRNA mimics interaction P = 0.0213, Tukey's HSD: *P = 0.0303). Fold changes represent the changes in dendritic complexity of transfected neurons compared to nontreated control neurons. ns = not significant.
- A
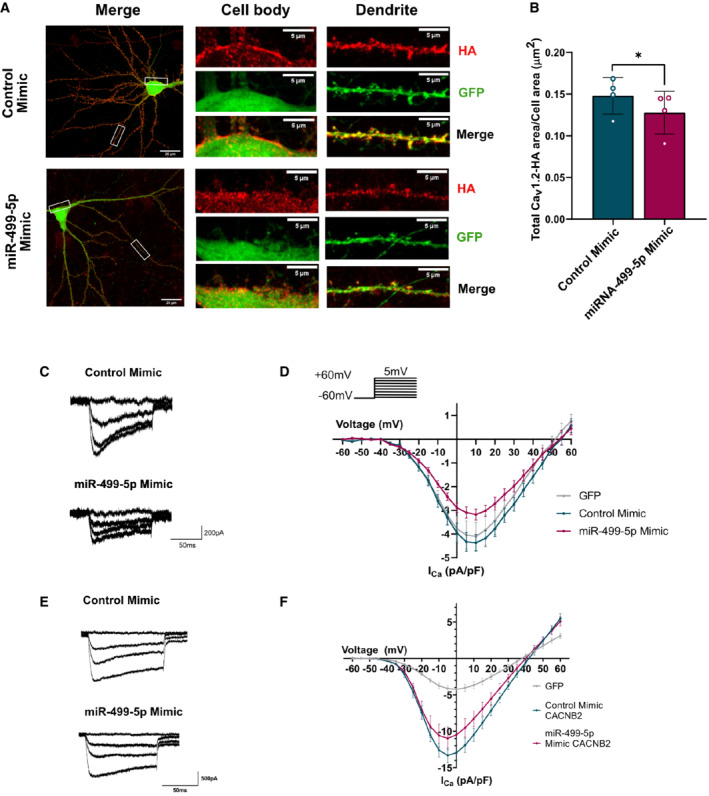
Representative images of DIV 19 rat hippocampal neurons co‐transfected with GFP (green channel) and Cav1.2‐HA (red channel), together with either control or miR‐499‐5p mimics. After 12–13 days of expression, labeling with Anti‐HA antibodies was performed in live conditions to identify cell surface Cav1.2 channels. Whole cells: scale bars = 20 μm; cell body and dendrite insets: scale bars = 5 μm.
- B
Quantification of the area occupied by surface Cav1.2 fluorescence normalized to the total cell area (GFP fluorescence) from nonpermeabilized neurons transfected as in (A). Data are represented as scattered dot plots with bar, mean ± SD (n = 4 independent experiments; Paired two‐sample t‐test *P = 0.0318).
- C
Representative calcium current traces from neurons transfected with the indicated miRNA mimics.
- D
I/V curves (current density against voltage) of calcium peak currents from hippocampal neurons co‐transfected with GFP (n = 9 cells) and the Control (n = 10 cells) or miR‐499‐5p mimic (n = 10 cells) (P = 0.0188 for miR‐499‐5p mimic vs. Control mimic between −10 and + 30 mV, Unpaired two‐sample t‐test). Data are represented on XY graph as mean ± SEM.
- E
Representative calcium current traces from neurons transfected with the indicated miRNA mimics and pMT2‐Cacnb2.
- F
I/V curves (current density against voltage) of calcium peak currents from hippocampal neurons co‐transfected with GFP (n = 11 cells) and pMT2‐Cacnb2 with the Control (n = 11 cells) or with miR‐499‐5p mimic (n = 12 cells) (n.s. P = 0.5379 for miR‐499‐5p mimic vs. Control mimic between −60 and + 60 mV, Unpaired two‐sample t‐test). Data are represented on XY graph as mean ± SEM.
- A
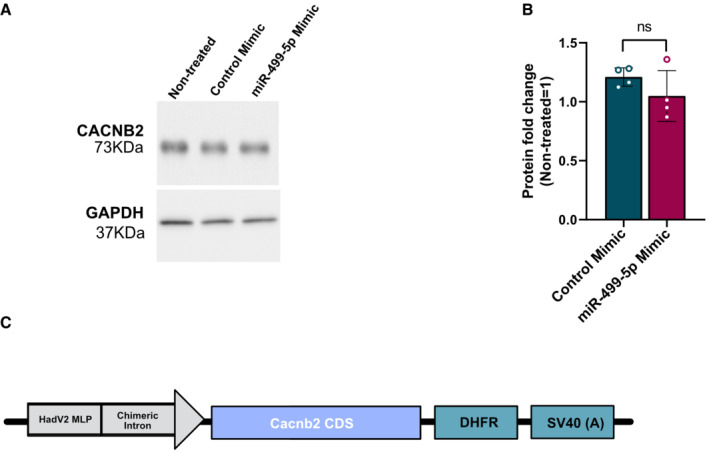
Representative western blot image of CACNB2 (upper panel) and GAPDH (lower panel) protein expression levels in hippocampal neurons (DIV14) that were transfected with the miR‐499‐5p mimic or with the control mimic at DIV 7. GAPDH was used as a loading control.
- B
Western blot analysis showed that miR‐499‐5p overexpression did not significantly change the CACNB2 expression compared to neurons expressing the control mimic (n = 4 independent experiments; Unpaired two‐sample t‐test, P = 0.2094). Data are represented as scattered dot plots with bar, mean ± SD.
- C
Schematic illustration of the pMT2‐Cacnb2 overexpressing construct (hadV2 MLP: HadV2 Major Late Promoter; Cacnb2 CDS: Cacnb2 Coding Sequence; DHFR: mouse Dihydrofolate reductase).
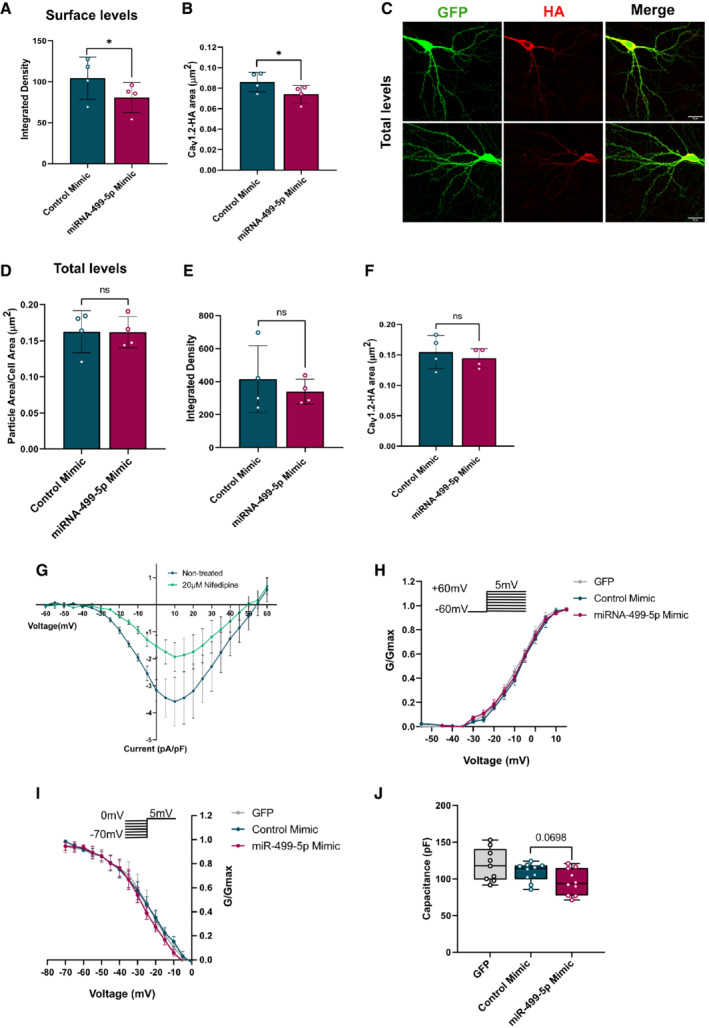
- A, B
Quantification of the total levels of Cav1.2 channels of live‐stained neurons transfected as in 3A. Neurons transfected with miR‐499‐5p mimic showed significant reductions in (A) the integrated density of surface Cav1.2‐HA (n = 4; Paired two‐sample t‐test *P = 0.0385) and (B) the area of surface Cav1.2‐HA (n = 4 independent experiments; Paired two‐sample t‐test *P = 0.0381). Data are represented as scattered dot plots with bar, mean ± SD.
- C
Representative images of DIV 19 rat hippocampal neurons co‐transfected with GFP (green channel) and Cav1.2‐HA (red channel), together with either control or miR‐499‐5p mimics. After 12–13 days of expression, labeling with Anti‐HA antibodies was performed under permeabilized conditions to identify total levels of Cav1.2 channels. Scale bars = 20 μm.
- D–F
Quantification of the total levels of Cav1.2 channels of permeabilized neurons transfected as in Fig EV3C. No significant changes were found for (D) the total levels of Cav1.2 (n = 4 independent experiments; Paired two‐sample t‐test, P = 0.9776), (E) the integrated density (n = 4 independent experiments; Paired two‐sample t‐test, P = 0.3213), (F) the area (n = 4 independent experiments; Paired two‐sample t‐test, P = 0.3182) of total Cav1.2 channels. Data are represented as scattered dot plots with bar, mean ± SD.
- G
I/V curves before and after bath application with the LVGCC blocker Nifedipine (20 μM) (n = 3 cells nontreated vs. n = 3 cells treated with 20 μM Nifedipine). Data are represented on XY graph as mean ± SEM.
- H
Hippocampal neurons transfected with the miR‐499‐5p mimic did not show a different activation curve compared to the activation curves of cells transfected with the Control mimic or GFP alone (GFP: n = 9; NC mimic: n = 10, miR‐499‐5p mimic: n = 10). Data are represented on XY graph as mean ± SEM.
- I
Hippocampal neurons overexpressing miR‐499‐5p did not show a different inactivation curve compared to the inactivation curves of control cells (GFP: n = 9; NC mimic: n = 10, miR‐499‐5p mimic: n = 10). Data are represented on XY graph as mean ± SEM.
- J
MiR‐499‐5p overexpression tended to decrease capacitance (GFP: n = 9; NC mimic: n = 10, miR‐499‐5p mimic: n = 10; Unpaired two‐sample t‐test, P = 0.0698). Data are represented as box plot with whiskers and data points (line: median; whiskers: minimum and maximum values).
- A
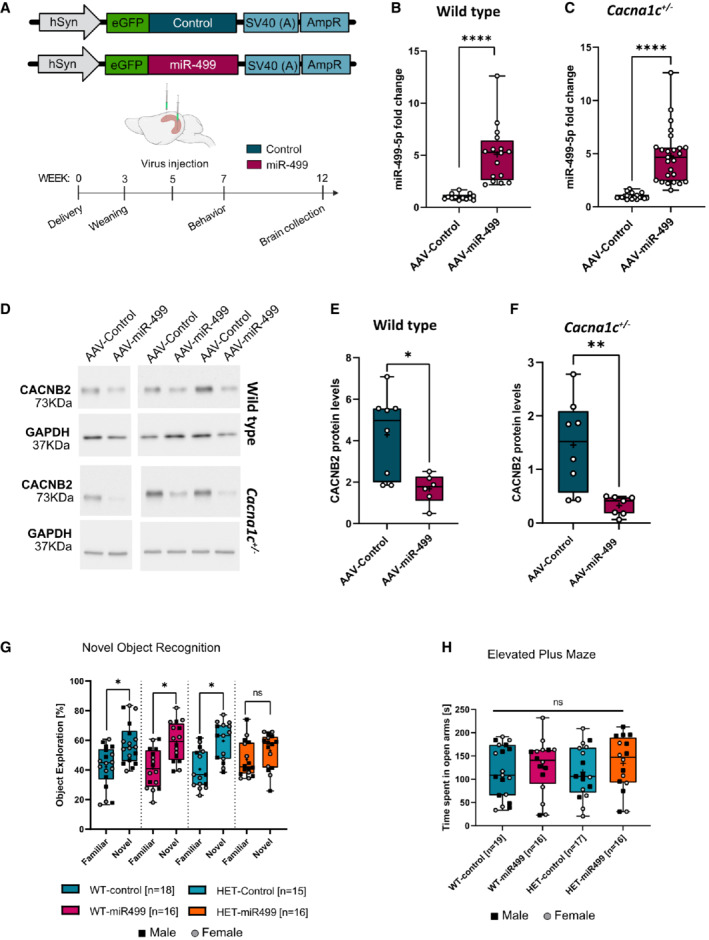
Schematic illustration of the hSyn‐eGFP‐scramble control (AAV‐Control) and hSyn‐eGFP‐chimeric miR‐499‐5p hairpin (AAV‐miR‐499), and timeline of virus infection experiments.
- B
miR‐499‐5p qPCR analysis from total RNA isolated from the right hippocampus of wild type rats injected with either AAV‐control or AAV‐miR‐499. Data are represented as box plot with whiskers and data points (+: mean, line: median; whiskers: minimum and maximum values) (****P < 0.0001, Unpaired two‐sample t‐test; n = 18 rats in the AAV‐Control group, n = 16 rats in the AAV‐miR‐499 group).
- C
miR‐499‐5p qPCR analysis from total RNA isolated from the right hippocampus of Cacna1c+/− rats injected with either AAV‐control or AAV‐miR‐499. Data are represented as box plot with whiskers and data points (+: mean, line: median; whiskers: minimum and maximum values) (****P < 0.0001, Unpaired two‐sample t‐test; n = 15 rats in the AAV‐Control group, n = 16 rats in the AAV‐miR‐499 group).
- D
Representative Western blot images of CACNB2 (upper panel) and GAPDH (lower panel) protein expression levels in the hippocampus of WT rats and Cacna1c+/− rats injected with the AAV‐Control or AAV‐miR‐499 hairpin viruses. GAPDH was used as a loading control.
- E
Quantification of CACNB2 Western blots using hippocampal protein lysate from wild‐type rats injected with either AAV‐control or AAV‐miR‐499. Data are represented as box plot with whiskers and data points (+: mean, line: median; whiskers: minimum and maximum values) (*P = 0.0103, Unpaired two‐sample t‐test; n = 7 rats in the AAV‐Control group, n = 6 rats in the AAV‐miR‐499 group).
- F
Quantification of CACNB2 Western blots using hippocampal protein lysate from Cacna1c+/− rats injected with either AAV‐control or AAV‐miR‐499. Data are represented as box plot with whiskers and data points (+: mean, line: median; whiskers: minimum and maximum values) (**P = 0.0044, Unpaired two‐sample t‐test; n = 8 rats in the AAV‐Control group, n = 7 rats in the AAV‐miR‐499 group).
- G
Novel object recognition task. Percentage of time WT or Cacna1c +/− rats injected with the indicated AAV explored either the familiar or novel object. Data are represented as box plot with whiskers and data points (+: mean, line: median; whiskers: minimum and maximum values) (WT_Control: n = 18 (eight males, 10 females); WT_miR‐499: n = 16 (seven males, nine females); Cacna1c +/−_Control: n = 15 (five males, 10 females); Cacna1c +/−_miR‐499: n = 16 (10 males, six females). Paired t‐test – novel versus familiar object exploration percentage: WT_Control: T 17 = 2.383, P = 0.029*; WT_miR‐499: T 15 = 2.734, P = 0.015*; Cacna1c +/−_Control: T 14 = 2.849, P = 0.013*; Cacna1c +/−_miR‐499: T 15 = 0.960, P = 0.352).
- H
Elevated plus maze test. Time spent in open arms did not differ between genotypes and treatment groups. Data are represented as box plot with whiskers and data points (+: mean, line: median; whiskers: minimum and maximum values) (One‐way ANOVA; WT_Control: n = 19 (nine males, 10 females); WT_miR‐499: n = 16 (seven males, nine females); Cacna1c +/−_Control: n = 17 (seven males, 10 females); Cacna1c +/−_miR‐499: n = 16 (10 males, six females). Main effect Genotype: F 1, 64 = 0.044, P = 0.834; main effect Treatment: F 1, 64 = 1.171, P = 0.283; Interaction Genotype × Treatment: F 1, 64 = 0.076, P = 0.784).
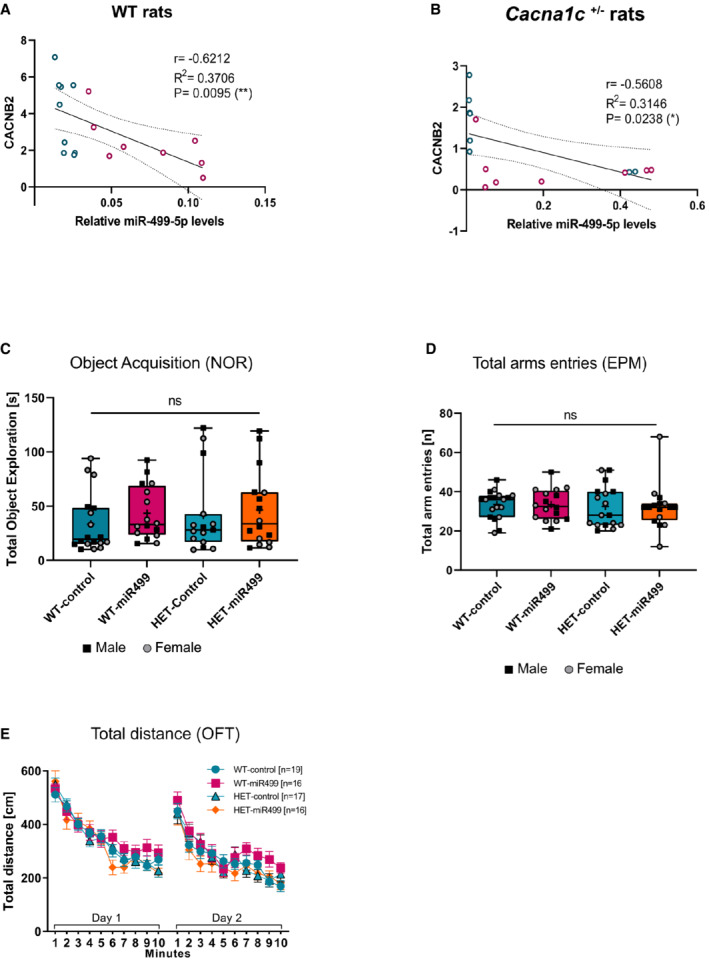
- A, B
Significant negative correlation between relative miR‐499‐5p expression and CACNB2 protein levels in the hippocampus of WT (A) and Cacna1c+/− rats (B) injected with AAV‐Control (red) and AAV‐miR‐499 (blue). Spearman correlation coefficient with two‐tailed analysis is provided in the legend.
- C
Object acquisition task. Total time (seconds) WT or Cacna1c +/− rats injected with the indicated AAV spent exploring the objects. Data are presented as box and whisker plot with median, mean, and minimum and maximum values. ns: not significant, one‐way ANOVA; WT_Control: n = 18 (eight males, 10 females); WT_miR‐499: n = 16 (seven males, nine females); Cacna1c +/−_Control: n = 15 (five males, 10 females); Cacna1c +/−_miR‐499: n = 16 (10 males, six females). Main effect Genotype: F 1, 61 = 0.501, P = 0.482; main effect Treatment: F 1, 61 = 0.929, P = 0.339; Interaction Genotype × Treatment: F 1, 61 = 0.098, P = 0.756.
- D
Total arms entries during Elevated Plus Maze test did not differ between genotypes and treatment groups (as in Fig 4H). Data are presented as box and whisker plot with median, mean, and minimum and maximum values. Ns: not significant, one‐way ANOVA. Main effect Genotype: F 1, 64 = 0.257, P = 0.614, main effect Treatment: F 1, 64 = 0.007, P = 0.934, interaction Genotype × Treatment: F 1, 64 = 0.005, P = 0.946.
- E
Open field test. Total distance traveled (cm) by WT or Cacna1c +/− rats injected with the indicated AAV over a time course of 10 min on 2 consecutive days. Data are presented as means ± SD. Repeated measures ANOVA; WT_Control: n = 19 (nine males, 10 females); WT_miR‐499: n = 16 (seven males, nine females); Cacna1c +/−_Control: n = 17 (seven males, 10 females); Cacna1c +/−_miR‐499: n = 16 (10 males, six females). Main effect Genotype: P = 0.138; main effect Treatment: P = 0.672; interaction Genotype × Treatment: P = 0.124.
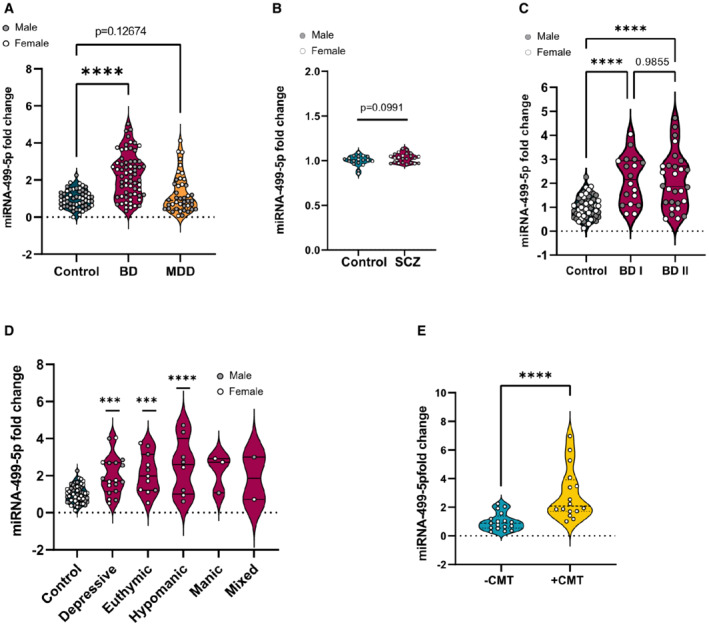
- A
miR‐499‐5p qPCR analysis of total RNA isolated from PBMCs of control (female = 26, male = 31), BD (female = 26, male = 37), or MDD (female = 18, male = 24) subjects. Wilcoxon rank sum test after correction for age and antidepressant treatment (linear model of the form Fold Change ~ Group*Sex + Age + Antidepressant treatment). Two‐way ANOVA with correction for sex, age, and antidepressant treatment (linear model of the form Fold Change ~ Group*Sex + Age + Antidepressant treatment). Control versus BD: ****P = 8.89e‐07; control versus MDD: n.s. P = 0.12674. Data are presented as violin plots with median, quartiles, and data points.
- B
miR‐499‐5p qPCR analysis of total RNA isolated from PBMCs of control (female = 8, male = 10) and SZ (female = 8, male = 15) subjects. Two‐way ANOVA, Main effect Sex: P = 0.9785; main effect Group: P = 0.0924; main effect Interaction: P = 0.9802. Tukey's HSD: P = 0.0924, ns. Data are presented as violin plots with median, quartiles, and data points.
- C
miR‐499‐5p qPCR analysis of total RNA isolated from PBMCs of control (female = 26, male = 31), BD I (female = 9, male = 9), or BDI II (female = 12, male = 16) subjects. Two‐way ANOVA, Main effect Sex: P = 0.174; main effect Group: ****P = 4.07e‐09; Interaction Group × Sex: P = 0.311. Tukey's HSD: control versus BDI: ****P = 0.0000037, Control versus BDII: P = 0.0000002. Data are presented as violin plots with median, quartiles, and data points.
- D
miR‐499‐5p qPCR analysis of total RNA isolated from PBMCs of control subjects (female = 26, male = 31), and BD subjects in different mood states (depressive (female = 7, male = 11), euthymic (female = 7, male = 4), hypomanic (female = 2, male = 6), manic (female = 2, male = 1), mixed (female = 1, male = 1). Two‐way ANOVA, main effect Sex: P = 0.260; main effect Group: P = 1.26e‐07; Interaction Group × Sex: P = 0.059; Tukey's HSD: control versus depressive ***P = 0.0002621, control versus euthymic ***P = 0.0008533, control versus hypomanic ****P = 0.0000470. Data are presented as violin plots with median, quartiles, and data points.
- E
miR‐499‐5p qPCR analysis of total RNA isolated from PBMCs of healthy control subjects (−CMT, n = 17) and healthy subjects with a history of childhood maltreatment (+CMT, n = 17) (****P < 0.0001, Mann–Whitney U‐test). CMT: Childhood maltreatment. Data are presented as violin plots with median, quartiles, and data points.
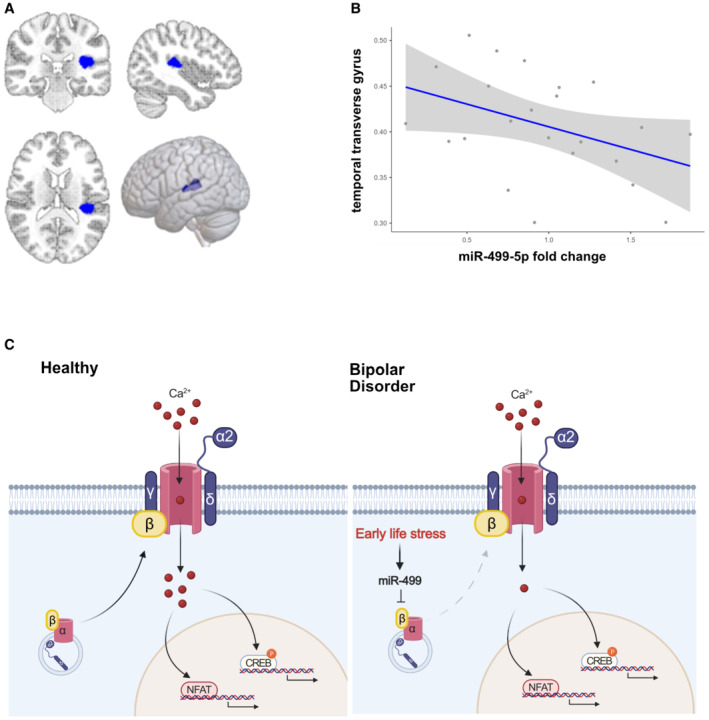
- A, B
Association of miR‐499‐5p expression and GMV in HC (n = 23): miR‐499‐5p levels were negatively correlated with a GMV cluster comprising parts of the left Wernicke language area (i.e., transverse temporal gyrus, the left parietal operculum, and the left superior temporal gyrus) (in blue) at P < 0.05 cluster‐level family‐wise error‐corrected (FWE) for multiple comparisons after an initial threshold of P < 0.001 uncorrected (k = 1,090, x/y/z = −42/−30/15, t = 4.7, P = 0.045).
- C
Proposed model for the mechanism of miR‐499‐5p dysregulation in BD. Early life stress induces the expression of miR‐499‐5p in human PBMCs and rat hippocampus, which impairs dendritic development and Cav1.2 calcium channel cell surface expression and activity by inhibiting the expression of an auxiliary subunit of Cav1.2 calcium channels and risk gene for BD, CACNB2.
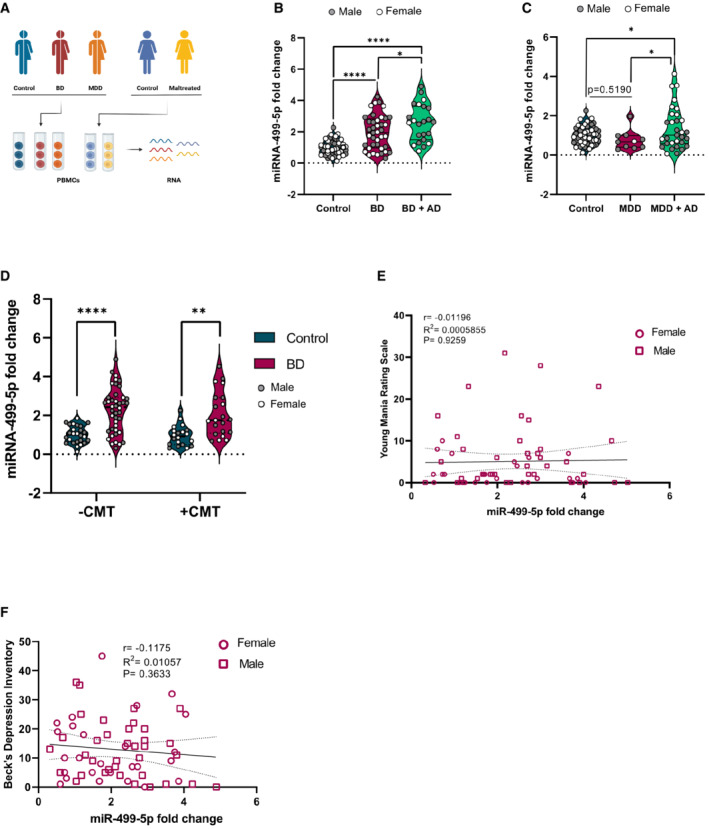
- A
Schematic illustration of the experimental workflow. Total RNA was isolated from PBMCs of psychiatrically healthy subjects (Controls or maltreated), BD and MDD patients for miRNA expression analysis.
- B
miR‐499‐5p qPCR analysis of total RNA isolated from PBMCs of control (female = 26, male = 31), BD subjects (female = 19, male = 21), or BD subjects under Antidepressant (AD) treatment (female = 7, male = 16) subjects. Two‐way ANOVA, Main effect Sex: P = 0.378; main effect Group: ****P = 1.68e‐11; Interaction group × sex: P = 0.663. Tukey's HSD: control versus BD and control versus BD + AD: ****P < 0.00001; BD versus BD + AD *P = 0.02526. Data are presented as violin plots with median, quartiles and data points.
- C
miR‐499‐5p qPCR analysis of total RNA isolated from PBMCs of control (female = 26, male = 31), MDD subjects (female = 1, male = 9), or MDD subjects under Antidepressant (AD) treatment (female = 15, male = 16) subjects. Two‐way ANOVA, Main effect Sex: **P = 0.003247; main effect Group: *P = 0.010018; Interaction group × sex: ***P = 0.000297. Tukey's HSD: control versus MDD: P = 0.5190; control versus MDD + AD: *P = 0.0306; MDD versus MDD + AD: *P = 0.0274. Data are presented as violin plots with median, quartiles, and data points.
- D
miR‐499‐5p qPCR analysis of total RNA isolated from PBMCs of control −CMT (female = 10, male = 16), control +CMT (female = 11, male = 9), BD −CMT (female = 18, male = 24), and BD + CMT (female = 8, male = 13). Three‐way ANOVA, main effect Sex: P = 0.4991, main effect CMT: P = 0.5434; main effect Group: P < 0.0001; interaction CMT × Group: P = 0.7532; interaction CMT × Sex: P = 0.3259; interaction Group × Sex: P = 0.3259; interaction CMT × Group × Sex: P = 0.9703. Tukey's HSD: control CMT− versus BD CMT−: ****P < 0.0001; control CMT+ versus BD CMT+: **P = 0.0013. Data are presented as violin plots with median, quartiles, and data points.
- E, F
miR‐499‐5p expression does not correlate with Young Mania Rating Scale or Beck's Depression Inventory scores from BD patients. Spearman correlation coefficient with two‐tailed analysis is provided in the legend. Squares: males, circles: females.
Similar articles
-
miR-708-5p is elevated in bipolar patients and can induce mood disorder-associated behavior in mice.EMBO Rep. 2025 Apr;26(8):2121-2145. doi: 10.1038/s44319-025-00410-y. Epub 2025 Mar 10. EMBO Rep. 2025. PMID: 40065182 Free PMC article.
-
Variation in the CACNB2 gene is associated with functional connectivity of the Hippocampus in bipolar disorder.BMC Psychiatry. 2019 Feb 11;19(1):62. doi: 10.1186/s12888-019-2040-8. BMC Psychiatry. 2019. PMID: 30744588 Free PMC article.
-
Biomarker potential of hsa-miR-145-5p in peripheral whole blood of manic bipolar I patients.Braz J Psychiatry. 2022 Jun 24;40(44):378-387. doi: 10.47626/1516-4446-2021-2260. Braz J Psychiatry. 2022. PMID: 35749663 Free PMC article.
-
From Gene to Behavior: L-Type Calcium Channel Mechanisms Underlying Neuropsychiatric Symptoms.Neurotherapeutics. 2017 Jul;14(3):588-613. doi: 10.1007/s13311-017-0532-0. Neurotherapeutics. 2017. PMID: 28497380 Free PMC article. Review.
-
Synaptic plasticity and depression: the role of miRNAs dysregulation.Mol Biol Rep. 2022 Oct;49(10):9759-9765. doi: 10.1007/s11033-022-07461-7. Epub 2022 Apr 20. Mol Biol Rep. 2022. PMID: 35441941 Review.
Cited by
-
RNA Biomarkers in Bipolar Disorder and Response to Mood Stabilizers.Int J Mol Sci. 2023 Jun 13;24(12):10067. doi: 10.3390/ijms241210067. Int J Mol Sci. 2023. PMID: 37373213 Free PMC article. Review.
-
The impact of the CACNB2 Rs11013860 polymorphism on grey matter volume and brain function in bipolar disorder.BMC Psychiatry. 2025 Feb 27;25(1):183. doi: 10.1186/s12888-025-06611-y. BMC Psychiatry. 2025. PMID: 40016690 Free PMC article.
-
miR-708-5p is elevated in bipolar patients and can induce mood disorder-associated behavior in mice.EMBO Rep. 2025 Apr;26(8):2121-2145. doi: 10.1038/s44319-025-00410-y. Epub 2025 Mar 10. EMBO Rep. 2025. PMID: 40065182 Free PMC article.
-
Genetic and functional analyses implicate microRNA 499A in bipolar disorder development.Transl Psychiatry. 2022 Oct 7;12(1):437. doi: 10.1038/s41398-022-02176-6. Transl Psychiatry. 2022. PMID: 36207305 Free PMC article.
-
Esketamine reduces postoperative depression in breast cancer through TREK-1 channel inhibition and neurotransmitter modulation.Cancer Cell Int. 2025 Feb 18;25(1):51. doi: 10.1186/s12935-025-03664-7. Cancer Cell Int. 2025. PMID: 39966835 Free PMC article.
References
-
- Agnew‐Blais J, Danese A (2016) Childhood maltreatment and unfavourable clinical outcomes in bipolar disorder: a systematic review and meta‐analysis. Lancet Psychiatry 3: 342–349 - PubMed
-
- Altier C, Dubel SJ, Barrère C, Jarvis SE, Stotz SC, Spaetgens RL, Scott JD, Cornet V, De Waard M, Zamponi GW et al (2002) Trafficking of L‐type calcium channels mediated by the postsynaptic scaffolding protein AKAP79. J Biol Chem 277: 33598–33603 - PubMed
-
- Altier C, Garcia‐Caballero A, Simms B, You H, Chen L, Walcher J, Tedford HW, Hermosilla T, Zamponi GW (2011) The Cavβ subunit prevents RFP2‐mediated ubiquitination and proteasomal degradation of L‐type channels. Nat Neurosci 14: 173–182 - PubMed
-
- Ashburner J (2007) A fast diffeomorphic image registration algorithm. Neuroimage 38: 95–113 - PubMed
-
- Ashburner J, Friston KJ (2005) Unified segmentation. Neuroimage 26: 839–851 - PubMed
Publication types
MeSH terms
Substances
LinkOut - more resources
Full Text Sources
Medical
Molecular Biology Databases
Research Materials
