. 2022 Aug 25;65(16):11100-11110.
doi: 10.1021/acs.jmedchem.2c00535. Epub 2022 Aug 15.

Therapeutic Potential of a Water-Soluble Silver-Diclofenac Coordination Polymer on 3D Pancreatic Cancer Spheroids

Affiliations

Therapeutic Potential of a Water-Soluble Silver-Diclofenac Coordination Polymer on 3D Pancreatic Cancer Spheroids

Sabina W Jaros et al. J Med Chem. .

Abstract

This work describes the traditional wet and green synthetic approaches, structural features, and extensive bioactivity study for a new coordination polymer [Ag(μ-PTA)(Df)(H2O)]n·3nH2O (1) that bears a silver(I) center, a 1,3,5-triaza-phosphaadamantane (PTA) linker, and a nonsteroidal anti-inflammatory drug, diclofenac (Df-). Compared to cisplatin, compound 1 exhibits both anti-inflammatory properties and very remarkable cytotoxicity toward various cancer cell lines with a high value of selectivity index. Additionally, the 3D model representing human pancreas/duct carcinoma (PANC-1) and human lung adenocarcinoma (A549) was designed and applied as a clear proof of the remarkable therapeutic potential of 1. The obtained experimental data indicate that 1 induces an apoptotic pathway via reactive oxygen species generation, targeting mitochondria due to their membrane depolarization. This study broadens a group of bioactive metal-organic networks and highlights the significant potential of such compounds in developing advanced therapeutic solutions.


Conflict of interest statement

The authors declare no competing financial interest.

Figures

Scheme 1
Scheme 1. Simplified Synthetic Procedure for Compound 1
Figure 1
Figure 1
Crystal structure of 1. (a) Connectivity of the Ag atom and ligands. (b) Tooth-like CP and (c) its simplified topological view (2C1 net). Additional details: (a) only NH and H2O hydrogen atoms are shown. The particular elements of the structural skeleton are color-coded as follows: silver (magenta), nitrogen (blue), phosphorus (orange), carbon (pale gray), oxygen (red), chlorine (green), and hydrogen (gray); (b,c) view down the a axis; (c) centroids of μ-PTA (gray) and silver (magenta).
Figure 2
Figure 2
Bright-field images of PANC-1 cells: CTRL BF—untreated cells (bright field), CTRL—untreated cells stained with OA/PI, and images of AO/PI stained PANC-1 cells (72 h after treatment): 1 and PTA, NaDf (diclofenac), and AgNO3 at the respective concentrations based on the molar ratio of 1:1:1 (PTA/NaDf/AgNO3). Cells with normal morphology and intense green nuclei—viable, round red cells—dead. Scale bar: 50 μm.
Figure 3
Figure 3
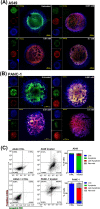
(A) A549 and (B) PANC-1 3D tumor spheroid model: untreated controls and assessment of the cytotoxicity of compound 1 (C = 0.1, 0.01, and 0.001 mM). PI: propidium iodide (red, death cells), CAM: calcein-AM (green, live cells), Hoechst (blue, nuclei); scale bar: 500 μm. (C) Cell death quantification in spheroids treated with 1 at 0.1 mM; these are presented as average values with standard deviation estimated from three independent tests.
Figure 4
Figure 4
Intracellular concentration of silver (ng Ag per mg of proteins) after incubating PANC-1 with 1 at IC50 for 4–72 h. Concentration of Ag for untreated cells has been omitted because it was less than 0.002 ng Ag per mg of proteins. Data are given as mean ± SEM (*** represents P-value < 0.001, ** P-value < 0.01, and * P-value < 0.5).
Figure 5
Figure 5
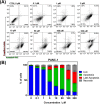
Flow cytometry analysis of dead and viable cells by staining with PI/annexin V–FITC. (A) Representative plots for PANC-1 cells following 24 h treatment with increased concentration of 1. (B) Percentage dependence of viable cells (annexin V-(−)), necrosis (annexin V(−) and PI(+)), early apoptosis (annexin V(+) and PI(−)), and late apoptosis (annexin V(+) and PI(−)). Data refer to mean ± SD on the basis of three tests. Table S2 contains additional data on statistical significance (Supporting Information).
Figure 6
Figure 6
(A) Confocal images of PANC-1 cells treated with 1 and in situ ROS generation after 4 h of incubation. CTRL—untreated control, bright-field image; untreated—cells’ fluorescence image after treatment with 1; CTRL(+) pyo—cells’ image after treatment with pyocyanin (pyo) during 4 h; positive control and 1—cells’ image after treatment with 1, analyzed after 4 h (λem 524 nm, λex 505 nm); scale bar: 50 μm. (B) Level of oxidative stress induced in PANC-1 cells during treatment with 1, PTA, NaDf, and AgNO3 expressed as fluorescence intensity dependence on time (up to 6 h). Pyocyanin- untreated and -treated cells were applied as ROS negative and positive control tests, respectively. (C) Changes of mitochondrial membrane potential by a mitochondrial probe JC-10 for 1, PTA, NaDf, AgNO3, and controls (ciprofloxacin and gentamicin) at respective concentrations based on the molar ratio 1:1:1, incubation time: 4 h. (D) Cleavage of the pBR322 plasmid (agarose gel electrophoresis experiment) in the presence of (A) PTA and NaDf and (B) 1 in dimethylformamide (DMF) (typically 10% DMF solution) at different concentrations (1, 50, and 500 μM) and incubation times (72, 48, and 24 h). (e) Densitometry analysis of plasmid cleavage by 1 (X axis: time [h]; Y axis: % plasmid forms). Data are given as mean ± SD (*** represents P-value < 0.001, ** P-value < 0.01, and * P-value < 0.5).
Figure 7
Figure 7
(a) IL-6 and (b) TNF-α production measured after incubation with 1 (c = 1 μM), ctr(−) supernatant of untreated cells, ctrl(+) IL6, and TFN-a, respectively. Data are represented as mean ± SD (*** represents P-value < 0.001, ** P-value < 0.01, and * P-value < 0.5).

References

    1. Zhou Z.; Vázquez-González M.; Willner I. Stimuli-responsive metal-organic framework nanoparticles for controlled drug delivery and medical applications. Chem. Soc. Rev. 2021, 50, 4541–4563. 10.1039/d0cs01030h. - DOI - PubMed
    1. Liu W.; Yan Q.; Xia C.; Wang X.; Kumar A.; Wang Y.; Liu Y.; Pan Y.; Liu J. Recent advances in cell membrane coated metal-organic frameworks (MOFs) for tumor therapy. J. Mater. Chem. B 2021, 9, 4459–4474. 10.1039/d1tb00453k. - DOI - PubMed
    1. Cai H.; Huang X.-L.; Li D. Biological metal-organic frameworks: Structures, host-guest chemistry and bio-applications. Coord. Chem. Rev. 2019, 378, 207–221. 10.1016/j.ccr.2017.12.003. - DOI
    1. Rojas S.; Devic T.; Horcajada P. Metal organic frameworks based on bioactive components. J. Mater. Chem. B 2017, 5, 2560–2573. 10.1039/c6tb03217f. - DOI - PubMed
    1. Chu Y.; Hou J.; Boyer C.; Richardson J. J.; Liang K.; Xu J. Biomimetic synthesis of coordination network materials: Recent advances in MOFs and MPNs. Appl. Mater. Today 2018, 10, 93–105. 10.1016/j.apmt.2017.12.009. - DOI

Publication types