. 2022 Aug 15;17(8):e0266645.
doi: 10.1371/journal.pone.0266645. eCollection 2022.

RAD51 is a druggable target that sustains replication fork progression upon DNA replication stress

Affiliations

RAD51 is a druggable target that sustains replication fork progression upon DNA replication stress

Sonia Feu et al. PLoS One. .

Abstract

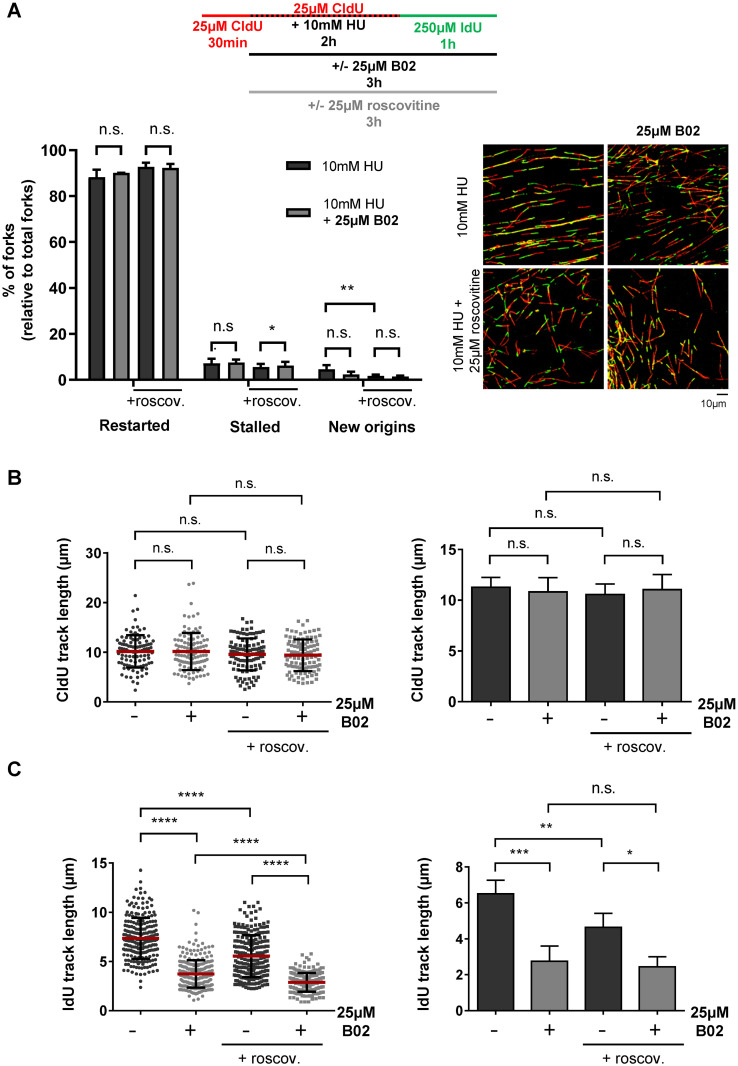
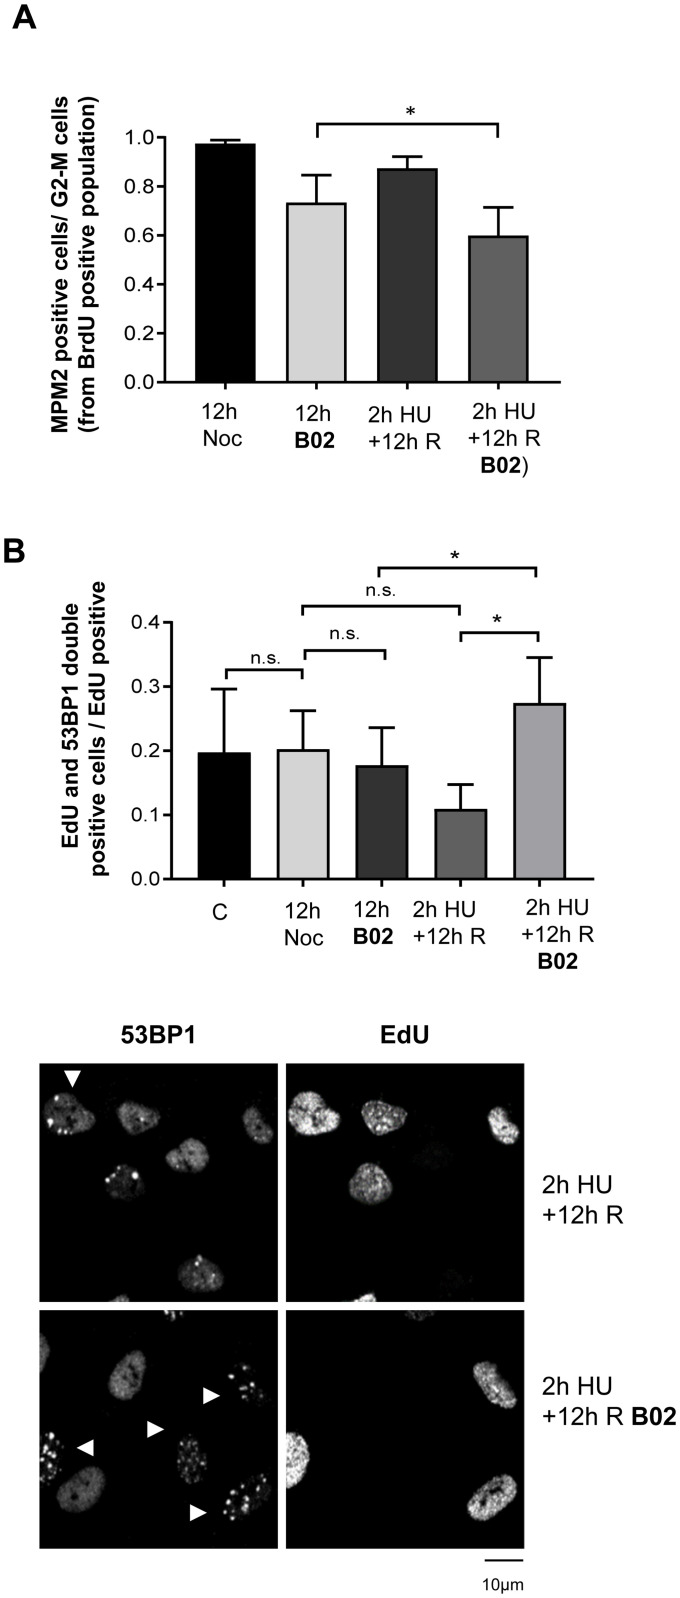
Solving the problems that replication forks encounter when synthesizing DNA is essential to prevent genomic instability. Besides their role in DNA repair in the G2 phase, several homologous recombination proteins, specifically RAD51, have prominent roles in the S phase. Using different cellular models, RAD51 has been shown not only to be present at ongoing and arrested replication forks but also to be involved in nascent DNA protection and replication fork restart. Through pharmacological inhibition, here we study the specific role of RAD51 in the S phase. RAD51 inhibition in non-transformed cell lines did not have a significant effect on replication fork progression under non-perturbed conditions, but when the same cells were subjected to replication stress, RAD51 became necessary to maintain replication fork progression. Notably, the inhibition or depletion of RAD51 did not compromise fork integrity when subjected to hydroxyurea treatment. RAD51 inhibition also did not decrease the ability to restart, but rather compromised fork progression during reinitiation. In agreement with the presence of basal replication stress in human colorectal cancer cells, RAD51 inhibition reduced replication fork speed in these cells and increased γH2Ax foci under control conditions. These alterations could have resulted from the reduced association of DNA polymerase α to chromatin, as observed when inhibiting RAD51. It may be possible to exploit the differential dependence of non-transformed cells versus colorectal cancer cells on RAD51 activity under basal conditions to design new therapies that specifically target cancer cells.


Conflict of interest statement

The authors have declared that no competing interests exist.

Figures

Fig 1
Fig 1. RAD51 inhibition does not affect fork progression under unperturbed conditions in hTERT-RPE.
Cells were labelled as indicated (upper panel), adding the B02 inhibitor during the second analogue labelling. After that, cells were harvested and prepared for DNA fiber analysis. Representative images are shown (bottom-left panels). The IdU track length was measured. At least 200 fibers of each condition in each experiment were measured. Means and standard deviation (bars) of three experiments are shown (bottom-right panel, paired t-test, n.s.: non-statistically significant). See data used for quantification in “minimal data set” file.
Fig 2
Fig 2. RAD51 inhibition does not affect the number of restarted forks neither causes fork degradation but impairs fork progression after an acute replication stress in hTERT-RPE cells.
(A) Cells were labelled as indicated (upper panel), adding the B02 inhibitor and roscovitine with 10mM HU and the second analogue. After labelling, cells were harvested and prepared for DNA fiber analysis. At least 200 fibers of each condition in each experiment were used to calculate the percentage of restart, stalled forks and new origin firing events relative to total forks. Representative images are shown (bottom-right panel). Means and standard deviation (bars) of three experiments with (+roscov.) or without roscovitine are shown (bottom-left panel, paired t-test, n.s.: non-statistically significant, * P value < 0.05, ** P value < 0.01). (B) DNA fibers from (A) were used to measure CldU track length (first analogue). At least 300 fibers of each condition were measured. One representative experiment out of three is shown in left panel (Mann-Whitney test, n.s.: non-statistically significant; each dot represents a fiber track length). Means and standard deviation (bars) of three different experiments with (+roscov.) or without roscovitine are shown in right panel (paired t-test, n.s.: non-statistically significant). (C) DNA fibers from (A) were used to measure IdU track length (second analogue). At least 200 fibers of each condition in each experiment were measured. One representative experiment out of three is shown (bottom-left panel, Mann-Whitney test, **** P value < 0.0001). Means and standard deviation (bars) of three experiments with (+roscov.) or without roscovitine are shown (bottom-right panel, paired t-test, n.s.: non-statistically significant, * P value < 0.05, ** P value < 0.01, *** P value < 0.001). See data used for quantification in S1 File.
Fig 3
Fig 3. RAD51 is necessary for an efficient fork restart and progression after an acute replication stress in hTERT-RPE cells.
Cells were labelled as indicated (upper-left panel), adding the B02 inhibitor after 30 minutes of HU release. After labelling, cells were harvested and prepared for DNA fiber analysis. Representative images are shown (upper-right panels). At least 200 fibers of each condition in each experiment were measured. One representative experiment out of three is shown in bottom-left panel (Mann-Whitney test, **** P value < 0.0001; each dot represents a fiber track length). Means and standard deviation (bars) of three experiments are shown in bottom-right panel (paired t-test, * P value < 0.05). See data used for quantification in S1 File.
Fig 4
Fig 4. RAD51 inhibition affects mitotic entry, having more effect after an acute replication stress in hTERT-RPE cells.
(A) Cells were labelled with BrdU and then treated during 2 hours with 10mM HU or left untreated for 12 hours into nocodazole-containing fresh medium, without (12h Noc) or with RAD51 inhibitor (12h B02) (upper panel). HU treated cells were released for 12h in fresh media without (2h HU+12h R) or with B02 during the last 11h30’ (2hHU+12h R B02). Flow cytometry analysis of approximately 15000 cells was performed to analyse the S-phase population, initially labelled with BrdU analogue (BrdU-488 positive cells), after 12 hours. Cell cycle progression was analysed by measuring mitotic cells (MPM2-647 positive from BrdU-488-positive population) relative to cells into G2-M phases. Means and standard deviation (bars) of six experiments are shown (bottom panel, paired t-test, * P value < 0.05, ** P value < 0.01). (B) Cells were pulse-labelled with EdU analogue during 30 minutes (Control). Then, cells were treated as in (A) Finally, click reaction and 53BP1 immunofluorescence were performed. Representative images are shown (lower panels). At least 100 cells were counted for condition in each experiment. Means and standard deviation (bars) of three experiments in control and four experiments in other conditions are shown. The proportion of cells presenting both EdU and 53BP1 foci (more than six) relative to EdU positive cells is shown (upper panel, paired t-test, n.s.: non-statistically significant, * P value < 0.05, ** P value < 0.01). See data used for quantification in S1 File.
Fig 5
Fig 5. RAD51 inhibition affects fork progression under mild or bearable replication stress in hTERT-RPE cells.
(A) Cells were synchronized in S phase by a thymidine block and 2h release. After that, they were treated with HU, B02 or left untreated (CTL) for the period indicated in the Fig. As.:asynchronic cells. Cells were lysed and P-Chk1 (Ser296) and CDK4 (loading control) were analyzed by western blot. (B) Cells were labelled as indicated (upper panel), adding the B02 inhibitor during the second analogue and HU treatment. After labelling, cells were harvested and prepared for DNA fiber analysis. Representative images are shown. At least 300 fibers of each condition in each experiment were measured. Quantification of a representative experiment out of two is shown (bottom-right panel, Mann-Whitney test, **** P value < 0.0001). (C) Cells were labelled as indicated (upper panel). HU was added 30 minutes before DNA labelling (this dose of HU is not completely inhibiting replication). B02 was added where it is indicated. After labelling, cells were harvested and prepared for DNA fiber analysis. Representative images are shown (left panels). At least 250 fibers of each condition in each experiment were measured. One representative experiment out of four is shown in middle graph (Mann-Whitney test, **** P value < 0.0001; each dot represents a fiber track length). Means and standard deviation (bars) of four experiments are shown right graph (paired t-test, * P value < 0.05). See data used for quantification in S1 File.
Fig 6
Fig 6. RAD51 inhibition affects fork progression during unperturbed conditions in HCT116 cells.
(A) Cells were labelled as indicated (upper-left panel), adding the B02 inhibitor with the second analogue. After labelling, cells were harvested and prepared for DNA fiber analysis. Representative images are shown (upper-right panels). The IdU track length was measured. At least 250 fibers of each condition in each experiment were measured. One representative experiment out of three is shown (bottom-left panel, Mann-Whitney test, **** P value < 0.0001). Means and standard deviation (bars) of three experiments are shown (bottom-right panel, paired t-test, * P value < 0.05). (B) cells were treated (B02) or not (CTL) with B02 for 4h and then cytoplasm and chromatin fraction purified as indicated in the methods section. DNA polymerase α (DNA pol α), and Lamin B and GAP120 (as controls of cell fractionation and proteins loading in the gel) were analyzed by western blot. A representative WB (upper panel) and quantification of 5 biological replicates (lower panel; mean and standard deviation, t-student test, **** P value< 0.001) are shown. (C) Cells were pulse labeled with CldU, treated with B02, HU, or no-drug (control) and pulse-labeled again with EdU. After processing for Immunofluorescence to detect CldU, EdU and γH2AX, images were acquired and analyzed as indicated in the methods section. A representative experiment is shown. B02 versus Control γH2AX foci number distribution is significantly different according to Mann-Whitney test, **** P value < 0.0001. See data used for quantification in S1 File.

Similar articles

Cited by

References

    1. Branzei D, Foiani M. Maintaining genome stability at the replication fork. Nat Rev Mol Cell Biol. 2010;11: 208–19. doi: 10.1038/nrm2852 - DOI - PubMed
    1. Kang S, Kang MS, Ryu E, Myung K. Eukaryotic DNA replication: Orchestrated action of multi-subunit protein complexes. Mutat Res—Fundam Mol Mech Mutagen. 2018;809: 58–69. doi: 10.1016/j.mrfmmm.2017.04.002 - DOI - PubMed
    1. Deegan TD, Diffley JFX. MCM: One ring to rule them all. Curr Opin Struct Biol. 2016;37: 145–151. doi: 10.1016/j.sbi.2016.01.014 - DOI - PubMed
    1. Cortez D. Replication-Coupled DNA Repair. Mol Cell. 2019;74: 866–876. doi: 10.1016/j.molcel.2019.04.027 - DOI - PMC - PubMed
    1. Liu W, Krishnamoorthy A, Zhao R, Cortez D. Two replication fork remodeling pathways generate nuclease substrates for distinct fork protection factors. Sci Adv. 2020;6: eabc3598. doi: 10.1126/sciadv.abc3598 - DOI - PMC - PubMed

Publication types