. 2022 Aug 15;17(8):e0270339.
doi: 10.1371/journal.pone.0270339. eCollection 2022.

Integrated 3d flow-based multi-atlas brain structure segmentation

Affiliations

Integrated 3d flow-based multi-atlas brain structure segmentation

Yeshu Li et al. PLoS One. .

Abstract

MRI brain structure segmentation plays an important role in neuroimaging studies. Existing methods either spend much CPU time, require considerable annotated data, or fail in segmenting volumes with large deformation. In this paper, we develop a novel multi-atlas-based algorithm for 3D MRI brain structure segmentation. It consists of three modules: registration, atlas selection and label fusion. Both registration and label fusion leverage an integrated flow based on grayscale and SIFT features. We introduce an effective and efficient strategy for atlas selection by employing the accompanying energy generated in the registration step. A 3D sequential belief propagation method and a 3D coarse-to-fine flow matching approach are developed in both registration and label fusion modules. The proposed method is evaluated on five public datasets. The results show that it has the best performance in almost all the settings compared to competitive methods such as ANTs, Elastix, Learning to Rank and Joint Label Fusion. Moreover, our registration method is more than 7 times as efficient as that of ANTs SyN, while our label transfer method is 18 times faster than Joint Label Fusion in CPU time. The results on the ADNI dataset demonstrate that our method is applicable to image pairs that require a significant transformation in registration. The performance on a composite dataset suggests that our method succeeds in a cross-modality manner. The results of this study show that the integrated 3D flow-based method is effective and efficient for brain structure segmentation. It also demonstrates the power of SIFT features, multi-atlas segmentation and classical machine learning algorithms for a medical image analysis task. The experimental results on public datasets show the proposed method's potential for general applicability in various brain structures and settings.


Conflict of interest statement

All authors declare that YX had financial support from the National Natural Science Foundation in China, and the State Key Laboratory of Software Development Environment in Beihang University in China; no financial relationships with any organizations that might have an interest in the submitted work in the previous three years; no other relationships or activities that could appear to have influenced the submitted work. All funding affiliations do not alter our adherence to PLOS ONE policies on sharing data and materials.

Figures

Fig 1
Fig 1. A simple diagram for the pipeline of our proposed system.
The rectangles are three key components in our system: registration, atlas selection, and label fusion. Ovals and cylinders denote data representations.
Fig 2
Fig 2. Flowchart for our integrated 3D flow-based multi-atlas segmentation system.
Initially, every atlas image volume is registered with the target image, producing a flow field and a corresponding energy value. After sorting the registration results by their energy values from lowest to highest, the top K flow fields are chosen and applied to warp the corresponding atlas images and annotations to obtain K candidates. Upon performing fusion with the candidates, the predicted segmentation for the target image is produced. For convenience, we use selected slices of MRI images to denote 3D MRI volumes.
Fig 3
Fig 3. Illustration of 3D SIFT descriptors.
The large arrow in the center points from a diagram showing the gradient distribution for a voxel’s 4 × 4 × 4 neighborhood to a diagram showing how the distribution fits into eight 2 × 2 × 2 sub-blocks with 6 directions/histogram bins.
Fig 4
Fig 4. Examples of the visualized displacement fields and their corresponding histogram statistics.
The histograms are based on the smoothness terms for all pairs of adjacent voxels with α = 1 and d = ∞. From left to right: the integrated flow with less restriction on local smoothness; the integrated flow with stronger local smoothness; ANTs SyN.
Fig 5
Fig 5. Volume examples of the datasets in our experiments.
For each MRI volume, we extract the left and right sub-volumes of some brain structure to obtain a dataset of cropped volumes according to ROIs generated by Freesurfer. The dimensional length is annotated alongside the volumes shown in stacked slices.
Fig 6
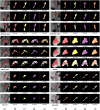
Fig 6. Final fusion segmentation results of four best-performing systems.
Three target images are chosen for demonstration in each dataset or cohort. Cuneus sub-volumes in the LPBA40 dataset are shown as sagittal slices while all the other volumes are represented by coronal slices. (a) Target image and ground truth. (b) ANTs SyN + Joint Label Fusion. (c) Elastix + Joint Label Fusion. (d) ANTs SyN + Learning to Rank + Joint Label Fusion. (e) integrated flow + atlas selection + label transfer (our system). Ground truth segmentation is also shown in white color below each resulting segmentation in (b)-(e) for reference. DC: the Dice coefficient.
Fig 7
Fig 7. Graphical comparisons of three registration methods.
Three examples from each dataset or cohort are illustrated. The shown images are the ground truth, the moving image, the registration result of ANTs, Elastix and our method, from left to right. Sagittal slices are adopted for the LPBA40 dataset while coronal slices are used for other datasets. ANTs: ANTs SyN. IF: the integrated flow (our method). DC: the Dice coefficient.
Fig 8
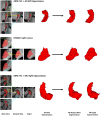
Fig 8. Voxel correspondence of 3 pairs of subjects for our registration method.
The example in the top shows coronal slices of registration between an AD subject volume and an NC subject volume of the left hippocampus in the ADNI dataset. The sagittal slices in the middle demonstrate registration between two right cuneus volumes in the LPBA40 dataset. The registration example in the bottom shown in sagittal slices illustrates large deformation from an NC subject’s right hippocampus volume to an MCI volume in the ADNI dataset. Three landmarks either on the boundary or in a homogeneous region for each example are annotated with crosses and displacement vectors in different colors. All the coordinates are in the native space of the target image.
Fig 9
Fig 9. A box and whisker diagram of registration results in Dice coefficients on five datasets for three registration methods, ANTs SyN, Elastix and the integrated flow (our method).
Fig 10
Fig 10. Approximately linear relationships between the expected Dice coefficient and the amount of deformation in registration.
A subplot is made for each registration method and each dataset. The deformation amount is the sum of the Euclidean norms of all the displacement vectors. The best-fitting straight line through the data points is based on linear regression. For better illustration, some data points are out of range, thus absent in this figure. ANTs: ANTs SyN. IF: the integrated flow (our method).
Fig 11
Fig 11. The mean Dice coefficient results of three label fusion methods, Joint Label Fusion (middle), STAPLE (bottom) and the label transfer (top, our method), on the ADNI dataset.
The number of selected candidate atlases ranges from 1 to 47.
Fig 12
Fig 12. Average execution time of label fusion programs with the number of atlas selection ranging from 1 to 135.
Three label fusion methods are Joint Label Fusion (top), STAPLE (middle) and the label transfer (bottom, our method).

Similar articles

References

    1. Jun E, Kang E, Choi J, Suk HI. Modeling regional dynamics in low-frequency fluctuation and its application to Autism spectrum disorder diagnosis. NeuroImage. 2019;184:669–686. doi: 10.1016/j.neuroimage.2018.09.043 - DOI - PubMed
    1. Hua X, Lee S, Hibar DP, Yanovsky I, Leow AD, Toga AW, et al. Mapping Alzheimer’s disease progression in 1309 MRI scans: power estimates for different inter-scan intervals. Neuroimage. 2010;51(1):63–75. doi: 10.1016/j.neuroimage.2010.01.104 - DOI - PMC - PubMed
    1. Gross WL, Binder JR. Alternative thresholding methods for fMRI data optimized for surgical planning. Neuroimage. 2014;84:554–561. doi: 10.1016/j.neuroimage.2013.08.066 - DOI - PMC - PubMed
    1. Dolz J, Desrosiers C, Ayed IB. 3D fully convolutional networks for subcortical segmentation in MRI: A large-scale study. NeuroImage. 2018;170:456–470. doi: 10.1016/j.neuroimage.2017.04.039 - DOI - PubMed
    1. Chen H, Dou Q, Yu L, Qin J, Heng PA. VoxResNet: Deep voxelwise residual networks for brain segmentation from 3D MR images. NeuroImage. 2018;170:446–455. doi: 10.1016/j.neuroimage.2017.04.041 - DOI - PubMed

Publication types