. 2022 Aug 15;18(8):e1010708.
doi: 10.1371/journal.ppat.1010708. eCollection 2022 Aug.

Salmonella Typhimurium outer membrane protein A (OmpA) renders protection from nitrosative stress of macrophages by maintaining the stability of bacterial outer membrane

Affiliations

Salmonella Typhimurium outer membrane protein A (OmpA) renders protection from nitrosative stress of macrophages by maintaining the stability of bacterial outer membrane

Atish Roy Chowdhury et al. PLoS Pathog. .

Abstract

Bacterial porins are highly conserved outer membrane proteins used in the selective transport of charged molecules across the membrane. In addition to their significant contributions to the pathogenesis of Gram-negative bacteria, their role(s) in salmonellosis remains elusive. In this study, we investigated the role of outer membrane protein A (OmpA), one of the major outer membrane porins of Salmonella, in the pathogenesis of Salmonella Typhimurium (STM). Our study revealed that OmpA plays an important role in the intracellular virulence of Salmonella. An ompA deficient strain of Salmonella (STM ΔompA) showed compromised proliferation in macrophages. We found that the SPI-2 encoded virulence factors such as sifA and ssaV are downregulated in STM ΔompA. The poor colocalization of STM ΔompA with LAMP-1 showed that disruption of SCV facilitated its release into the cytosol of macrophages, where it was assaulted by reactive nitrogen intermediates (RNI). The enhanced recruitment of nitrotyrosine on the cytosolic population of STM ΔompAΔsifA and ΔompAΔssaV compared to STM ΔsifA and ΔssaV showed an additional role of OmpA in protecting the bacteria from host nitrosative stress. Further, we showed that the generation of greater redox burst could be responsible for enhanced sensitivity of STM ΔompA to the nitrosative stress. The expression of several other outer membrane porins such as ompC, ompD, and ompF was upregulated in STM ΔompA. We found that in the absence of ompA, the enhanced expression of ompF increased the outer membrane porosity of Salmonella and made it susceptible to in vitro and in vivo nitrosative stress. Our study illustrates a novel mechanism for the strategic utilization of OmpA by Salmonella to protect itself from the nitrosative stress of macrophages.


Conflict of interest statement

The authors have declared that no competing interests exist.

Figures
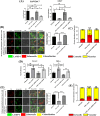
Fig 1
Fig 1. Deletion of OmpA impairs the intracellular proliferation of Salmonella Typhimurium in macrophages.
(A) Fold proliferation of STM (WT), ΔompA, ΔompA: pQE60-ompA, & ΔompA: pQE60 in RAW264.7 and PMA activated U937 cells (MOI = 10) (n = 3, N = 3 for RAW 264.7 cells and n = 3, N = 2 for activated U937 cells). (B) Representative image of LAMP-1 recruitment on STM (WT), ΔompA, and ΔompA: pQE60-ompA (MOI = 20) in RAW264.7 cells. The colocalization coefficient of the bacteria with LAMP-1 has been represented in the form of a vertical bar graph. Scale bar = 5μm (n = 100, N = 4). (C) Chloroquine resistance assay of RAW264.7 cells infected with STM (WT), ΔompA, ΔompA: pQE60-ompA strains, respectively (n = 3, N = 2). (D) Fold proliferation of STM (WT), ΔompA, ΔompA: pQE60-ompA, & ΔompA: pQE60 in Caco-2 and HeLa cells (MOI = 10) (n = 3, N = 3). (E) Representative image of LAMP-1 recruitment on STM (WT), ΔompA, and ΔompA: pQE60-ompA (MOI of 20) in Caco-2 cells. The colocalization coefficient of the bacteria with LAMP-1 has been represented in the form of a vertical bar graph. Scale bar = 5μm (n = 100, N = 2). (F) Chloroquine resistance assay of Caco-2 cells infected with STM (WT), ΔompA, ΔompA: pQE60-ompA strains, respectively (n = 3, N = 2). Data are represented as mean ± SEM. (P) *< 0.05, (P) **< 0.005, (P) ***< 0.0005, (P) ****< 0.0001, ns = non-significant, (One-way ANOVA in A, B, D, E, and 2way ANOVA in C and F).
Fig 2
Fig 2. Deficiency of OmpA downregulates the expression of SPI-2 effector proteins in Salmonella.
(A) Representative image of SseC/ SseD recruitment on STM (WT) and ΔompA expressing RFP (MOI 20) in RAW264.7 cells. The colocalization coefficient of bacteria with SseC and SseD were represented as vertical bar graphs. Scale bar = 5μm, (n = 50, N = 3). Quantification of the expression of (B) sseC and (C) sseD in STM (WT) and ΔompA growing intracellularly in RAW264.7 cells by RT-qPCR (n = 3, N = 3). The expression profile of (D) sifA and (E) ssaV in STM (WT), ΔompA, and ΔompA-pQE60-ompA growing in RAW264.7 cells, LB broth, and acidic F media, respectively (n = 3, N = 3). (F) Studying the intracellular acidification of BCECF-AM stained STM (WT), ΔompA, and ΔompA: pQE60-ompA in phosphate buffer of pH 5.5, 6, 6.5, and 7, respectively, using 20 μM of BCECF-AM by flow cytometry. The ratio of BCECF-AM (MFI) at 488 and 405 nm were represented as a vertical bar graph (n = 4, N = 3). Data are represented as mean ± SEM. (P) *< 0.05, (P) **< 0.005, (P) ***< 0.0005, (P) ****< 0.0001, ns = non-significant, (Unpaired stuedent’s t test in A, B, C and one-way ANOVA in D, E, F).
Fig 3
Fig 3. In addition to sifA and ssaV, Salmonella uses OmpA to combat the nitrosative stress of macrophages.
(A) Estimating the extracellular nitrite from the culture supernatant of RAW264.7 cells infected with STM (WT), ΔompA, ΔompA: pQE60-ompA, ΔompA: pQE60, & heat-killed bacteria (MOI = 10) respectively by Griess assay (n = 3, N = 5). (B) Representative dot plots (SSC-A vs. DAF-2 DA) and histograms (Count vs. DAF-2 DA) of RAW264.7 cells infected with STM (WT), ΔompA, ΔompA: pQE60-ompA, and (WT): LLO (MOI 10) to estimate the level of intracellular nitric oxide (NO) using DAF-2 DA (5 μM). The percent population of DAF-2 DA positive cells was represented in a vertical bar graph (n≥3, N = 6). (C) Immunofluorescence image of RAW264.7 cells infected with STM (WT), ΔompA, (WT): LLO, and ΔompA: LLO at MOI 20. The colocalization coefficient of bacteria with nitrotyrosine was represented as a vertical bar graph. Scale bar = 5μm (n = 50, N = 3). (D) Fold proliferation of STM (WT), ΔompA, (WT): LLO, and ΔompA: LLO in RAW264.7 cells (n≥3, N = 2). (E) Quantifying the transcript-level expression of spiC from RAW264.7 cells infected with STM (WT), ΔompA & (WT): LLO at MOI 50. STM (WT) infected RAW264.7 cells treated with bafilomycin A (50 nM) were used as a control (n = 3, N = 3). (F) Estimating the expression of spiC by RT-qPCR in STM (WT) and ΔompA growing in LB broth and acidic F media (n = 3, N = 5). (G) Representative image of LAMP-1 recruitment on STM (WT), ΔompA, (WT): LLO, ΔsifA, ΔompAΔsifA, ΔssaV, ΔompAΔssaV (MOI = 20) in RAW264.7 cells. The colocalization coefficient of the bacteria with LAMP-1 was represented as a vertical bar graph. Scale bar = 5μm (n = 80, N = 3). (H) Representative image of RAW264.7 cells infected with STM (WT), ΔompA, (WT): LLO, ΔsifA, ΔompAΔsifA, ΔssaV, ΔompAΔssaV (MOI = 20) to visualize the recruitment of nitrotyrosine on the bacteria. The vertical bar graph depicts the colocalization coefficient of bacteria with intracellular nitrotyrosine. Scale bar = 5μm, (n = 100, N = 3). Data are represented as mean ± SEM. (P) *< 0.05, (P) **< 0.005, (P) ***< 0.0005, (P) ****< 0.0001, ns = non-significant, (One-way ANOVA).
Fig 4
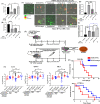
Fig 4. Modulating the activity of iNOS by using a specific inhibitor or activator determines the fate of STM ΔompA in in vitro and in vivo infection models.
Intracellular survival of STM (WT) and ΔompA (MOI = 10) in RAW264.7 cells (16 hours post-infection) in the presence and absence of iNOS (A) inhibitor- 1400W dihydrochloride (10 μM) and (B) activator- mouse IFN-ɣ (100U/ Ml) (n = 3, N = 3). (C) Immunofluorescence image of RAW264.7 cells infected with STM (WT) and ΔompA (MOI = 20) in the presence and absence of (D) 1400W dihydrochloride and (E) mouse IFN-ɣ. The colocalization coefficient of bacteria with nitrotyrosine was represented in vertical bar graphs (n≥ 50, N = 2). (F) The schematic representation of the experimental strategy for studying the in vivo pathogenesis of STM (WT) and ΔompA. (G) Enumerating the bacterial load in the liver, spleen, and MLN of C57BL/6 mice orally gavaged with STM (WT) and ΔompA in the presence and absence of iNOS inhibitor aminoguanidine hydrochloride (10mg/ kg of body weight). The bacterial load from the liver, spleen, and MLN of iNOS-/- C57BL/6 mice were also quantified. The log10(CFU/ gm-wt.) for each CFU obtained after plating was plotted (n = 5, N = 3). (H) Studying the survival BALB/c and C57BL/6 mice infected with a lethal dose of STM (WT) and ΔompA. The survival study was monitored till the death of all the wild-type infected mice (n = 10). Data are represented as mean ± SEM. (P) *< 0.05, (P) **< 0.005, (P) ***< 0.0005, (P) ****< 0.0001, ns = non-significant, (One-way ANOVA in A, B, D, E and Mann-Whitney U test in G).
Fig 5
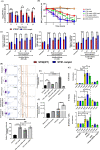
Fig 5. OmpA-dependent regulation of outer membrane permeability in Salmonella controls cytoplasmic redox homeostasis in response to in vitro nitrosative stress.
(A) Time-dependent in vitro death kinetics of STM (WT) and ΔompA in the presence of acidified nitrite (Nitrite concentration 800 μM in PBS of pH 5.4). Data are represented as mean ± SEM (N = 5). (B) In vitro nitrite uptake assay of STM (WT), ΔompA, ΔompA: pQE60-ompA, ΔompA: pQE60, & PFA fixed dead bacteria (n = 3, N = 4). (C) Time-dependent measurement of redox homeostasis of STM (WT) and ΔompA harboring pQE60-Grx1-roGFP2 in response to varying concentrations of acidified nitrite. Median fluorescence intensities of Grx1-roGFP2 at 405nm and 488nm for the FITC positive population were used to obtain the 405/ 488 ratio (n = 3, N = 3). (D) The dot plots (SSC-A vs. DiBAC4) and histograms (Count vs. DiBAC4) representing the outer membrane porosity of STM (WT), ΔompA, ΔompA: pQE60-ompA, & ΔompA: pQE60 growing in acidic F media (12 hours post-inoculation). The median fluorescence intensity of DiBAC4 (final concentration- 1 μg/ mL) has been represented as a vertical bar graph (n = 3, N = 2). (E) Measurement of outer membrane porosity of STM (WT), ΔompA, ΔompA: pQE60-ompA & ΔompA: pQE60 in acidic F media (12 hours post-inoculation) using bisbenzimide (excitation- 346 nm and emission- 460 nm), (final concentration- 1 μg/ mL), (n = 8, N = 3). (F) Measuring the outer membrane porosity of STM (WT) and ΔompA isolated from RAW264.7 cells at 12 hours post-infection by bisbenzimide (Sigma) (final concentration- 1 μg/ mL), (n = 6, N = 3). (G) Quantifying the expression profile of larger porins (OmpC, OmpD, OmpF) by RT-qPCR in STM (WT), ΔompA, & ΔompA: pQE60-ompA growing in LB broth, F media, and RAW264.7 cells (MOI 50) (12 hours post-inoculation), (n = 3, N = 3). Data are represented as mean ± SEM. (P) *< 0.05, (P) **< 0.005, (P) ***< 0.0005, (P) ****< 0.0001, ns = non-significant, (Unpaired student’s t-test in A, B, C, G and one-way ANOVA in D, E, F).
Fig 6
Fig 6. OmpC, OmpD, and OmpF deficiency in Salmonella doesn’t hamper the stability of SCV.
(A) Representative image of LAMP-1 recruitment on STM (WT), ΔompA, ΔompAΔompC, ΔompAΔompD, ΔompAΔompF, & WT: LLO (MOI = 20) in RAW264.7 cells. (B) The colocalization coefficient of bacteria with LAMP-1 was represented as a vertical bar graph (n≥50, N = 2). Scale bar = 5μm. (C) RAW264.7 cells were infected with STM (WT), ΔompA, ΔompC, ΔompD, and ΔompF (MOI 20) to visualize the intracellular niche of the bacteria. (D) Quantifying the colocalization coefficient of bacteria with LAMP-1 (n≥60, N = 2). Scale bar = 5μm. Data are represented as mean ± SEM. (P) ****< 0.0001, (One-way ANOVA).
Fig 7
Fig 7. In the absence of OmpA, outer membrane protein F (OmpF) enhances the susceptibility of Salmonella against the nitrosative stress of RAW264.7 cells.
(A) In vitro nitrite uptake assay of STM (WT), ΔompA, ΔompAΔompC, ΔompAΔompD, ΔompAΔompF, & PFA fixed dead bacteria (n = 3, N = 6). (B) In vitro viability assay of STM (WT), ΔompA, ΔompAΔompC, ΔompAΔompD, & ΔompAΔompF in the presence of acidified nitrite at 12 hours post-inoculation using resazurin solution (n = 3, N = 3). (C) Immunofluorescence image of STM (WT), ΔompA, ΔompAΔompC, ΔompAΔompD, ΔompAΔompF, & (WT): LLO (MOI 20) in RAW264.7 cells to study the recruitment of nitrotyrosine. The colocalization coefficient of bacteria with nitrotyrosine was represented as a vertical bar graph (n≥60, N = 3). Scale bar = 5μm. (D) Calculating the fold proliferation of STM (WT), ΔompA, ΔompAΔompC, ΔompAΔompD, & ΔompAΔompF, & (WT): LLO respectively (MOI 10) in RAW264.7 cells (n = 3, N = 2). (E) Estimating the level of intracellular NO in RAW 264.7 cells infected with STM (WT), ΔompA, ΔompA:pQE60-ompA, ΔompAΔompC, ΔompAΔompD, ΔompAΔompF, and (WT): LLO respectively at MOI 10 using DAF-2DA [5 μM] by flow cytometry. Both dot plots (SSC-A vs. DAF-2 DA) and histograms (Count vs. DAF-2 DA) were represented. The percent population of DAF-2DA positive macrophages has been represented in a bar graph (n≥3, N = 5). Data are represented as mean ± SEM. (P) *< 0.05, (P) **< 0.005, (P) ***< 0.0005, (P) ****< 0.0001, ns = non-significant, (Unpaired student’s t test in A and one-way ANOVA in B, C, D, E).
Fig 8
Fig 8. The hypothetical working model of intracellular survival of STM (WT), STM ΔompA, and STM (WT): LLO.
The hypothetical model depicts the fate of (A) STM (WT), (B) STM ΔompA, and (C) STM (WT): LLO inside the murine macrophages. (A) STM (WT) staying inside the acidic SCV can proliferate efficiently by suppressing the activity of iNOS by SPI-2 encoded virulent factors SpiC. The acidification of the cytosol of wild-type bacteria due to the acidic pH of SCV triggers the expression of SPI-2 genes. (B) STM ΔompA, deficient in expressing SPI-2 effector genes sifA and ssaV, comes into the cytosol of macrophages after disrupting the SCV. It is unable to produce SpiC and cannot suppress the activity of iNOS. The enhanced outer membrane permeability of the cytosolic population of STM ΔompA due to the upregulation of ompF makes them vulnerable to RNI. (C) STM (WT): LLO exits the SCV by expressing LLO. Unlike STM (WT), the cytosolic niche of STM (WT): LLO cannot produce SpiC. It can protect itself from RNI by reducing its outer membrane permeability by expressing ompA and surviving efficiently in the cytosol.

Similar articles

Cited by

References

    1. Vergalli J, Bodrenko IV, Masi M, Moynie L, Acosta-Gutierrez S, Naismith JH, et al.. Porins and small-molecule translocation across the outer membrane of Gram-negative bacteria. Nat Rev Microbiol. 2020;18(3):164–76. doi: 10.1038/s41579-019-0294-2 . - DOI - PubMed
    1. Koebnik R, Locher KP, Van Gelder P. Structure and function of bacterial outer membrane proteins: barrels in a nutshell. Mol Microbiol. 2000;37(2):239–53. doi: 10.1046/j.1365-2958.2000.01983.x . - DOI - PubMed
    1. March C, Moranta D, Regueiro V, Llobet E, Tomas A, Garmendia J, et al.. Klebsiella pneumoniae outer membrane protein A is required to prevent the activation of airway epithelial cells. J Biol Chem. 2011;286(12):9956–67. doi: 10.1074/jbc.M110.181008 ; PubMed Central PMCID: PMC3060550. - DOI - PMC - PubMed
    1. Hejair HMA, Zhu Y, Ma J, Zhang Y, Pan Z, Zhang W, et al.. Functional role of ompF and ompC porins in pathogenesis of avian pathogenic Escherichia coli. Microb Pathog. 2017;107:29–37. doi: 10.1016/j.micpath.2017.02.033 . - DOI - PubMed
    1. Krishnan S, Prasadarao NV. Outer membrane protein A and OprF: versatile roles in Gram-negative bacterial infections. FEBS J. 2012;279(6):919–31. doi: 10.1111/j.1742-4658.2012.08482.x ; PubMed Central PMCID: PMC3338869. - DOI - PMC - PubMed

Publication types

MeSH terms