Deciphering the Emulsification Process to Create an Albumin-Perfluorocarbon-(o/w) Nanoemulsion with High Shelf Life and Bioresistivity
- PMID: 35969658
- PMCID: PMC9435530
- DOI: 10.1021/acs.langmuir.1c03388
Deciphering the Emulsification Process to Create an Albumin-Perfluorocarbon-(o/w) Nanoemulsion with High Shelf Life and Bioresistivity
Abstract
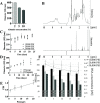
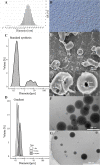
This work aimed at the development of a stable albumin-perfluorocarbon (o/w) emulsion as an artificial oxygen carrier suitable for clinical application. So far, albumin-perfluorocarbon-(o/w) emulsions have been successfully applied in preclinical trials. Cross-linking a variety of different physical and chemical methods for the characterization of an albumin-perfluorocarbon (PFC)-(o/w) emulsion was necessary to gain a deep understanding of its specific emulsification processes during high-pressure homogenization. High-pressure homogenization is simple but incorporates complex physical reactions, with many factors influencing the formation of PFC droplets and their coating. This work describes and interprets the impact of albumin concentration, homogenization pressure, and repeated microfluidizer passages on PFC-droplet formation; its influence on storage stability; and the overcoming of obstacles in preparing stable nanoemulsions. The applied methods comprise dynamic light scattering, static light scattering, cryo- and non-cryo-scanning and transmission electron microscopies, nuclear magnetic resonance spectroscopy, light microscopy, amperometric oxygen measurements, and biochemical methods. The use of this wide range of methods provided a sufficiently comprehensive picture of this polydisperse emulsion. Optimization of PFC-droplet formation by means of temperature and pressure gradients results in an emulsion with improved storage stability (tested up to 5 months) that possibly qualifies for clinical applications. Adaptations in the manufacturing process strikingly changed the physical properties of the emulsion but did not affect its oxygen capacity.
Conflict of interest statement
The authors declare the following competing financial interest(s): Dr. Johannes Jaegers, Dr. Sven Haferkamp, Dr. Oliver Arnolds, Fabian Nocke, Dr. Miriam Cantore, Stefanie Pütz, Dr. Carsten Schauerte, Prof. Raphael Stoll, Prof. Michael Kirsch and Prof. Katja Ferenz are holders of the patent application Organ life fluid - Bioactive perfusion medium for the normothermic perfusion and regeneration of isolated human kidneys German docket number: 102021211272.2.
Figures


Similar articles
-
Monitoring the Stability of Perfluorocarbon Nanoemulsions by Cryo-TEM Image Analysis and Dynamic Light Scattering.PLoS One. 2015 Jun 22;10(6):e0130674. doi: 10.1371/journal.pone.0130674. eCollection 2015. PLoS One. 2015. PMID: 26098661 Free PMC article.
-
Preparation of perfluorocarbon emulsions by premix membrane emulsification for Acoustic Droplet Vaporization (ADV) in biomedical applications.Biomed Microdevices. 2020 Sep 3;22(3):62. doi: 10.1007/s10544-020-00504-5. Biomed Microdevices. 2020. PMID: 32880712
-
Rational manufacturing of functionalized, long-term stable perfluorocarbon-nanoemulsions for site-specific 19F magnetic resonance imaging.Eur J Pharm Biopharm. 2019 Sep;142:114-122. doi: 10.1016/j.ejpb.2019.06.014. Epub 2019 Jun 18. Eur J Pharm Biopharm. 2019. PMID: 31220572
-
Perfluorocarbon-based oxygen carriers: from physics to physiology.Pflugers Arch. 2021 Feb;473(2):139-150. doi: 10.1007/s00424-020-02482-2. Epub 2020 Nov 3. Pflugers Arch. 2021. PMID: 33141239 Free PMC article. Review.
-
Perfluorocarbon nanoemulsions in drug delivery: design, development, and manufacturing.Theranostics. 2025 Feb 10;15(7):3013-3034. doi: 10.7150/thno.103820. eCollection 2025. Theranostics. 2025. PMID: 40083944 Free PMC article. Review.
Cited by
-
Combination of biodegradable hydrogel and antioxidant bioadhesive for treatment of breast cancer recurrence and radiation skin injury.Bioact Mater. 2023 Sep 2;31:408-421. doi: 10.1016/j.bioactmat.2023.08.021. eCollection 2024 Jan. Bioact Mater. 2023. PMID: 37692912 Free PMC article.
-
Engineering Synthetic Erythrocytes as Next-Generation Blood Substitutes.Adv Funct Mater. 2024 Jul 10;34(28):2315879. doi: 10.1002/adfm.202315879. Epub 2024 Feb 8. Adv Funct Mater. 2024. PMID: 39386164 Free PMC article.
-
Laminar and turbulent flow effects in high-pressure homogenization of liposomes and perfluorocarbon nanoemulsions.Sci Rep. 2024 Nov 13;14(1):27856. doi: 10.1038/s41598-024-78550-9. Sci Rep. 2024. PMID: 39537716 Free PMC article.
-
Oxygen carriers affect kidney immunogenicity during ex-vivo machine perfusion.Front Transplant. 2023 Jun 16;2:1183908. doi: 10.3389/frtra.2023.1183908. eCollection 2023. Front Transplant. 2023. PMID: 38993849 Free PMC article.
-
Recent advances in micro-sized oxygen carriers inspired by red blood cells.Sci Technol Adv Mater. 2023 Jun 22;24(1):2223050. doi: 10.1080/14686996.2023.2223050. eCollection 2023. Sci Technol Adv Mater. 2023. PMID: 37363800 Free PMC article. Review.
References
-
- Smart B. E.Characteristics of CF Systems. In Organofluorine Chemistry, Banks R. E.; Smart B. E.; Tatlow J. C., Eds.; Springer-Verlag: US Boston, MA, 1994; pp 57–88.
-
- Dias A. M. A.; Freire M.; Coutinho J. A. P.; Marrucho I. M. Solubility of oxygen in liquid perfluorocarbons. Fluid Phase Equilib. 2004, 222–223, 325–330. 10.1016/j.fluid.2004.06.037. - DOI
Publication types
MeSH terms
Substances
LinkOut - more resources
Full Text Sources
Other Literature Sources
Miscellaneous

