. 2022 Aug 23;119(34):e2203208119.
doi: 10.1073/pnas.2203208119. Epub 2022 Aug 15.

Transcription-replication conflicts in primordial germ cells necessitate the Fanconi anemia pathway to safeguard genome stability

Affiliations

Transcription-replication conflicts in primordial germ cells necessitate the Fanconi anemia pathway to safeguard genome stability

Yajuan Yang et al. Proc Natl Acad Sci U S A. .

Abstract

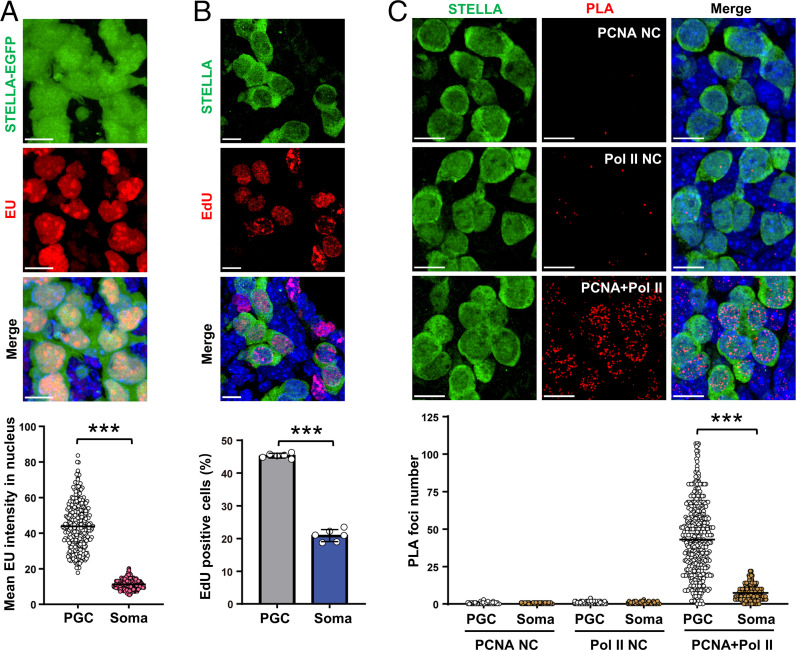
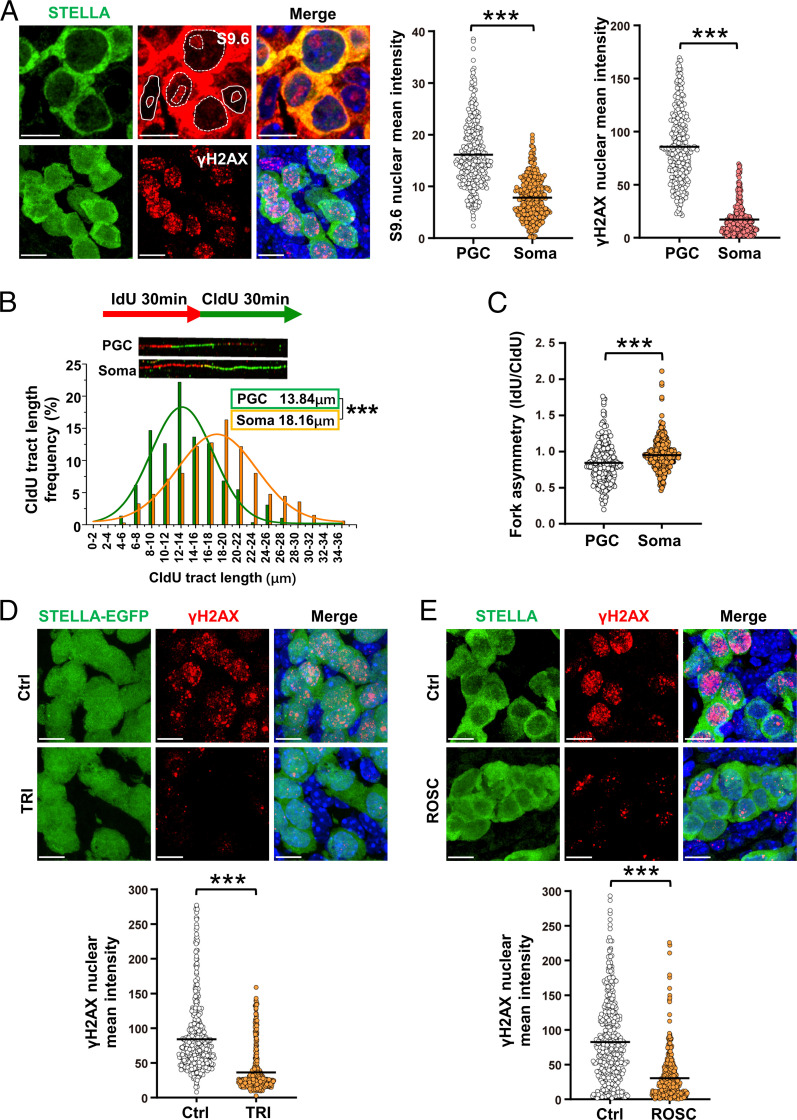
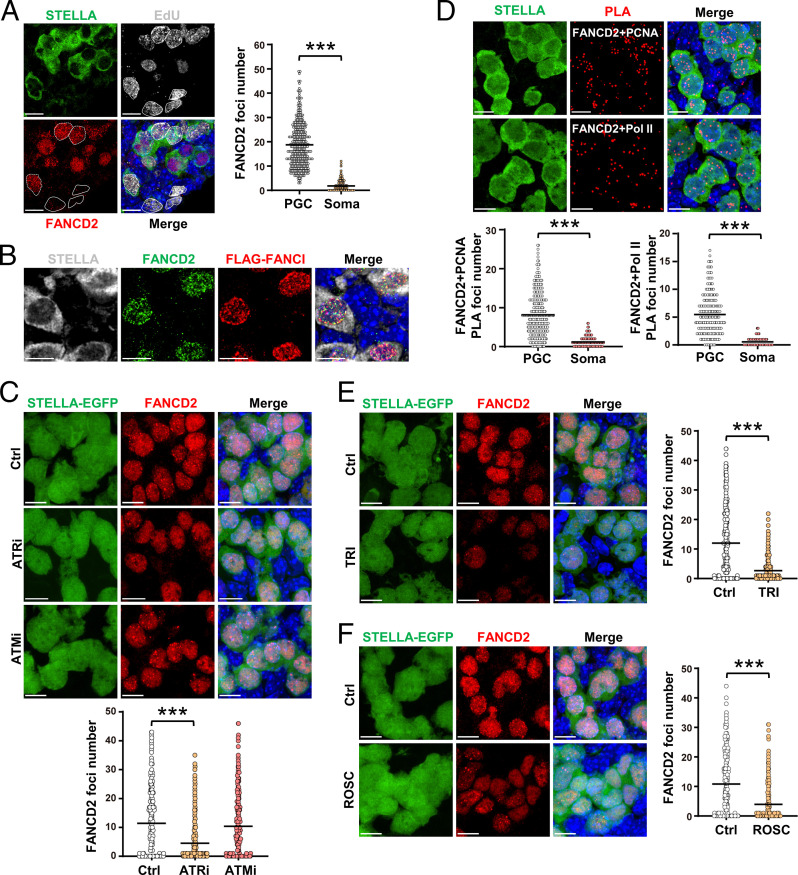
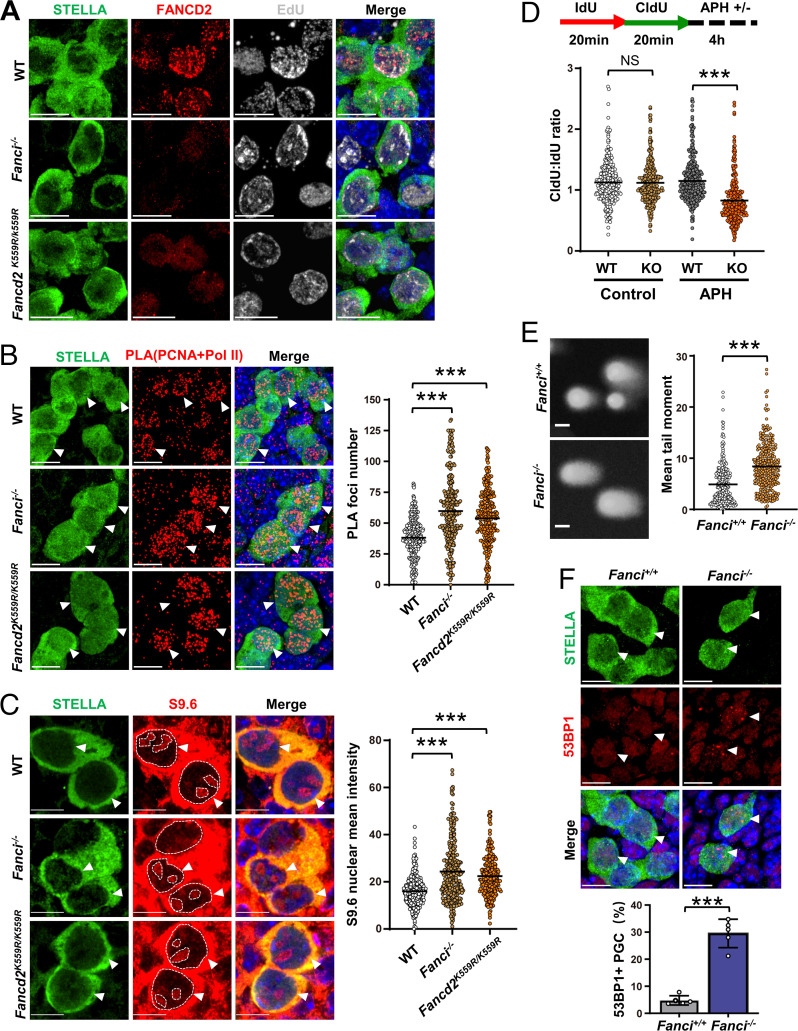
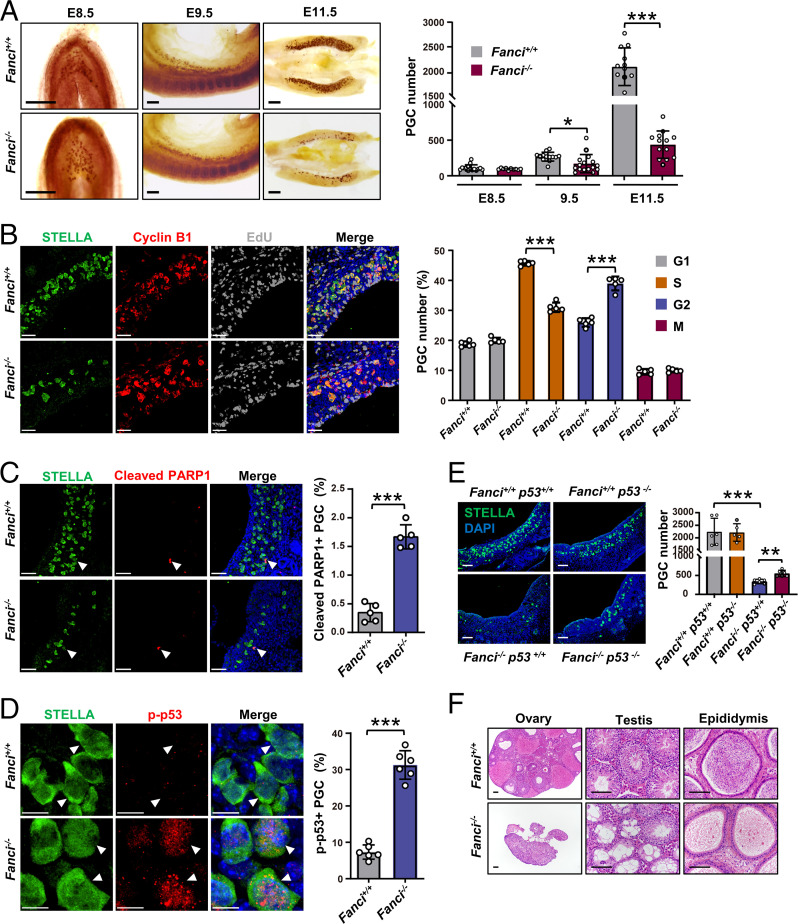
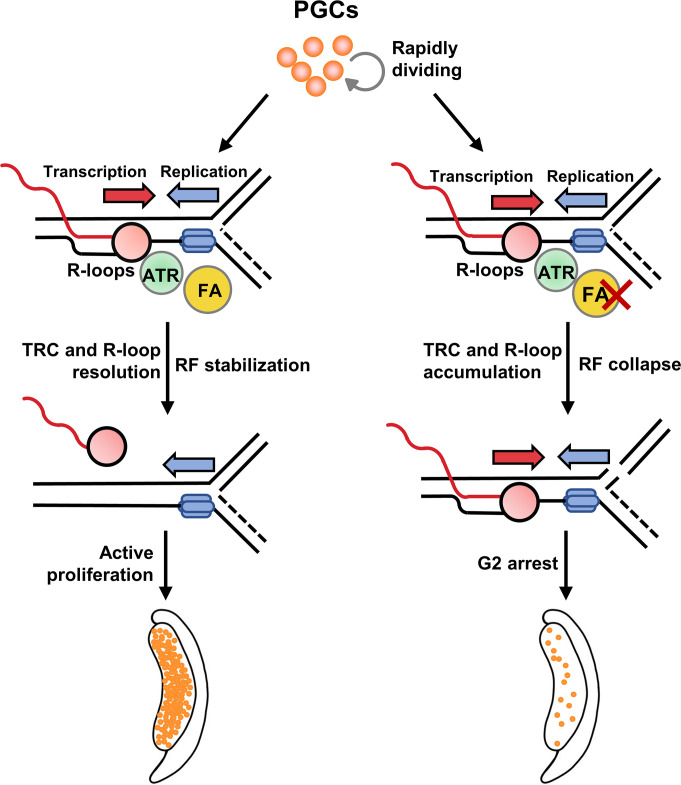
Preserving a high degree of genome integrity and stability in germ cells is of utmost importance for reproduction and species propagation. However, the regulatory mechanisms of maintaining genome stability in the developing primordial germ cells (PGCs), in which rapid proliferation is coupled with global hypertranscription, remain largely unknown. Here, we find that mouse PGCs encounter a constitutively high frequency of transcription-replication conflicts (TRCs), which lead to R-loop accumulation and impose endogenous replication stress on PGCs. We further demonstrate that the Fanconi anemia (FA) pathway is activated by TRCs and has a central role in the coordination between replication and transcription in the rapidly proliferating PGCs, as disabling the FA pathway leads to TRC and R-loop accumulation, replication fork destabilization, increased DNA damage, dramatic loss of mitotically dividing mouse PGCs, and consequent sterility of both sexes. Overall, our findings uncover the unique source and resolving mechanism of endogenous replication stress during PGC proliferation, provide a biological explanation for reproductive defects in individuals with FA, and improve our understanding of the monitoring strategies for genome stability during germ cell development.

Keywords: Fanconi anemia pathway; genome stability; primordial germ cells; replication stress; transcription–replication conflicts.


Conflict of interest statement

The authors declare no competing interest.

Figures

Fig. 1.
Fig. 1.
A high transcriptional output and proliferation rate cause frequent TRCs in PGCs. (A) The transcriptional output was evaluated by EU incorporation in E11.5 genital ridges. n = 300/300 cells. (B) The proliferation rate was evaluated by EdU incorporation in E11.5 genital ridges. n = 6/6 embryos. (C) Representative images and enumeration of PCNA-Pol II PLA foci per nucleus in PGCs and somatic cells from E11.5 genital ridges. Staining for PCNA alone and Pol II alone served as single-antibody negative controls (NC). The individual red fluorescence focus represents a conflict event between replication and transcription machinery, and the foci number indicates TRC frequency. n = 300/300/300/300/300/300 cells. STELLA or STELLA-EGFP positivity indicates PGC, and STELLA negativity indicates soma. Data from individual embryos or cells are presented as dots; mean values (A and C) and the means ± SD (B) are marked. (Scale bars, 10 μm.) ***P < 0.001; unpaired two-tailed Student’s t test (AC).
Fig. 2.
Fig. 2.
A high frequency of TRCs imposes constitutive replication stress on PGCs. (A) Immunofluorescence staining and quantification of R-loop (recognized by the S9.6 antibody with signals in nucleolus excluded) and γH2AX nuclear signal (a marker for replication stress) intensity in E11.5 PGCs and somatic cells. n = 300/300/300/300 cells. (B) DNA fiber assay in FACS-sorted E11.5 PGCs and somatic cells, measuring the CldU track length (nascent DNA) to evaluate the velocity of RFs. n = 300/300 DNA fibers. (C) The IdU/CldU ratio was calculated to assess the asymmetry of RFs. n = 300/300 DNA fibers. (D and E) Representative images and mean fluorescence intensity quantification of γH2AX staining in E11.5 PGCs treated with a transcription inhibitor (TRI) for 3 h (D) or replication inhibitor (ROSC) for 8 h (E). n = 300/300/300/300 cells. STELLA or STELLA-EGFP positivity indicates PGC, and STELLA negativity indicates soma. Data from individual cells or DNA fibers are presented as dots, and the mean values are marked. Ctrl, control. (Scale bars, 10 μm.) ***P < 0.001; unpaired two-tailed Student’s t test (AE).
Fig. 3.
Fig. 3.
TRCs activate the FA pathway in PGCs. (A) FANCD2 immunostaining and EdU incorporation in E11.5 genital ridges, and FANCD2 foci number was quantified in EdU-positive PGCs and somatic cells. n=300/300 cells. (B) Double immunostaining for FANCD2 and FLAG-FANCI in E11.5 genital ridges. (C) Immunostaining and quantification of FANCD2 foci in PGCs in cultured E11.5 genital ridges treated with an ATR inhibitor (ATRi) or ATM inhibitor (ATMi). n = 300/300/300 cells. (D) Representative images and quantification of FANCD2-PCNA PLA foci and FANCD2-Pol II PLA foci per nucleus in PGCs and somatic cells from E11.5 genital ridges. The red fluorescence foci indicate the location of the two target proteins in close proximity. n = 300/300/300/300 cells. (E and F) Representative images and quantification of FANCD2 foci in PGCs from cultured E11.5 genital ridges treated with transcription inhibitor (TRI) for 3 h (E) or replication inhibitor (ROSC) for 8 h (F). n = 300/300/300/300 cells. STELLA or STELLA-EGFP positivity denotes PGC; STELLA negative indicates soma. Data points from individual cells are presented as dots. The means are indicated (A, and CF). (Scale bars, 10 μm.) Ctrl, control. ***P < 0.001; unpaired two-tailed Student’s t test (A, and CF).
Fig. 4.
Fig. 4.
FA pathway inactivation results in aggravated TRCs, R-loop accumulation, and DNA damage in PGCs. (A) Representative images of costaining with FANCD2 and EdU in wild-type, Fanci−/− and Fancd2K559R/K559R E11.5 genital ridges. (B) Representative images and quantification of PCNA-Pol II PLA foci per nucleus in wild-type, Fanci−/−, and Fancd2K559R/K559R PGCs in E11.5 genital ridges. The quantification of red fluorescence foci indicates the TRC frequency. n = 300/300/300 cells. (C) Representative images and quantitation of R-loop nuclear signal intensity (recognized by the S9.6 antibody with signals in nucleolus excluded) in wild-type, Fanci−/−, and Fancd2K559R/K559R PGCs from E11.5 genital ridges. n = 300/300/300 cells. (D) DNA fiber assay showing the ratio of CldU and IdU track length in wild-type and Fanci−/− MEFs treated with APH (1 μM) for the indicated times. n = 300/300/300/300 DNA fibers. (E) Neutral comet assay of E11.5 magnetic beads sorted wild-type and Fanci−/− PGCs. n = 400/400 nuclei. (F) Representative images of 53BP1 foci (DSB marker) and the percentage of 53BP1 foci-positive PGCs in E11.5 genital ridges. n = 5/5 embryos. STELLA positivity denotes PGC. WT, wild-type; KO, Fanci−/−. Dots represent individual data points. The means (BE) or means ± SD (F) are presented. (Scale bars, 10 μm.) Arrowheads indicate representative cells. NS, no significance, ***P < 0.001; unpaired two-tailed Student’s t test (BF).
Fig. 5.
Fig. 5.
The FA pathway is indispensable for PGC proliferation and fertility. (A) Alkaline phosphatase staining of whole-mount or genital ridges from wild-type and Fanci−/− mice and PGC counts at various embryonic stages as indicated. The reddish-brown spots indicate PGCs. n = 15/10/13/16/12/14 embryos. (B) Immunofluorescence staining of cyclin B1 and EdU incorporation in E11.5 wild-type and Fanci−/− genital ridges to evaluate the cell cycle progression of PGCs (G1, cyclin B1 negative; S, EdU positive; G2, cyclin B1 strongly positive in cytoplasm; M, cyclin B1 accumulation in the nucleus). n = 5/5 embryos. (C) Cleaved PARP1 immunostaining (an apoptotic marker) in E11.5 wild-type and Fanci−/− genital ridges to evaluate the apoptotic PGCs (STELLA and cleaved PARP1 double positive). n = 5/5 embryos. (D) Representative images of p-p53 immunostaining and quantification of the percentage of p-p53–positive PGCs in E11.5 genital ridges from wild-type and Fanci−/− embryos. n = 6/6 embryos. (E) Deletion of p53 to rescue the reduction in the number of PGCs in E11.5 Fanci−/− embryos. STELLA immunostaining to quantify the PGC number in the genital ridges with the indicated genotypes. n = 6/5/6/6 embryos. (F) Hematoxylin and eosin staining of wild-type and Fanci−/− paraffin sections of ovaries from 12-wk-old females and testes and epididymis from 10-wk-old males. Alkaline phosphatase staining or STELLA positivity indicates PGC. Data points from individual embryos are presented as dots. Data are presented as the means ± SD (AE). (Scale bars, 200 μm in A; 50 μm in B, C, E, and F; and 10 μm in D.) Arrowheads indicate representative cells. *P < 0.05, **P < 0.01, ***P < 0.001; unpaired two-tailed Student’s t test (AE).
Fig. 6.
Fig. 6.
The working model of how the FA pathway orchestrates PGC development. PGCs encounter frequent TRCs during rapid division, and TRCs impede replication and transcription progression, causing frequent RF stalling and R-loop accumulation. Consequently, ATR kinase activates the FA pathway to handle TRCs and R-loops and stabilize stalled RFs. The obstacle is removed and forks restart following FA pathway activation to ensure faithful replication of genome, thus maintaining PGC genome stability during their active proliferation stage. When the FA pathway is disrupted, a failure to resolve TRCs and R-loops in a timely manner and destabilization of stalled forks result in fork collapse and DNA damage. The accumulation of DNA damage activates p53 signaling to trigger G2-phase arrest of PGCs. Prolonged G2 phase impairs cell expansion and ultimately leads to a dramatic loss of PGCs.

Similar articles

Cited by

References

    1. Saitou M., Yamaji M., Primordial germ cells in mice. Cold Spring Harb. Perspect. Biol. 4, a008375 (2012). - PMC - PubMed
    1. Murphey P., McLean D. J., McMahan C. A., Walter C. A., McCarrey J. R., Enhanced genetic integrity in mouse germ cells. Biol. Reprod. 88, 6 (2013). - PMC - PubMed
    1. Milholland B., et al. , Differences between germline and somatic mutation rates in humans and mice. Nat. Commun. 8, 15183 (2017). - PMC - PubMed
    1. Rinaldi V. D., Bolcun-Filas E., Kogo H., Kurahashi H., Schimenti J. C., The DNA damage checkpoint eliminates mouse oocytes with chromosome synapsis failure. Mol. Cell 67, 1026–1036.e2 (2017). - PMC - PubMed
    1. Suh E. K., et al. , p63 protects the female germ line during meiotic arrest. Nature 444, 624–628 (2006). - PubMed

Publication types

LinkOut - more resources