

Comparative genomics uncovers the evolutionary history, demography, and molecular adaptations of South American canids
- PMID: 35969758
- PMCID: PMC9407222
- DOI: 10.1073/pnas.2205986119
Comparative genomics uncovers the evolutionary history, demography, and molecular adaptations of South American canids
Abstract
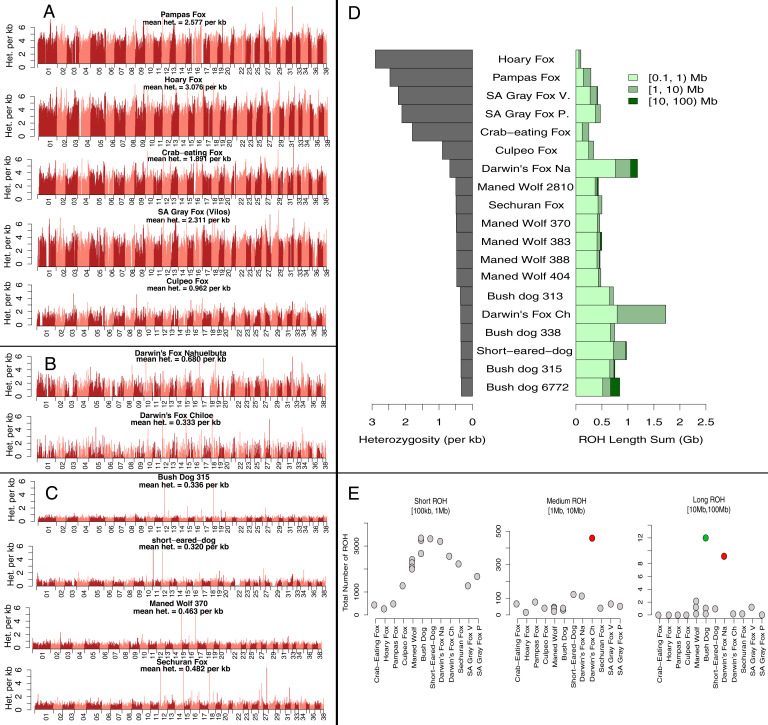
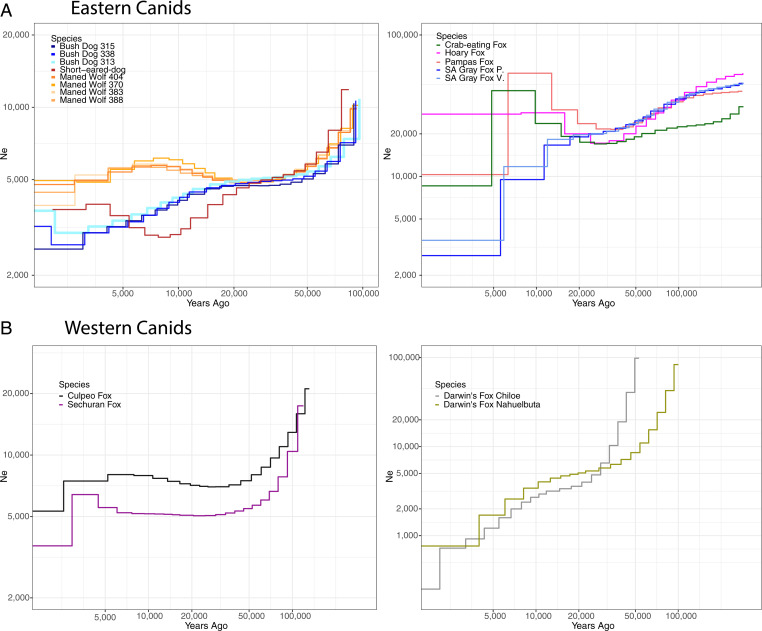
The remarkable radiation of South American (SA) canids produced 10 extant species distributed across diverse habitats, including disparate forms such as the short-legged, hypercarnivorous bush dog and the long-legged, largely frugivorous maned wolf. Despite considerable research spanning nearly two centuries, many aspects of their evolutionary history remain unknown. Here, we analyzed 31 whole genomes encompassing all extant SA canid species to assess phylogenetic relationships, interspecific hybridization, historical demography, current genetic diversity, and the molecular bases of adaptations in the bush dog and maned wolf. We found that SA canids originated from a single ancestor that colonized South America 3.9 to 3.5 Mya, followed by diversification east of the Andes and then a single colonization event and radiation of Lycalopex species west of the Andes. We detected extensive historical gene flow between recently diverged lineages and observed distinct patterns of genomic diversity and demographic history in SA canids, likely induced by past climatic cycles compounded by human-induced population declines. Genome-wide scans of selection showed that disparate limb proportions in the bush dog and maned wolf may derive from mutations in genes regulating chondrocyte proliferation and enlargement. Further, frugivory in the maned wolf may have been enabled by variants in genes associated with energy intake from short-chain fatty acids. In contrast, unique genetic variants detected in the bush dog may underlie interdigital webbing and dental adaptations for hypercarnivory. Our analyses shed light on the evolution of a unique carnivoran radiation and how it was shaped by South American topography and climate change.
Keywords: Canidae; South America; genomes; neotropics; positive selection.
Conflict of interest statement
The authors declare no competing interest.
Figures


Similar articles
-
Ecogeographical Variation in Skull Shape of South-American Canids: Abiotic or Biotic Processes?Evol Biol. 2016;43:145-159. doi: 10.1007/s11692-015-9362-3. Epub 2015 Dec 7. Evol Biol. 2016. PMID: 27217595 Free PMC article.
-
The evolution of South American endemic canids: a history of rapid diversification and morphological parallelism.J Evol Biol. 2010 Feb;23(2):311-22. doi: 10.1111/j.1420-9101.2009.01901.x. Epub 2009 Nov 26. J Evol Biol. 2010. PMID: 20002250
-
A molecular phylogeny of the Canidae based on six nuclear loci.Mol Phylogenet Evol. 2005 Dec;37(3):815-31. doi: 10.1016/j.ympev.2005.07.019. Epub 2005 Oct 5. Mol Phylogenet Evol. 2005. PMID: 16213754
-
The repertoire of bitter taste receptor genes in canids.Amino Acids. 2017 Jul;49(7):1159-1167. doi: 10.1007/s00726-017-2422-5. Epub 2017 Apr 17. Amino Acids. 2017. PMID: 28417226 Review.
-
Comparative genomics of 3 farm canids in relation to the dog.Cytogenet Genome Res. 2009;126(1-2):86-96. doi: 10.1159/000245909. Epub 2009 Dec 9. Cytogenet Genome Res. 2009. PMID: 20016159 Review.
Cited by
-
Sarcocystis spp. of New and Old World Camelids: Ancient Origin, Present Challenges.Pathogens. 2024 Feb 23;13(3):196. doi: 10.3390/pathogens13030196. Pathogens. 2024. PMID: 38535539 Free PMC article. Review.
-
Climate influence on the early human occupation of South America during the late Pleistocene.Nat Commun. 2025 Mar 21;16(1):2780. doi: 10.1038/s41467-025-58134-5. Nat Commun. 2025. PMID: 40118848 Free PMC article.
-
Extensive Phylogenomic Discordance and the Complex Evolutionary History of the Neotropical Cat Genus Leopardus.Mol Biol Evol. 2023 Dec 1;40(12):msad255. doi: 10.1093/molbev/msad255. Mol Biol Evol. 2023. PMID: 37987559 Free PMC article.
-
Computationally Efficient Demographic History Inference from Allele Frequencies with Supervised Machine Learning.Mol Biol Evol. 2024 May 3;41(5):msae077. doi: 10.1093/molbev/msae077. Mol Biol Evol. 2024. PMID: 38636507 Free PMC article.
-
Elucidating Spirocerca lupi spread in the Americas by using phylogenetic and phylogeographic analyses.Front Parasitol. 2023 Sep 27;2:1249593. doi: 10.3389/fpara.2023.1249593. eCollection 2023. Front Parasitol. 2023. PMID: 39816839 Free PMC article.
References
-
- Simpson G. G., Splendid Isolation - The Curious History of South American Mammals (Yale University Press, New Haven, CT, 1980).
-
- Castelló J. R., Canids of the World: Wolves, Wild Dogs, Foxes, Jackals, Coyotes, and Their Relatives (Princeton University Press, 2018).
Publication types
MeSH terms
Grants and funding
LinkOut - more resources
Full Text Sources
Miscellaneous
