. 2022 Aug 23;119(34):e2200652119.
doi: 10.1073/pnas.2200652119. Epub 2022 Aug 15.

The effectiveness of COVID-19 testing and contact tracing in a US city

Affiliations

The effectiveness of COVID-19 testing and contact tracing in a US city

Xutong Wang et al. Proc Natl Acad Sci U S A. .

Abstract

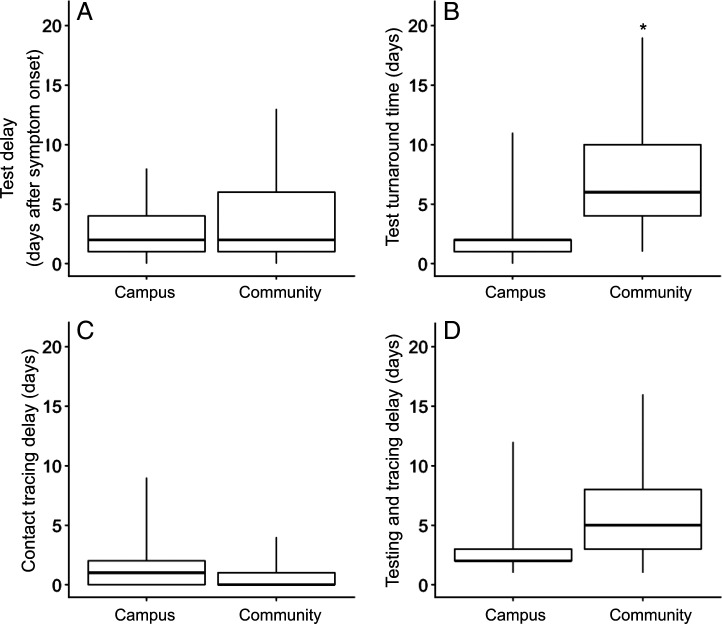
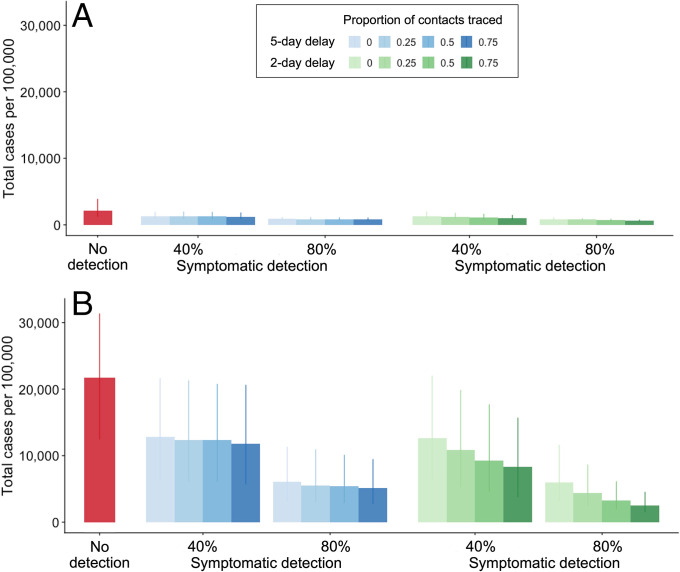
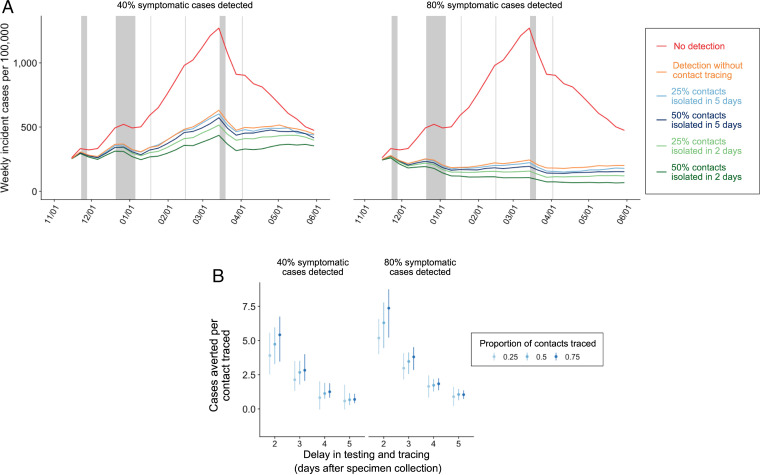
Although testing, contact tracing, and case isolation programs can mitigate COVID-19 transmission and allow the relaxation of social distancing measures, few countries worldwide have succeeded in scaling such efforts to levels that suppress spread. The efficacy of test-trace-isolate likely depends on the speed and extent of follow-up and the prevalence of SARS-CoV-2 in the community. Here, we use a granular model of COVID-19 transmission to estimate the public health impacts of test-trace-isolate programs across a range of programmatic and epidemiological scenarios, based on testing and contact tracing data collected on a university campus and surrounding community in Austin, TX, between October 1, 2020, and January 1, 2021. The median time between specimen collection from a symptomatic case and quarantine of a traced contact was 2 days (interquartile range [IQR]: 2 to 3) on campus and 5 days (IQR: 3 to 8) in the community. Assuming a reproduction number of 1.2, we found that detection of 40% of all symptomatic cases followed by isolation is expected to avert 39% (IQR: 30% to 45%) of COVID-19 cases. Contact tracing is expected to increase the cases averted to 53% (IQR: 42% to 58%) or 40% (32% to 47%), assuming the 2- and 5-day delays estimated on campus and in the community, respectively. In a tracing-accelerated scenario, in which 75% of contacts are notified the day after specimen collection, cases averted increase to 68% (IQR: 55% to 72%). An accelerated contact tracing program leveraging rapid testing and electronic reporting of test results can significantly curtail local COVID-19 transmission.

Keywords: COVID-19; COVID-19 testing; contact tracing; mathematical model; pandemic.


Conflict of interest statement

The authors declare no competing interest.

Figures

Fig. 1.
Fig. 1.
Delays associated with seeking test, test turnaround, and contact tracing of cases reported from community and campus testing sites from October 1, 2020, to January 1, 2021, in Austin, TX. (A) Delay from symptom onset to specimen collection from an index case. (B) Delay from specimen collection from an index case, to report of the index case to contact tracing. (C) Delay from report of an index case to notification of exposure to contacts. (D) Delay from specimen collection from an index case to notification of exposure to contacts. Boxplots display medians, IQRs, and ranges; the star in B indicates an outlier from community testing sites.
Fig. 2.
Fig. 2.
Expected COVID-19 attack rate from November 8, 2020, to May 31, 2021, across a range of scenarios for case detection and proportion of contacts traced, assuming reproduction numbers of (A) R0 = 0.95 and (B) R0 = 1.2. Red bars represent the projected number of COVID-19 cases per 100,000 in the absence of testing. The left and right sets of bars correspond to 40% and 80% symptomatic case detection rates, respectively, assuming that detected cases seek a test 2 days after symptom onset and isolate at the time of specimen collection for the duration of their infectious period. Blue and green shading ranges from no contact tracing (light) to 75% of contacts isolated (dark) either 5 days (blue) or 2 days (green) after specimen collection from the index case. Bars and whiskers are medians and IQRs from 200 stochastic simulations, respectively.
Fig. 3.
Fig. 3.
Expected COVID-19 incidence and cases averted per contact traced from November 8, 2020, to May 31, 2021, across a range of case detection and contact tracing scenarios, assuming R0 = 1.2. (A) Median estimated weekly incident COVID-19 cases across 200 stochastic simulations. Red curves correspond to the no testing or tracing scenario. Left and Right assume 40% and 80% of all symptomatics are detected and isolated, respectively. Orange curves correspond to testing without tracing, blue curves assume 25% or 50% of the contacts of the confirmed cases are traced and isolated 5 days after the isolation of the confirmed case, and green curves assume 25% or 50% of the contacts of the confirmed cases are traced and isolated after 2 days. The gray vertical shading represents Thanksgiving break, winter break, and spring break for the local school district, and the other vertical lines represent other school holidays including Martin Luther King Day, Presidents’ Day, and Easter (32). (B) Number of COVID-19 cases averted per contact successfully traced as a function of lag from specimen collection from the index case to isolation of the contact. Left and Right assume 40% and 80% of symptomatic cases are detected, respectively. The blue shading indicates contact tracing success rates of 25%, 50%, or 75%. The points are medians from 200 paired stochastic simulations, and the error bars are IQRs.

Similar articles

Cited by

References

    1. Wan W., WHO declares a pandemic of coronavirus disease covid-19. The Washington Post, 11 March 2020. https://www.washingtonpost.com/health/2020/03/11/who-declares-pandemic-c.... Accessed 25 March 2020.
    1. World Health Organization, WHO Coronavirus (COVID-19) Dashboard. https://covid19.who.int/. Accessed 30 August 2021.
    1. MITRE Corporation, COVID-19 Healthcare Coalition. https://c19hcc.org/. Accessed 9 December 2020.
    1. Nicola M., et al. , The socio-economic implications of the coronavirus pandemic (COVID-19): A review. Int. J. Surg. 78, 185–193 (2020). - PMC - PubMed
    1. Galea S., Merchant R. M., Lurie N., The mental health consequences of COVID-19 and physical distancing: The need for prevention and early intervention. JAMA Intern. Med. 180, 817–818 (2020). - PubMed

Publication types