. 2022 Aug 23;119(34):e2207392119.
doi: 10.1073/pnas.2207392119. Epub 2022 Aug 15.

Inferring gene regulation from stochastic transcriptional variation across single cells at steady state

Affiliations

Inferring gene regulation from stochastic transcriptional variation across single cells at steady state

Anika Gupta et al. Proc Natl Acad Sci U S A. .

Abstract

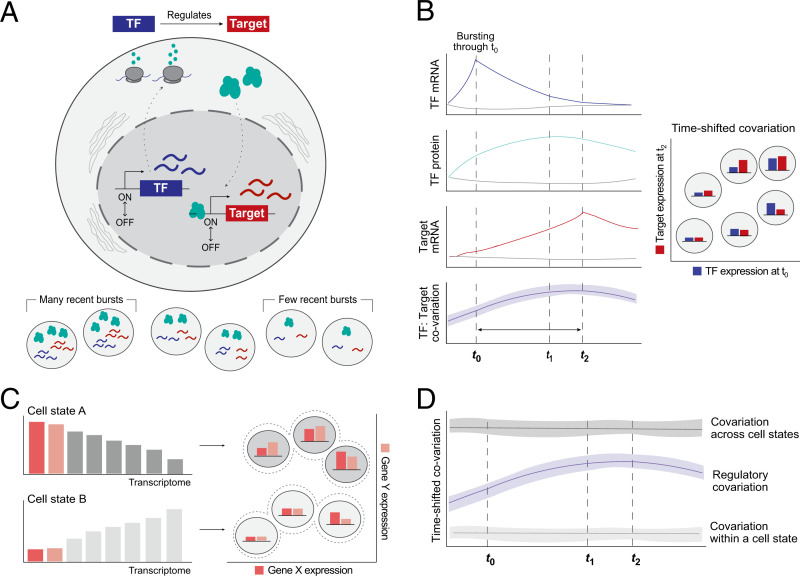
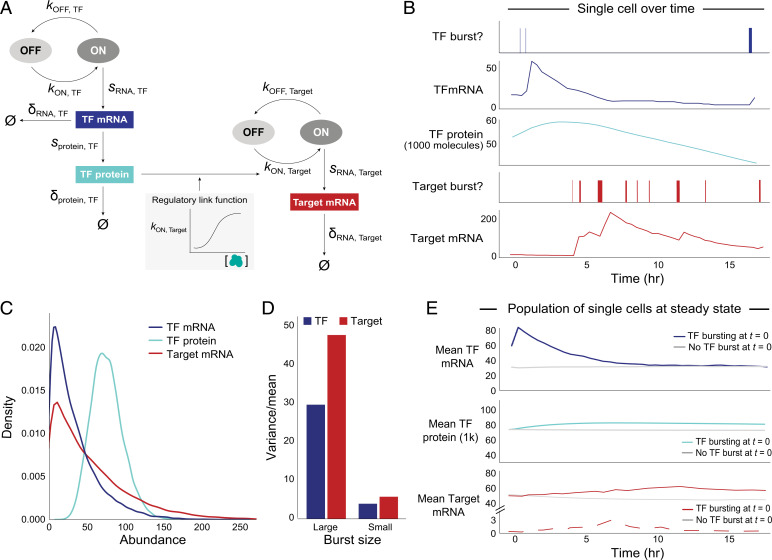
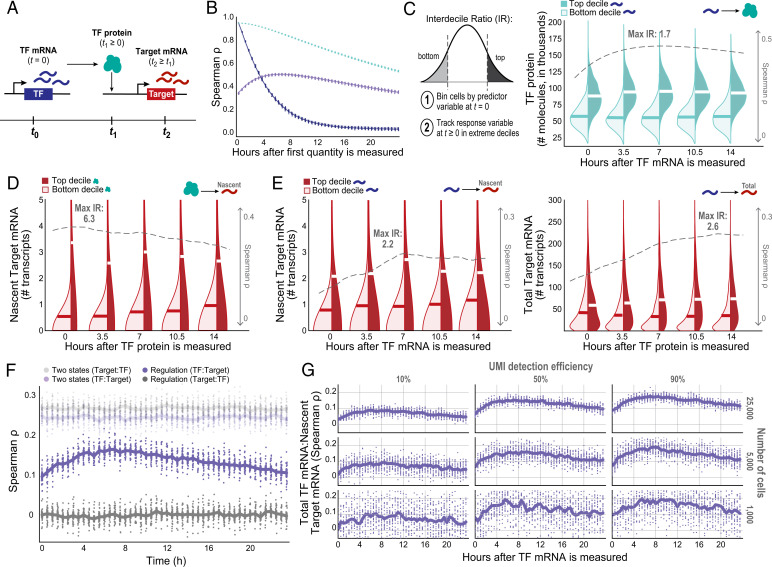
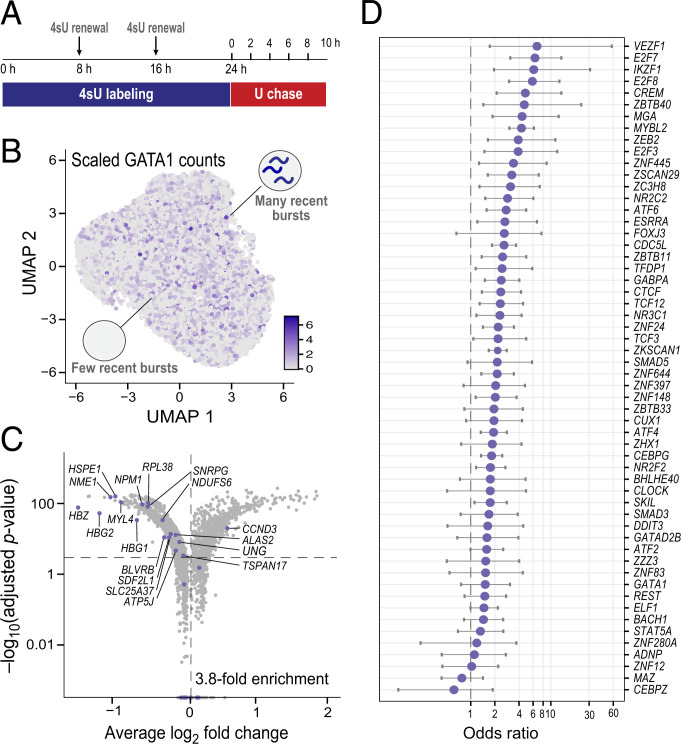
Regulatory relationships between transcription factors (TFs) and their target genes lie at the heart of cellular identity and function; however, uncovering these relationships is often labor-intensive and requires perturbations. Here, we propose a principled framework to systematically infer gene regulation for all TFs simultaneously in cells at steady state by leveraging the intrinsic variation in the transcriptional abundance across single cells. Through modeling and simulations, we characterize how transcriptional bursts of a TF gene are propagated to its target genes, including the expected ranges of time delay and magnitude of maximum covariation. We distinguish these temporal trends from the time-invariant covariation arising from cell states, and we delineate the experimental and technical requirements for leveraging these small but meaningful cofluctuations in the presence of measurement noise. While current technology does not yet allow adequate power for definitively detecting regulatory relationships for all TFs simultaneously in cells at steady state, we investigate a small-scale dataset to inform future experimental design. This study supports the potential value of mapping regulatory connections through stochastic variation, and it motivates further technological development to achieve its full potential.

Keywords: gene regulation; single-cell transcriptomics; transcriptional bursting.


Conflict of interest statement

Competing interest statement: In advance of review, the authors noted that one of the authors (E.S.L.) and one of the reviewers (A.v.O.) were both among more than 80 coauthors on a community white paper describing plans for a Human Cell Atlas that was posted on eLife in December 2017 (https://elifesciences.org/articles/27041). PNAS determined that this connection was tangential and did not constitute recent scientific collaboration relevant to the review process.

Figures

Fig. 1.
Fig. 1.
Overview of the conceptual framework for inferring TF:Target gene regulation from single cells at steady state. (A) Transcriptional bursting leads to stochastic variation in the mRNA abundance of each gene, even within a population of isogenic cells at steady state. We invoke stochastic transcriptional bursting as a source of TF mRNA heterogeneity across steady-state cell populations. If a TF directly regulates a target gene, we hypothesize that their abundances will be correlated. (B) Idealized representation of the hypothesized time-shifted correlation between a TF and its target gene’s mRNA abundances in the presence of regulation. Colored lines indicate the average behavior of cells that had at least one burst of the TF gene; gray lines represent those that did not have a burst. The time delay reflects the time required for TF mRNA translation into protein, translocation, and target site search in the nucleus. From left to right, dotted lines reflect the time of maximal TF mRNA (t0), TF protein (t1), or target mRNA abundance (t2), respectively. (C) Subpopulations of cells (i.e., cell states, such as cells in different stages of the cell cycle) will also give rise to covariation—in this example, due to different baseline mRNA counts for genes in each state. Thus, correlation does not always imply regulation. (D) We can theoretically distinguish between regulation- and state-based covariation by looking at the shape over time: State-based covariation will tend to be more stable.
Fig. 2.
Fig. 2.
Transcriptional bursting yields intrinsic variation for each gene across cells at steady state. (A) Two-state model of transcriptional bursting and regulation for one Regulator–Target pair. Variables: kON (burst frequency), kOFF (1/burst duration), sRNA (transcription = burst size*kOFF), sprotein (translation), δ (decay), Ø (no molecules left). Blue: TF, red: Target. (B) Simulation of TF(RNA), TF(P), and Target(RNA) bursting events and abundance for one cell in the presence of direct regulation between a pair of genes. (C) Abundance distributions of TF(RNA) (μ: 29, CV: 0.84), TF(P) in thousands (μ: 61, CV: 0.31), and Target(RNA) (μ: 50, CV: 0.93), for median values of burst parameters, across 20,000 simulated cells. (D) Overdispersion structure (variance/mean) of total mRNA for TF and Target for different burst sizes (large TF: 32 transcripts/burst, large Target: 40 transcripts/burst; small TF: 3, small Target: 4). (E) Mean TF(RNA) (Top), TF(P) (Middle), and Target(RNA) (Bottom) abundance over time, across cells that did have a burst of the TF gene (colored, n = 715) versus those that did not have a burst (gray, n = 715 randomly subsampled cells with no burst) at t = 0 (20,000 total cells). Solid red line indicates TF(RNA) and dashed red line indicates TF(ΔRNA). Curves are based on data points at 30 min intervals. (TF mRNA at 30 min shows a sharp peak due to discrete sampling; the actual peak is smooth.)
Fig. 3.
Fig. 3.
Information flow between a TF and its target gene is time-dependent. (A) Schematic of the multistep inference question. (B) TF(RNA) and TF(P) Spearman’s ρ autocorrelations and correlations between TF(RNA) and TF(P) over time, across 25 simulation runs (each included as its own dot). (C–E) Kernel density estimates comparing the extremes of distributions across cells at t ≥ 0, binned by the predictor molecule abundance at t = 0. Dashed gray line indicates Spearman’s ρ, and “max IR” indicates maximum D10:D1 IR between top- and bottom-binned cells (alternative hypothesis: top decile of the dependent variable is greater than the bottom decile) value at each time point, with the highest magnitude effect listed. (C) TF(RNA)0:TF(P)T correlation and D10:D1 IR of TF(P) distribution extremes at t ≥ 0 for cells binned by TF(RNA) at t = 0. (D) TF(P)0:Target(kon)T correlation and D10:D1 IR of adjusted Target(ΔRNA) distribution extremes for cells binned by TF(P) at t = 0, under the Hill function model of interaction. (E) Relying on mRNA only—CTΔ and TF(RNA)-binned Target(ΔRNA) D10:D1 IR (Left) and CT and Target(RNA) D10:D1 IR (Right)—to infer regulation over time. (F) Correlation between a TF and its putative Target could be a result of cell-state-based structure; if so, the time-shifted correlation would have a stable magnitude over time. (G) Effect of down-sampling the number of cells and/or UMI detection efficiency on estimated TF:Target covariation trends over time (focusing on CTΔ). Estimates get both noisier and lower in magnitude due to these two technical considerations.
Fig. 4.
Fig. 4.
Enrichment of gene regulatory signal from simultaneous correlations in scRNA-seq data of K562 cells at steady state. (A) Schematic of the experimental design of a pulse–chase metabolic labeling experiment to capture two temporally resolved snapshots of RNA abundance in the same single cells. U, uridine. (B) UMAP of 13,679 unperturbed K562 single cells across six time points (∼1,000 to 4,000 cells per time point), colored by GATA1 scaled counts. (C) Differentially expressed genes upon GATA1 knockdown, inferred from an orthogonal GATA1 knockdown Perturb-seq experiment in K562 cells (92). The horizontal dotted line represents a Bonferroni-adjusted P value threshold of 0.001, and the vertical one a log2 fold change of 0. Purple dots denote the set of correlated genes with P < 0.05 at all time points, which have a 3.8-fold enrichment. (D) Enrichment of predicted TF binding from simultaneous Corr(TF(RNA)T:non-TF(RNA)T) correlations for ChIP-seq binding signal across 56 TFs with ENCODE ChIP-seq data that have at least 15 significantly correlated genes from the K562 data.

References

    1. Butte A. J., Kohane I. S., Mutual information relevance networks: Functional genomic clustering using pairwise entropy measurements. Pac. Symp. Biocomput. 2000, 418–429 (2000). - PubMed
    1. Carter S. L., Brechbühler C. M., Griffin M., Bond A. T., Gene co-expression network topology provides a framework for molecular characterization of cellular state. Bioinformatics 20, 2242–2250 (2004). - PubMed
    1. Stuart J. M., Segal E., Koller D., Kim S. K., A gene-coexpression network for global discovery of conserved genetic modules. Science 302, 249–255 (2003). - PubMed
    1. Zhang B., Horvath S., A general framework for weighted gene co-expression network analysis. Stat. Appl. Genet. Mol. Biol. 4, 17 (2005). - PubMed
    1. Hu Z., Killion P. J., Iyer V. R., Genetic reconstruction of a functional transcriptional regulatory network. Nat. Genet. 39, 683–687 (2007). - PubMed

Publication types

MeSH terms

Substances