. 2022 Aug 23;119(34):e2206175119.
doi: 10.1073/pnas.2206175119. Epub 2022 Aug 15.

On the formation of ordered protein assemblies in cell-cell interfaces

Affiliations

On the formation of ordered protein assemblies in cell-cell interfaces

Nadir Boni et al. Proc Natl Acad Sci U S A. .

Abstract

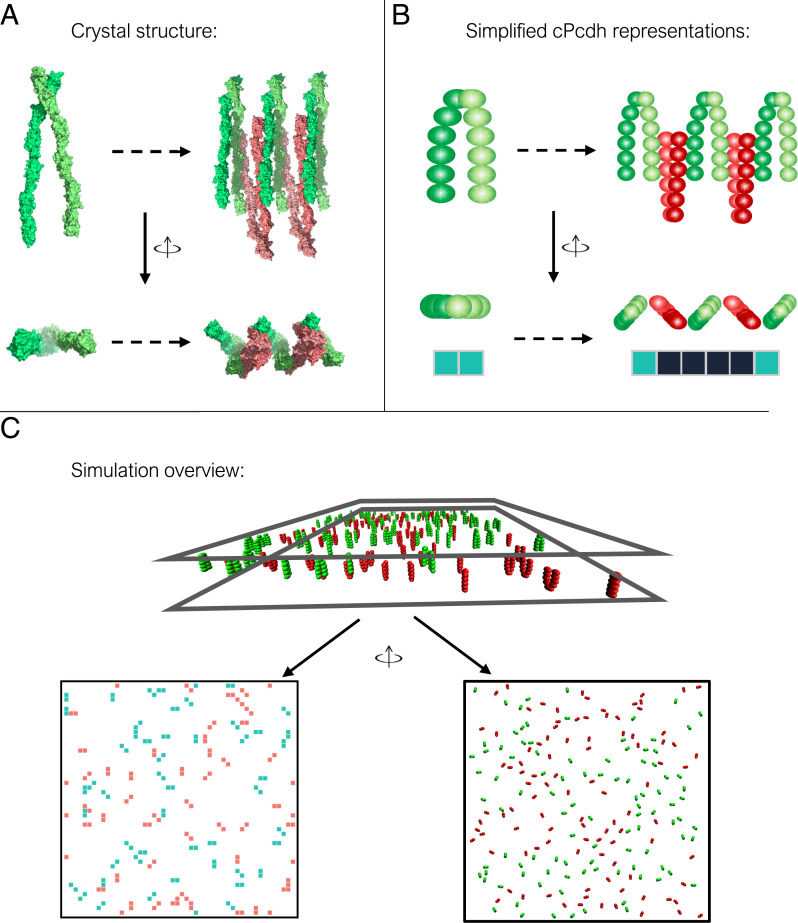
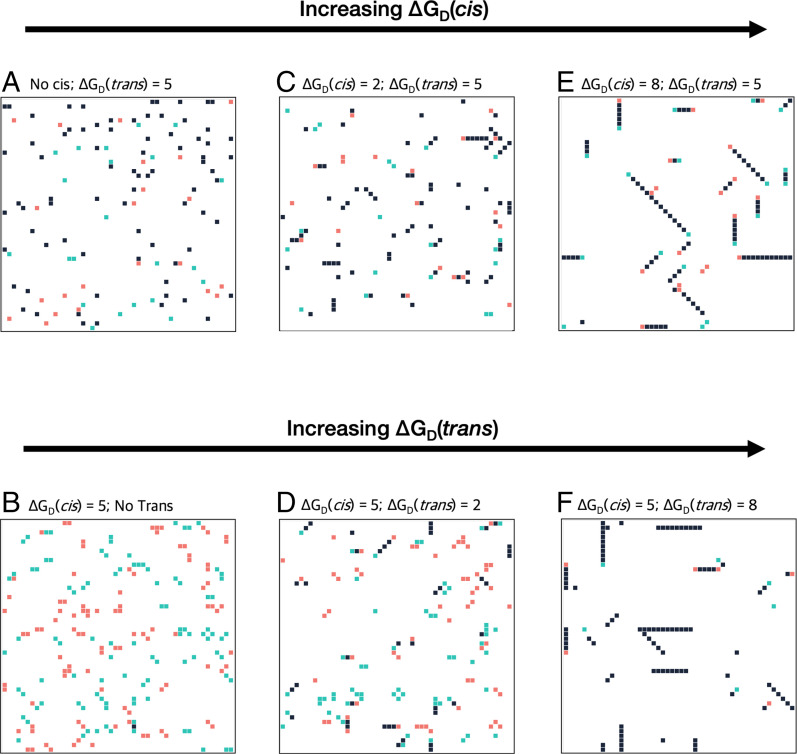
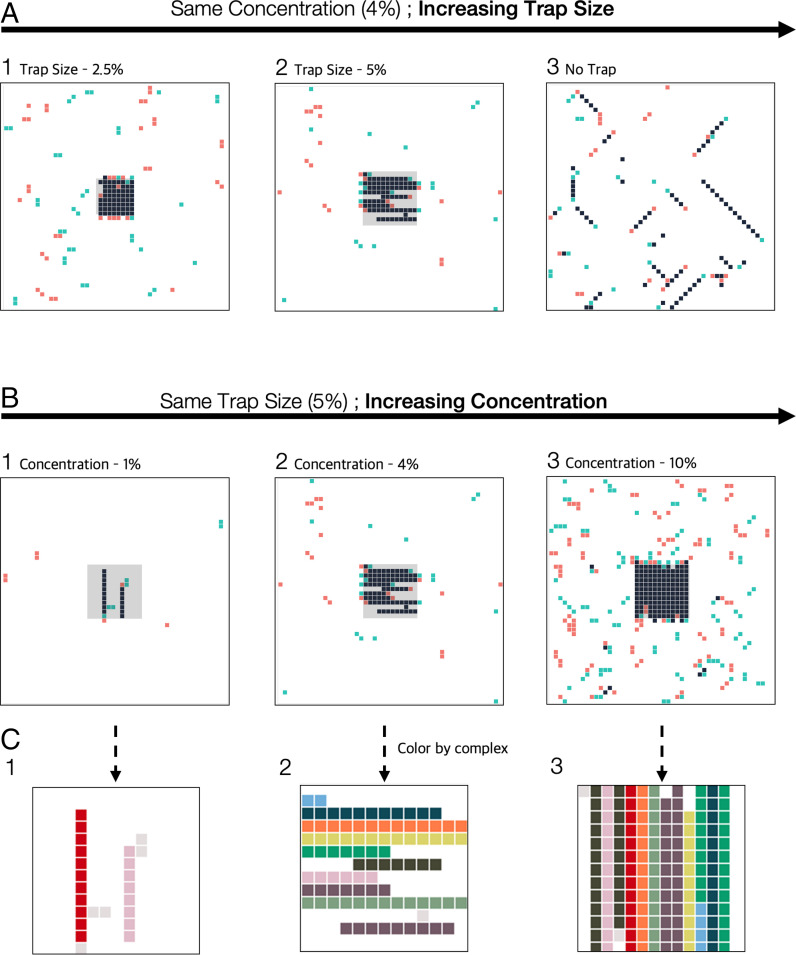
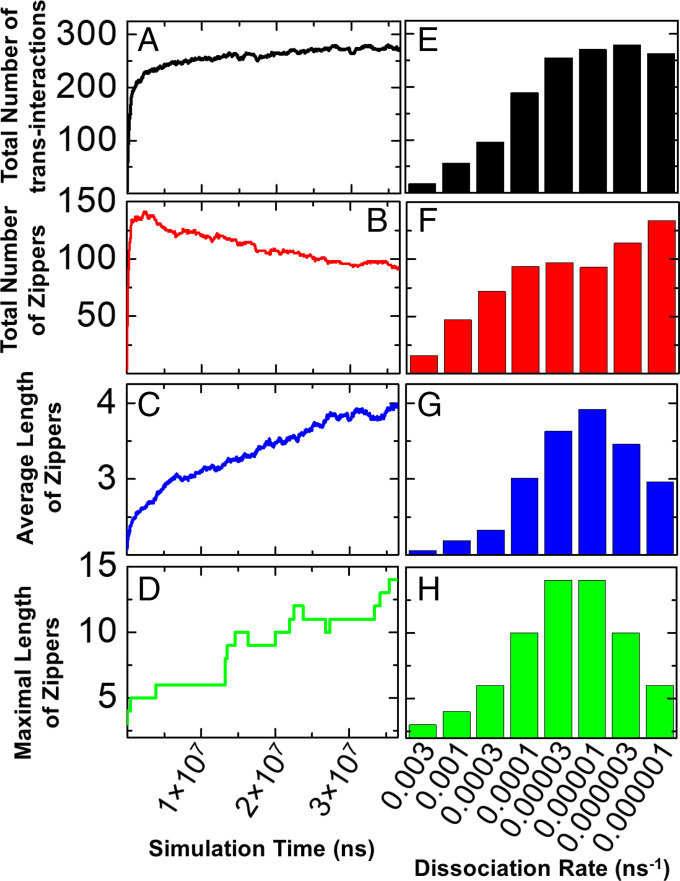
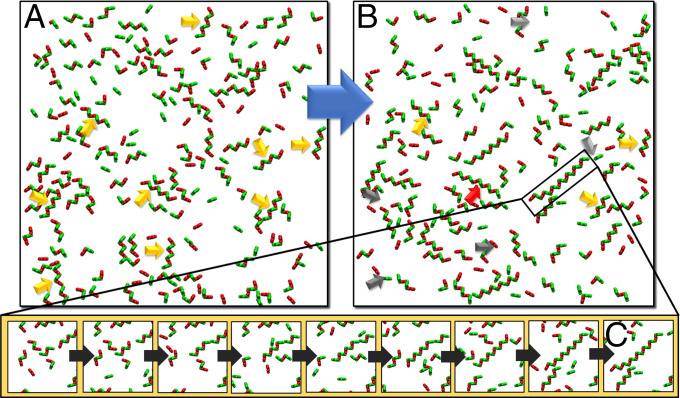
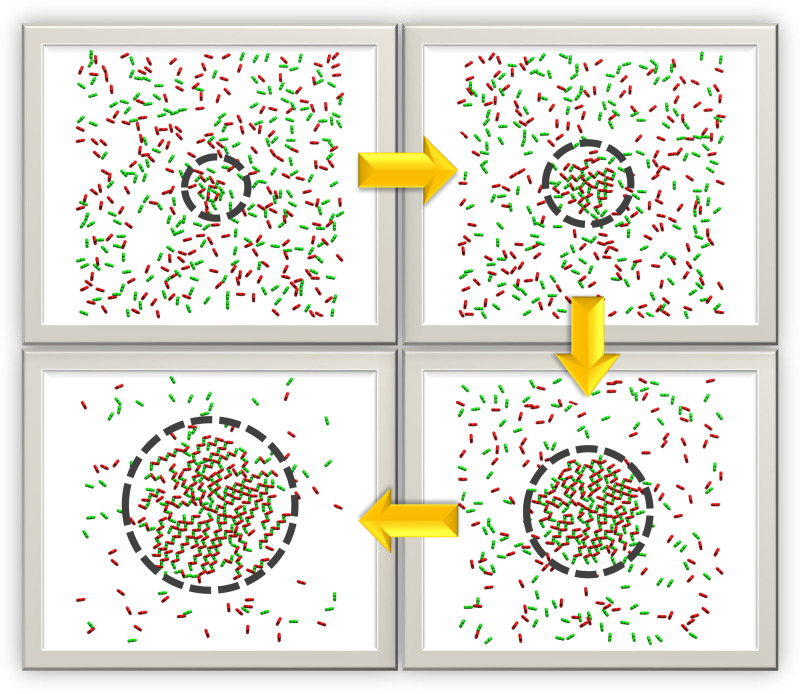
Crystal structures of many cell-cell adhesion receptors reveal the formation of linear "molecular zippers" comprising an ordered one-dimensional array of proteins that form both intercellular (trans) and intracellular (cis) interactions. The clustered protocadherins (cPcdhs) provide an exemplar of this phenomenon and use it as a basis of barcoding of vertebrate neurons. Here, we report both Metropolis and kinetic Monte Carlo simulations of cPcdh zipper formation using simplified models of cPcdhs that nevertheless capture essential features of their three-dimensional structure. The simulations reveal that the formation of long zippers is an implicit feature of cPcdh structure and is driven by their cis and trans interactions that have been quantitatively characterized in previous work. Moreover, in agreement with cryo-electron tomography studies, the zippers are found to organize into two-dimensional arrays even in the absence of attractive interactions between individual zippers. Our results suggest that the formation of ordered two-dimensional arrays of linear zippers of adhesion proteins is a common feature of cell-cell interfaces. From the perspective of simulations, they demonstrate the importance of a realistic depiction of adhesion protein structure and interactions if important biological phenomena are to be properly captured.

Keywords: adhesion proteins; cell–cell interfaces; clustered protocadherins; ordered protein assemblies.


Conflict of interest statement

The authors declare no competing interest.

Figures

Fig. 1.
Fig. 1.
Modeling protocadherin structure. (A) cPcdh crystal structures shown in top and side views; Left: cis-dimer with separate monomers indicated by different shades of green; Right: short zipper colored red for cPcdhs from the lower membrane and green for those from the upper membrane. (B) Schematic representation of cPcdh cis-dimer (Left) and zipper-like assembly (Right) as seen from a top and side views of cPcdh crystal structures. For the MC lattice simulations each cPcdh monomer is represented as a square on the lattice (cis-dimer is depicted as a rectangle). The square colors indicate the membrane affiliation with red and green for cPcdhs from the bottom or top membranes, respectively. Black squares represent double occupancies by proteins belonging to apposed membranes. (C) In the initial configuration, cis-dimers are randomly placed on two opposing surfaces shown in a side view and top view for lattice (Left) and kinetic (Right) simulations.
Fig. 2.
Fig. 2.
cPcdhs form long zippers whose length is dependent on both cis and trans affinities. Simulation snapshots from the 2D lattice model with green squares representing cPcdhs from top membrane, red squares representing cPcdhs from the lower membrane, and black squares representing double occupancies by proteins belonging to apposed membranes. Protein concentration in each simulation was set to 4% of the total grid size (200 proteins in total). (A and B) snapshots of the grid when either cis or trans interactions are absent, zippers-like arrays do not form. (C–F) An increase in the trans or cis affinities results in longer zipper arrays represented as linear black rectangles.
Fig. 3.
Fig. 3.
cPcdhs zippers form 2D arrays at high protein concentration. Simulation snapshots of the 2D lattice model. Colors in (A) and (B) represent cPcdhs membrane origins (red, bottom membrane; green, top membrane; black, double occupancies by cPcdhs belonging to apposing membranes). Diffusion traps comprising 8 × 8 lattice sites (A1) or 11 × 11 (A2 and B) is shown in the center of 2D lattice of 50 × 50 lattice sites. When a diffusion trap is present, trans-dimer formation only occurs in this contact zone. In all simulations ΔGD(trans) = 4 kT and ΔGD(cis) = 7 kT. (A) Results of three simulations that differ by diffusion trap size. Long zippers appear in all three simulations, but the size of the zippers is limited by the size of the diffusion trap. In addition, decreasing the cell–cell interaction area (no diffusion trap to 2.5% diffusion trap) prompts zipper cluster formation. (B) Results of three simulations that differ in protein concentration. In all three simulations long zippers appear, however, zippers tend to cluster only at protein concentrations of 4% and more significantly at concentrations of 10% (B2 and B3, respectively). (C) Magnification of the diffusion trap area (gray area) in (B). Each zipper-like assembly is depicted by a different color.
Fig. 4.
Fig. 4.
Kinetic MC simulations were carried out under different trans interaction dissociation rates. The change in total number of trans interactions over time and its dependence on the value of dissociation rate are plotted in (A) and (E), respectively. Similarly, the change in total number of zippers over time and its dependence on the value of dissociation rate are plotted in (B) and (F); the change in average length of zippers over time and its dependence on the value of dissociation rate are plotted in (C) and (G); and finally, the change in maximal length of zippers over time and its dependence on the value of dissociation rate are plotted in (D) and (H).
Fig. 5.
Fig. 5.
In order to illustrate the mechanism of zipper formation, we selected two snapshots from the early (A) and late (B) stages of the kinetic MC simulation. Some short zippers (orange arrows) later dissociate into individual cis-dimers (gray arrows) that eventually join longer zippers (red arrows). The detailed kinetics of the growth of a long zipper (highlighted by the black frame in B) is further specified by a series of enlarged snapshots shown in (C).
Fig. 6.
Fig. 6.
A circular zone that grows dynamically was created in the center of the simulation box to mimic the contact area between two cells in the kinetic MC simulation. Representative snapshots were selected long the simulation trajectory, as indicated by the yellow arrows. The two cell surfaces in the snapshots are visualized from the top. The contact areas in the figure are defined by the dashed circles in the center of the surface. cPcdh cis-dimers on the top and bottom layers of cell surfaces are displayed in green and red, respectively.

Similar articles

Cited by

References

    1. Harrison O. J., et al. , The extracellular architecture of adherens junctions revealed by crystal structures of type I cadherins. Structure 19, 244–256 (2011). - PMC - PubMed
    1. Dean C., et al. , Neurexin mediates the assembly of presynaptic terminals. Nat. Neurosci. 6, 708–716 (2003). - PMC - PubMed
    1. Grakoui A., et al. , The immunological synapse: A molecular machine controlling T cell activation. Science 285, 221–227 (1999). - PubMed
    1. Hong S., Troyanovsky R. B., Troyanovsky S. M., Spontaneous assembly and active disassembly balance adherens junction homeostasis. Proc. Natl. Acad. Sci. U.S.A. 107, 3528–3533 (2010). - PMC - PubMed
    1. Yap A. S., Niessen C. M., Gumbiner B. M., The juxtamembrane region of the cadherin cytoplasmic tail supports lateral clustering, adhesive strengthening, and interaction with p120ctn. J. Cell Biol. 141, 779–789 (1998). - PMC - PubMed

Publication types

LinkOut - more resources