. 2022 Aug 23;119(34):e2207987119.
doi: 10.1073/pnas.2207987119. Epub 2022 Aug 15.

A sequential two-step priming scheme reproduces diversity in synaptic strength and short-term plasticity

Affiliations

A sequential two-step priming scheme reproduces diversity in synaptic strength and short-term plasticity

Kun-Han Lin et al. Proc Natl Acad Sci U S A. .

Abstract

Glutamatergic synapses display variable strength and diverse short-term plasticity (STP), even for a given type of connection. Using nonnegative tensor factorization and conventional state modeling, we demonstrate that a kinetic scheme consisting of two sequential and reversible steps of release-machinery assembly and a final step of synaptic vesicle (SV) fusion reproduces STP and its diversity among synapses. Analyzing transmission at the calyx of Held synapses reveals that differences in synaptic strength and STP are not primarily caused by variable fusion probability (pfusion) but are determined by the fraction of docked synaptic vesicles equipped with a mature release machinery. Our simulations show that traditional quantal analysis methods do not necessarily report pfusion of SVs with a mature release machinery but reflect both pfusion and the distribution between mature and immature priming states at rest. Thus, the approach holds promise for a better mechanistic dissection of the roles of presynaptic proteins in the sequence of SV docking, two-step priming, and fusion. It suggests a mechanism for activity-induced redistribution of synaptic efficacy.

Keywords: calyx of Held; numerical simulation; short-term plasticity; synaptic transmission; synaptic vesicle priming.


Conflict of interest statement

The authors declare no competing interest.

Figures
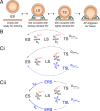
Fig. 1.
Fig. 1.
Diagram of vesicle states and kinetic schemes for the numerical simulation of STP. (A) Basic sequential model for priming and fusion. SVs dock to an empty release site (ES) and undergo two priming steps to sequentially transition to the LS and TS states. Only SVs in state TS are fusion competent. (B) Kinetic scheme of state transitions for the basic model shown in (A). A simple three-state scheme is adequate for reproducing experimental data for fstim = 1–20 Hz. (C) An extended reaction scheme with an additional TSL state is required for reproducing experimental data for fstim ≥50 Hz. SVTSs and SVTSLs have the same pfusion. The two states TS and TSL differ with respect to their stability. While TS has a lifetime in the range of 3–4 s, TSL relaxes back to LS within ∼100 ms. Vacated release sites can either instantaneously return to ES and thereby be immediately available for SV docking (C, i) or else reside for some time in an ERS (C, ii). State transitions in (B) and (C) represented by dashed lines indicate instantaneous transitions, while those represented by solid lines occur with rate constants as shown (see also SI Appendix, Table S2). Elements shown in blue in (C) extend the kinetic scheme illustrated in (B).
Fig. 2.
Fig. 2.
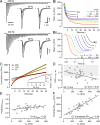
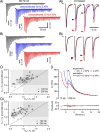
STP in response to 0.5–200 Hz stimulus trains in post hearing-onset calyx of Held synapses. (A) Sample eEPSCs obtained from a strongly depressing (top) and a facilitating (bottom) synapse in response to 200 Hz (Left), 20 Hz (Middle), and 2 Hz (Right) stimulation. Only the initial 15 eEPSCs are superimposed for the 2 Hz and 20 Hz eEPSC trains. Each trace represents an average of three repetitions. (B) Mean quantal content (mj) plotted against stimulus index j (B, i) or time (B, ii) for each eEPSC. Trains consisted of only 15 stimuli for the lowest three frequencies. The timing of eEPSC1 was offset by one ISI in (B, ii) for clarity. Note logarithmic time axis in (B, ii). (C) Estimating the fast releasing pool (FRP) of SVs from eEPSC trains evoked by 50, 100, and 200 Hz stimulation which provided three FRP' estimates that are uncorrected for incomplete pool depletion. The relationship between the three 1/FRP' values and their respective ISIs was subsequently extrapolated to infinite fstim (ISI = 0 ms) to obtain a mean FRP value that is corrected for incomplete pool depletion (Inset). (D) PPRs (m2/m1) for 200 Hz eEPSC trains negatively correlate with initial quantal content (m1), which varies approximately 10-fold among calyx synapses (73–728 SVs). The gray shaded region indicates PPR >1. (E and F) Predictions for pfusion (E) and SPTS,rest (F) for individual synapses obtained from their respective 10 Hz PPR and Dm values according to SI Appendix, Eq. 31.
Fig. 3.
Fig. 3.
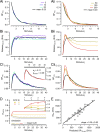
NTF decomposition analysis of 5–200 Hz eEPSC trains. (A) Comparison of BFTS reflecting the normalized release time course of preexisting SVTSs for 5, 10, and 20 Hz (A, i) and 50, 100, and 200 Hz (A, ii) stimulation. The black traces in A, i and A, ii represent the mean BFTS for 50, 10, and 20 Hz. Individual BFs in A1 are indistinguishable from their mean. (B) Comparison of mean MLS,RS · BFLS,RS reflecting the release contribution by SVs that were not tightly docked prior to stimulation, i.e., the sum of preexisting SVLSs and newly recruited SVs, for 5, 10, and 20 Hz (B, i) and 50, 100, and 200 Hz (B, ii) stimulation. The black traces in B, i and B, ii represent the mean BFLS,RS for 50, 10, and 20 Hz. (C) Comparison of BFLS reflecting the normalized release time course of preexisting SVLSs for 5, 10, and 20 Hz (C, i) and 50, 100, and 200 Hz (C, ii) stimulation. The black traces in C, i and C, ii represent the mean BFLS for 50, 10, and 20 Hz. The inset compares the average BFLS of 5–20 Hz (black) with a fit (red) as described in Neher and Taschenberger (51), which can be used to obtain an estimate for s2. (D) Simulated time course of pfusion during stimulus trains calculated according to Eq. 37. The inset compares NTF-derived pfusion estimates for the four initial eEPSCs with simulated values. (E) Scatter plot of NTF-derived MTS versus SPTS,rest as predicted for 10 Hz eEPSC trains from m1 and pfusion according to SI Appendix, Eq. 31 (see also Fig. 2F). The slope of the regression line (1.09) indicates that the NTF-derived MTS is on average ∼9% larger.
Fig. 4.
Fig. 4.
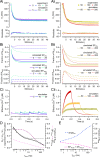
Numerical simulations of STP in response to regular 5–200 Hz stimulus trains. (A) Experimental data (filled circles) and simulated mj values (lines) plotted against stimulus j for 5, 10, and 20 Hz (A, i) and 50, 100, and 200 Hz (A, ii) trains. Residuals are shown in the small panels below. (B) Time course of subpool occupancies immediately before AP arrival for SPLS and SPTS (Top) and SPTSL (Bottom) measured in fractions of total number of release sites (Ntot) for 5, 10, and 20 Hz (B, i) and 50, 100, and 200 Hz (B, ii ) trains. Note different scaling of upper and lower panels. (C) Time course of the effective [Ca2+] regulating priming (Eq. 6) at high time resolution (1 ms) shown for comparison for 5, 10, and 20 Hz (C, i) and 50, 100, and 200 Hz (C, ii) trains. Only the initial portion of the [Ca2+] trains is shown in C, i. (D) Normalized steady-state depression (Dm = mss/m1, left axis) and steady-state occupancy of SPTS and SPLS measured in fractions of Ntot (right axis) are plotted logarithmically as a function of fstim. While the steady-state occupancy of SPTS gradually declines with increasing fstim, SPLS does not substantially deplete at steady state for fstim ≤10 Hz. The dotted trace is the prediction for Dm by the basic model (Fig. 1B). This assumes a strictly linear k1([Ca2+]), an empty SPTSL at AP arrival, and no contribution of y(t) to facilitation, but a decreasing z(t) (Eq. 37), as suggested by NTF for low frequencies. The basic model agrees quite well with the measured Dm (filled circles) for fstim up to 20 Hz but clearly deviates for higher stimulation frequencies. The extended model (Fig. 1C) accurately describes data up to 200 Hz. (E) Simulated total numbers of empty release sites (blue dashed line) and release sites occupied with a fusion-competent SV (i.e., SPTS + SPTSL, red dashed line) calculated immediately before AP arrival at steady state in fractions of Ntot are plotted as a function of fstim.
Fig. 5.
Fig. 5.
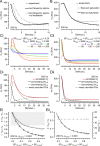
Model predictions for facilitation, depression, and STP heterogeneity. (A and B) Experimental data (gray symbols and lines) and several model predictions (solid and dotted black lines) for 200 Hz eEPSC trains plotted superimposed versus stimulus index j. (A) The solid trace simulates release using the basic model with constant pfusion, which is sufficient to account for experimental data up to fstim = 20 Hz. The dashed trace includes the facilitation of pfusion, as reported by NTF. Neither simulation can predict facilitation as experimentally observed for fstim = 200 Hz. (B) Simulated 200 Hz trains after extending the model to include an additional release component mediated by SVTSLs (dotted trace) and then further refined by assuming a saturating MM–type relationship between [Ca2+] and k1 (solid trace), which accurately reproduces both PPF and STD. (C) Time courses of mj in response to 5–200 Hz stimulus trains were simulated using standard values for all model parameters except for b2, which was either increased (C, i and D, i) or decreased (C, ii and D, ii) such that the fraction SPTS,rest/(SPLS,rest + SPTS,rest) was reduced to ∼20% or enhanced to ∼74%, respectively. The red dotted trace in C, ii represents the mj time course for the simulated 200 Hz train shown in (C, i). (D) Simulated contributions to release during 200 Hz stimulation by preexisting SVTSs (solid black) and by preexisting SVLSs (dotted black) or newly recruited SVs (dashed black). Simulated total release (mj, solid red) is shown for comparison. (E) Ratios m2/m1 (PPR) and m3/m1 (E, i) and relative steady-state depression (mss/m1, E, ii) plotted versus the relative fraction of SPTS,rest for 14 simulations similar to those shown in (C) and (D). Either unpriming rate constant b2 or priming rate constant k2 for the LS ↔ TS transition were increased or decreased to generate relative SPTS fractions in the range from 0.2 to 0.9. Note that pfusion,1 was kept at 0.39 and standard values were used for all other model parameters. The gray shaded region in (E, i) indicates ratios >1.
Fig. 6.
Fig. 6.
Numerical simulations of STP in response to complex stimulus train patterns. (A and B) Sample 200 Hz eEPSCs recorded without (A, i and B, i, Top) or with 10 Hz preconditioning using 2 APs (A, i and B, i, Middle) or 4 APs (A, i and B, i, Bottom) in a strongly depressing (A) and a facilitating (B) synapse. We found that 10 Hz preconditioning converted depression into facilitation (A) and augmented existing facilitation (B). The initial four eEPSCs are shown after normalization to the peak of eEPSC1 at an expanded timescale in (A, ii) and (B, ii). Time calibration bars in (A, i) and (A, ii) also apply to (B, i) and (B, ii). (C) Ratios m2/m1 (C, i) and m3/m1 (C, ii) measured after 10 Hz preconditioning with four APs plotted against the respective values obtained without preconditioning for all 35 synapses. Nearly all values lie above the unity line (dotted line). Values from both 200 Hz (filled circles) and 100 Hz (open circles) eEPSC trains are plotted. The gray shaded regions indicate ratios >1. (D) Simulated mean mj values and experimental data including the conditioning responses plotted superimposed against stimulus index. Note the excellent agreement between experimental data (circles) and model predictions (solid lines). Residuals are plotted in the small panel (Bottom). The dotted vertical line marks the transition from 10 Hz conditioning to 200 Hz stimulation.

Similar articles

Cited by

References

    1. Abbott L. F., Regehr W. G., Synaptic computation. Nature 431, 796–803 (2004). - PubMed
    1. Regehr W. G., Short-term presynaptic plasticity. Cold Spring Harb. Perspect. Biol. 4, a005702 (2012). - PMC - PubMed
    1. Bartos M., Vida I., Jonas P., Synaptic mechanisms of synchronized gamma oscillations in inhibitory interneuron networks. Nat. Rev. Neurosci. 8, 45–56 (2007). - PubMed
    1. Fortune E. S., Rose G. J., Short-term synaptic plasticity as a temporal filter. Trends Neurosci. 24, 381–385 (2001). - PubMed
    1. Verhage M., Sørensen J. B., SNAREopathies: Diversity in mechanisms and symptoms. Neuron 107, 22–37 (2020). - PubMed

Publication types

LinkOut - more resources