. 2022 Aug 23;119(34):e2206069119.
doi: 10.1073/pnas.2206069119. Epub 2022 Aug 15.

Deep learning predicts DNA methylation regulatory variants in the human brain and elucidates the genetics of psychiatric disorders

Affiliations

Deep learning predicts DNA methylation regulatory variants in the human brain and elucidates the genetics of psychiatric disorders

Jiyun Zhou et al. Proc Natl Acad Sci U S A. .

Abstract

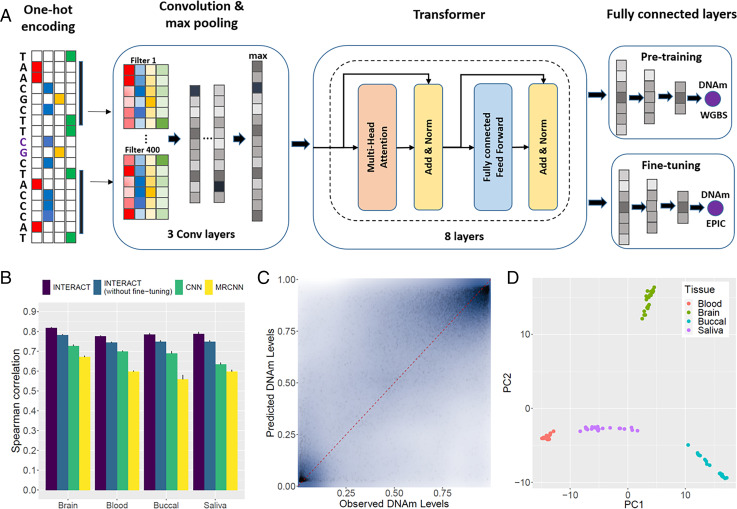
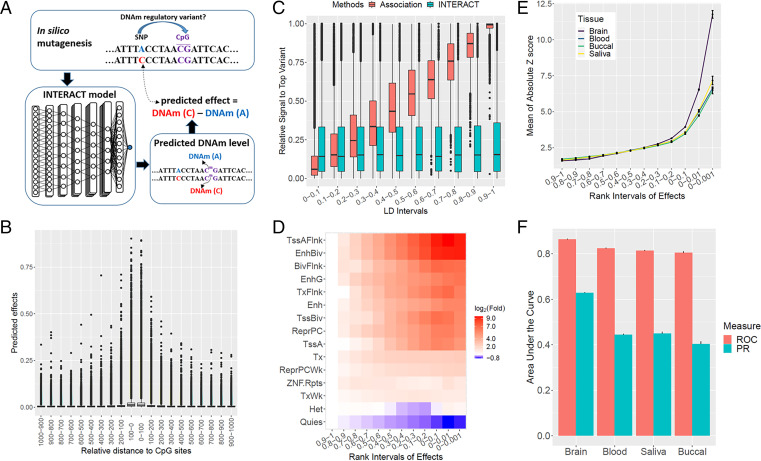
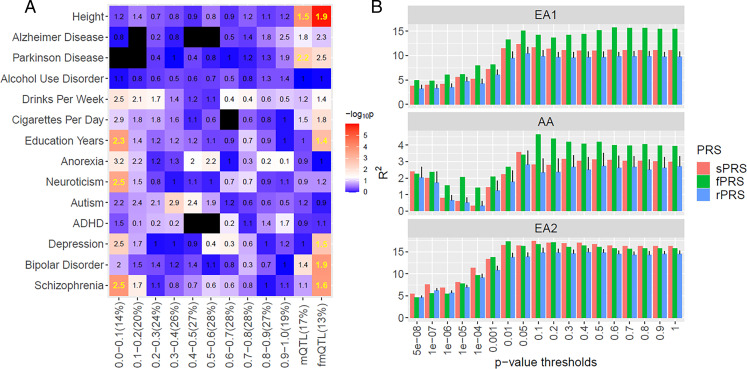
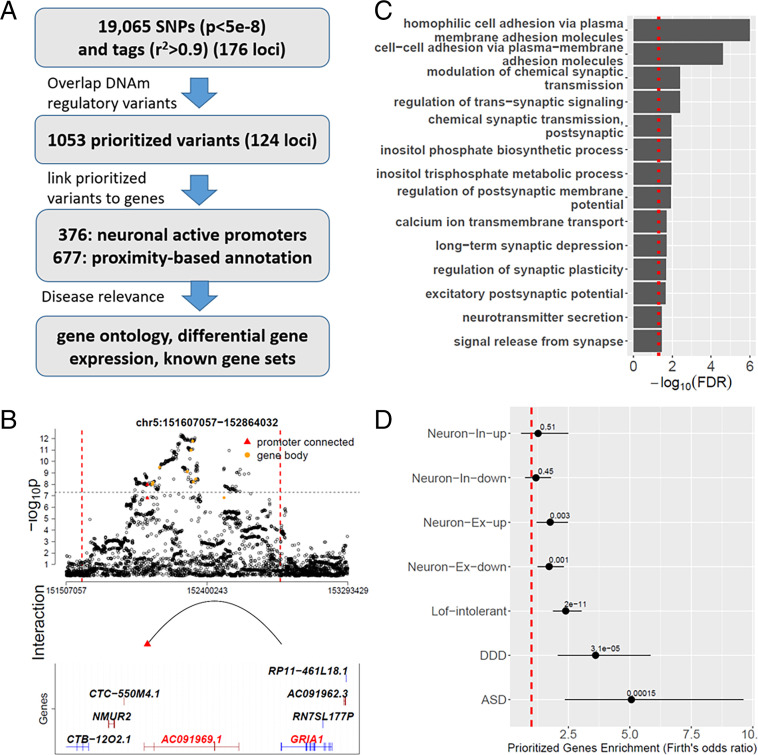
There is growing evidence for the role of DNA methylation (DNAm) quantitative trait loci (mQTLs) in the genetics of complex traits, including psychiatric disorders. However, due to extensive linkage disequilibrium (LD) of the genome, it is challenging to identify causal genetic variations that drive DNAm levels by population-based genetic association studies. This limits the utility of mQTLs for fine-mapping risk loci underlying psychiatric disorders identified by genome-wide association studies (GWAS). Here we present INTERACT, a deep learning model that integrates convolutional neural networks with transformer, to predict effects of genetic variations on DNAm levels at CpG sites in the human brain. We show that INTERACT-derived DNAm regulatory variants are not confounded by LD, are concentrated in regulatory genomic regions in the human brain, and are convergent with mQTL evidence from genetic association analysis. We further demonstrate that predicted DNAm regulatory variants are enriched for heritability of brain-related traits and improve polygenic risk prediction for schizophrenia across diverse ancestry samples. Finally, we applied predicted DNAm regulatory variants for fine-mapping schizophrenia GWAS risk loci to identify potential novel risk genes. Our study shows the power of a deep learning approach to identify functional regulatory variants that may elucidate the genetic basis of complex traits.

Keywords: DNA methylation quantitative trait loci (mQTL); GWAS; convolutional neural network (CNN); regulatory variants; transformer.


Conflict of interest statement

Competing interest statement: A.E.J. Is a current employee and shareholder of Neumora Therapeutics.

Figures

Fig. 1.
Fig. 1.
Prediction of DNAm levels from DNA sequence. (A) Illustration of INTERACT architecture. (B) Comparison of model performance in predicting DNAm levels of independent CpG sites. Each model predicts DNAm levels of independent CpG sites in each sample of the same tissue used for training the model. Spearman correlation is calculated for observed and predicted DNAm levels in each training sample. The bar height and error bar represent the mean and SD of measured Spearman correlations across training samples of the same tissue. (C) Scatter plot for the observed and predicted DNAm levels of independent CpG sites in one brain sample by the brain-specific INTERACT model. (D) Clustering of samples by the first two PCs of predicted DNAm levels of independent CpG sites.
Fig. 2.
Fig. 2.
In silico discovery, characterization, and validation of DNAm regulatory variants. (A) A schematic view of in silico discovery of DNAm regulatory variants. (B) Comparison of predicted effects of variants on DNAm levels vs. their relative distance to CpG sites. Variants are grouped by their relative distance to CpG sites on the x axis. A box plot represents the distribution of predicted effects of variants on DNAm levels by the brain-specific model in one brain sample. (C) Comparison of relative signal of each variant to the top variant of the strongest signal (y axis) derived from either association analysis or INTERACT vs. the LD strength between the variant and the top variant (x axis) of each CpG site. Relative signal from association analysis were measured by the [−log10(P value)] of each variant divided by the maximum value of top variant for each CpG site. Relative signal from INTERACT were measured by the absolute value of predicted effect of each variant divided by the maximum value of top variant for each CpG site. (D) Enrichment of 15-core chromatin states in the DLPFC from the Epigenome Roadmap project among variants ranked at different intervals by their predicted effects on DNAm levels in one brain sample. Rank interval “0–0.001” represents variants of large effect and ranked in the top 0.1%. The color gradient represents log2 (enrichment fold) of variants in each rank interval for their enrichment of each chromatin state compared to variants ranked in the bottom (0.9 to 1). (E) Comparing SNP effects on DNAm levels of SNP–CpG pairs (x axis) predicted by each tissue-specific INTERACT vs. average mQTLs signals of the same SNP–CpG pairs (y axis) from association analysis. Each tissue-specific model predicts SNP effects on DNAm levels of SNP–CpG pairs in each sample of the corresponding tissue used for training the model. SNP–CpG pairs are then ranked by their predicted effects in each training sample, and average mQTLs signals are calculated for SNP–CpG pairs in each rank interval. Rank interval “0–0.001” represents SNP–CpG pairs of large predicted effect and ranked in the top 0.1%. Each point and its error bar on the curve represent mean and SD of average mQTLs signals of SNP–CpG pairs in each rank interval across training samples of the same tissue. (F) Comparison of tissue-specific INTERACT models for their performance in predicting causal mQTLs in the gold-standard dataset. Each tissue-specific INTERACT predicts SNP effects on DNAm levels of SNP–CpG pairs of gold-standard dataset in each sample of the corresponding tissue used for training the model. AUC-ROC and AUC-PR are calculated for each tissue-specific INTERACT based on predicted SNP effects on DNAm levels of SNP–CpG pairs by the model in each training sample. The height of each bar and its error bar represents the mean and SD of AUC-ROC (AUC-PR) across training samples of the same tissue.
Fig. 3.
Fig. 3.
DNAm regulatory variants predicted by the brain-specific INTERACT underlie the genetic basis of brain-related traits. (A) Heritability enrichment analysis for variants predicted by the brain-specific INTERACT. The x axis represents variants ranked at different intervals by their predicted effects. Interval “0–0.1” represents variants of high effect and ranked in the top 10%. As a comparison, mQTL and fmQTLs in the DLPFC are also included. The percent in brackets represents proportion of annotation SNPs included for S-LDSC. The color gradient represents significance levels for enriched heritability. The black color represents negative heritability estimates from S-LDSC. The numbers within each square are heritability enrichment fold and numbers in bold indicate FDR significant (FDR < 0.05) after multiple testing correction. (B) Comparison of prediction performance of three types of PRS for schizophrenia case-control status. fPRS: functional PRS computed from predicted DNAm regulatory variants; sPRS: standard PRS; rPRS: random PRS computed from random SNPs matched for the number of SNPs with fPRS. Error bar above rPRS represents SD of R2 across 100 random iterations of rPRS.
Fig. 4.
Fig. 4.
Fine-mapping schizophrenia GWAS risk loci. (A) Overview of fine-mapping strategy. (B) Fine-mapping result for one risk locus. (Top) Regional plot for GWAS association signals. The two vertical dotted red lines indicate risk locus interval. The colored points indicate prioritized risk variants and their annotations (red triangle, variants connected to active promoters in neuron; orange circle, variants within gene bodies). (Middle) Distal regulation of prioritized risk variants with target gene GRIA1. (Bottom) All genes within risk locus. Gene names in red indicate prioritized risk genes. Gene frames in blue and brown indicates genes on positive and negative strand, respectively. Gene frames are drawn based on the longest transcript from ENSEMBLE annotation (hg19). (C). Gene ontology enrichment analysis for prioritized genes. The dotted vertical red line indicates significant threshold after FDR correction (FDR < 0.05). (D) Gene set enrichment analysis for prioritized risk genes. The y axis represents gene sets: ASD, autism risk genes identified by integrated de novo mutations and rare variants analysis; DDD, genes enriched for de novo mutations in developmental disorder cases; Lof-intolerant, loss-of-function intolerant genes; Neuron-Ex-down, decreased gene expression in excitatory neurons of schizophrenia cases; Neuron-Ex-up, increased gene expression in excitatory neurons of schizophrenia cases; Neuron-In-down, decreased gene expression in inhibitory neurons of schizophrenia cases; Neuron-In-up, increased gene expression in inhibitory neurons of schizophrenia cases. Each horizontal line represents the odds-ratio (OR) and 95% confidence interval of the association between prioritized risk genes and genes of each gene set. Association was computed by logistic regression using Firth’s bias reduction method adjusting for gene size, with all protein coding genes as background. Numbers above each line are P values. Dotted red line indicates no enrichment.

Similar articles

Cited by

References

    1. Schizophrenia Working Group of the Psychiatric Genomics Consortium, Biological insights from 108 schizophrenia-associated genetic loci. Nature 511, 421–427 (2014). - PMC - PubMed
    1. Wray N. R., et al. ; eQTLGen; 23andMe; Major Depressive Disorder Working Group of the Psychiatric Genomics Consortium, Genome-wide association analyses identify 44 risk variants and refine the genetic architecture of major depression. Nat. Genet. 50, 668–681 (2018). - PMC - PubMed
    1. Stahl E. A., et al. ; eQTLGen Consortium; BIOS Consortium; Bipolar Disorder Working Group of the Psychiatric Genomics Consortium, Genome-wide association study identifies 30 loci associated with bipolar disorder. Nat. Genet. 51, 793–803 (2019). - PMC - PubMed
    1. Schaid D. J., Chen W., Larson N. B., From genome-wide associations to candidate causal variants by statistical fine-mapping. Nat. Rev. Genet. 19, 491–504 (2018). - PMC - PubMed
    1. Zhang F., Lupski J. R., Non-coding genetic variants in human disease. Hum. Mol. Genet. 24 (R1), R102–R110 (2015). - PMC - PubMed

Publication types