. 2022 Sep 5;221(9):e202112107.
doi: 10.1083/jcb.202112107. Epub 2022 Aug 12.

ORP5 and ORP8 orchestrate lipid droplet biogenesis and maintenance at ER-mitochondria contact sites

Affiliations

ORP5 and ORP8 orchestrate lipid droplet biogenesis and maintenance at ER-mitochondria contact sites

Valentin Guyard et al. J Cell Biol. .

Abstract

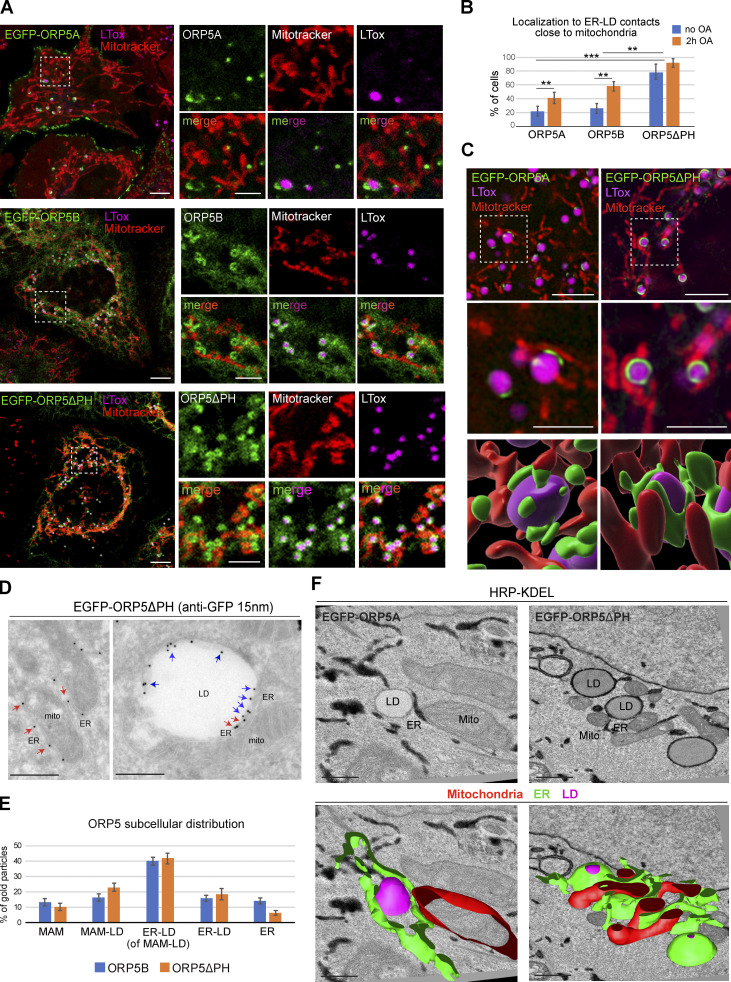
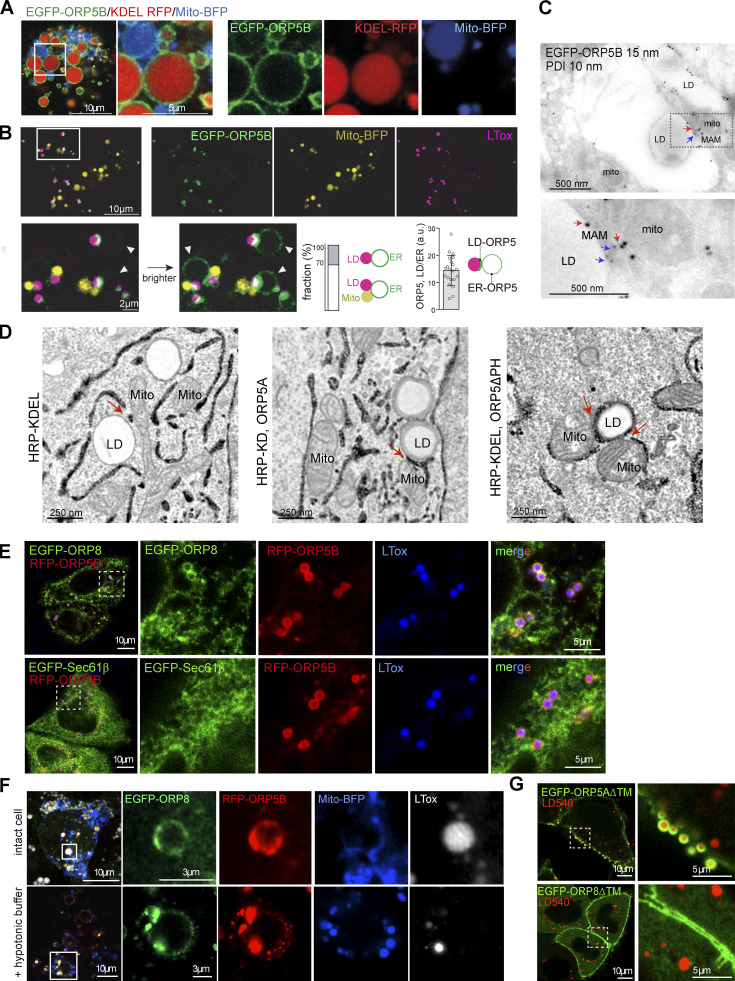
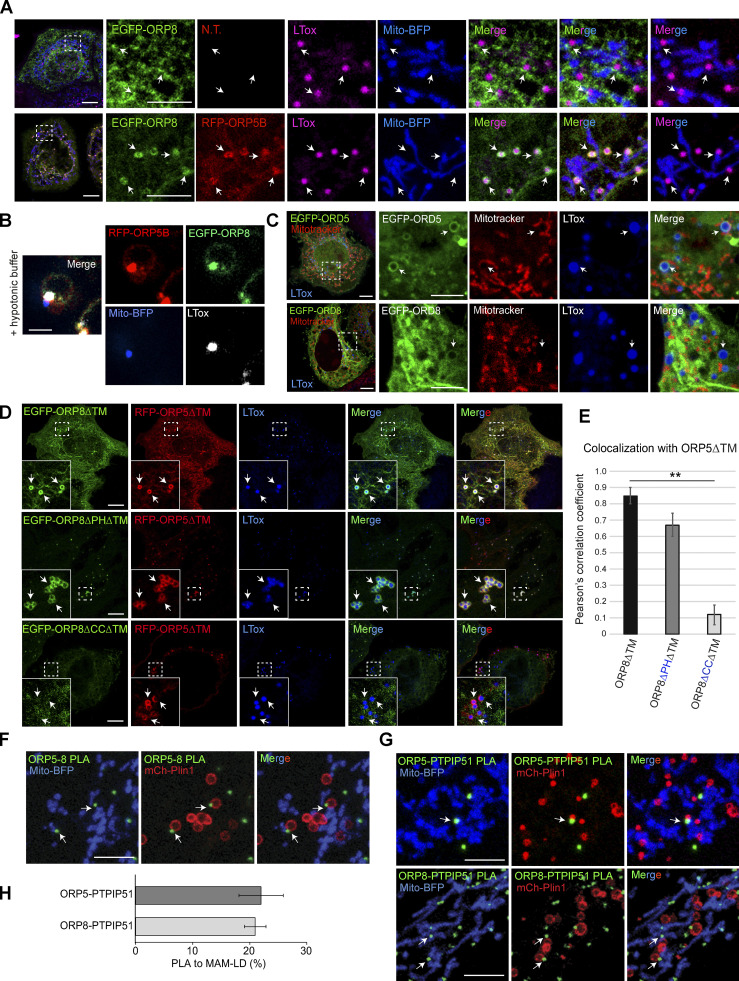
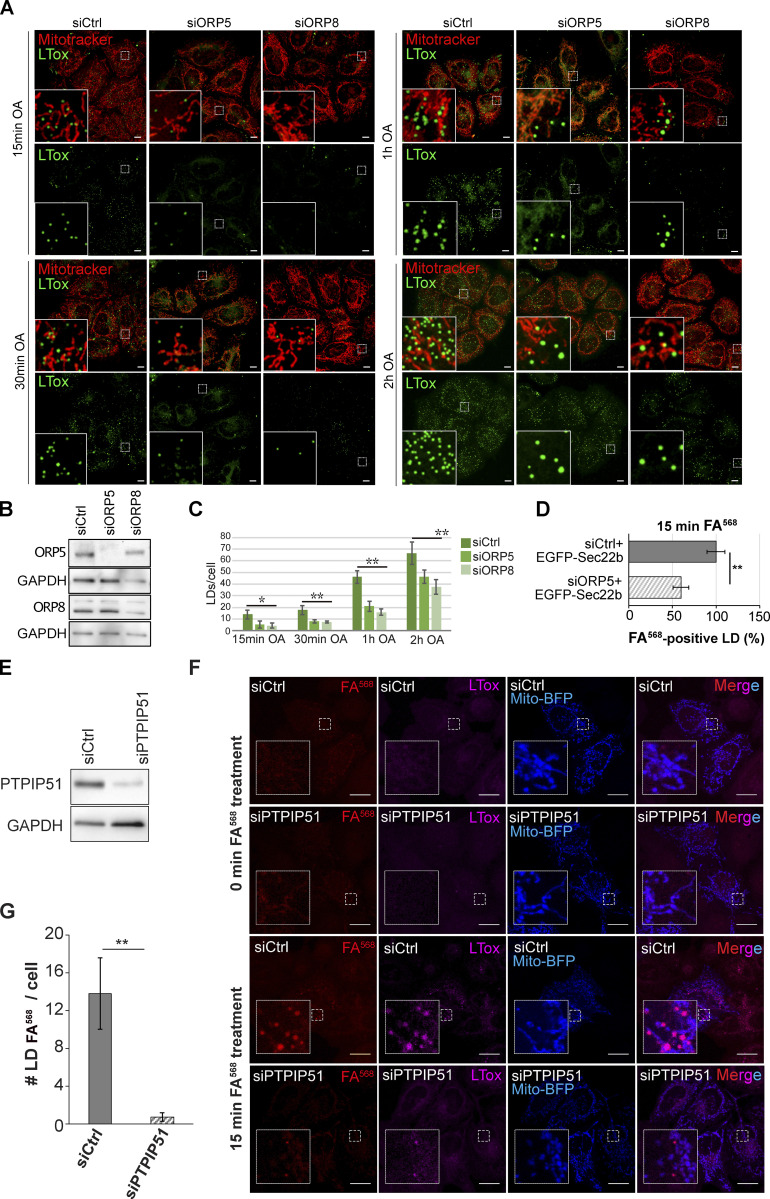
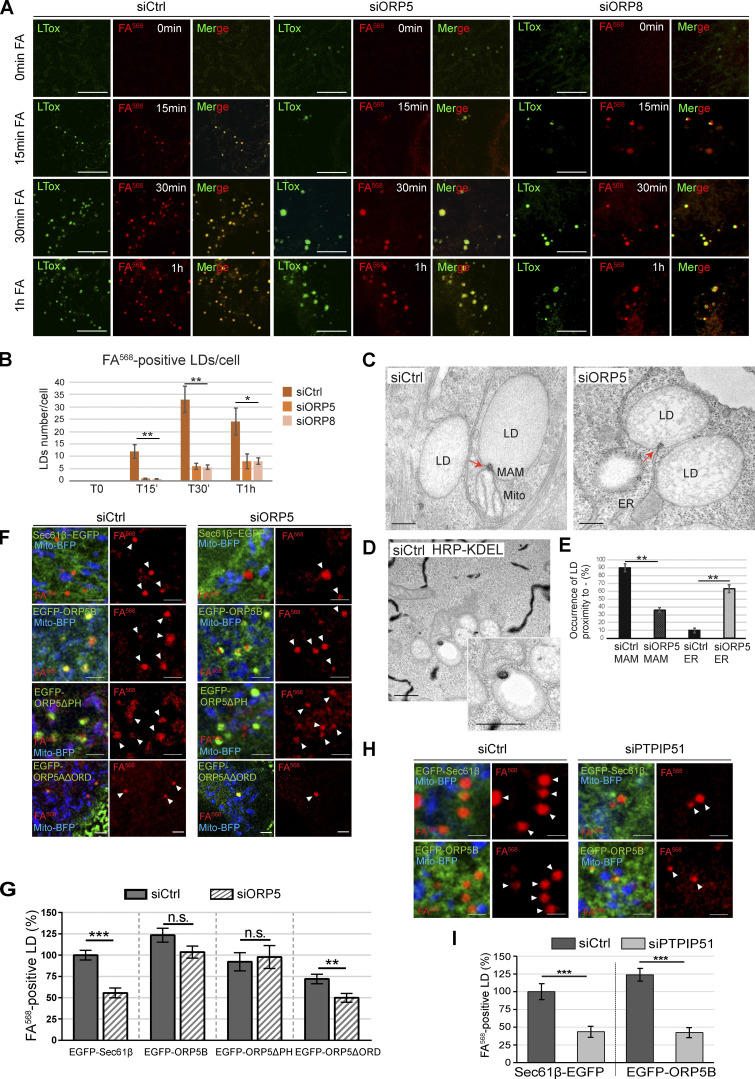
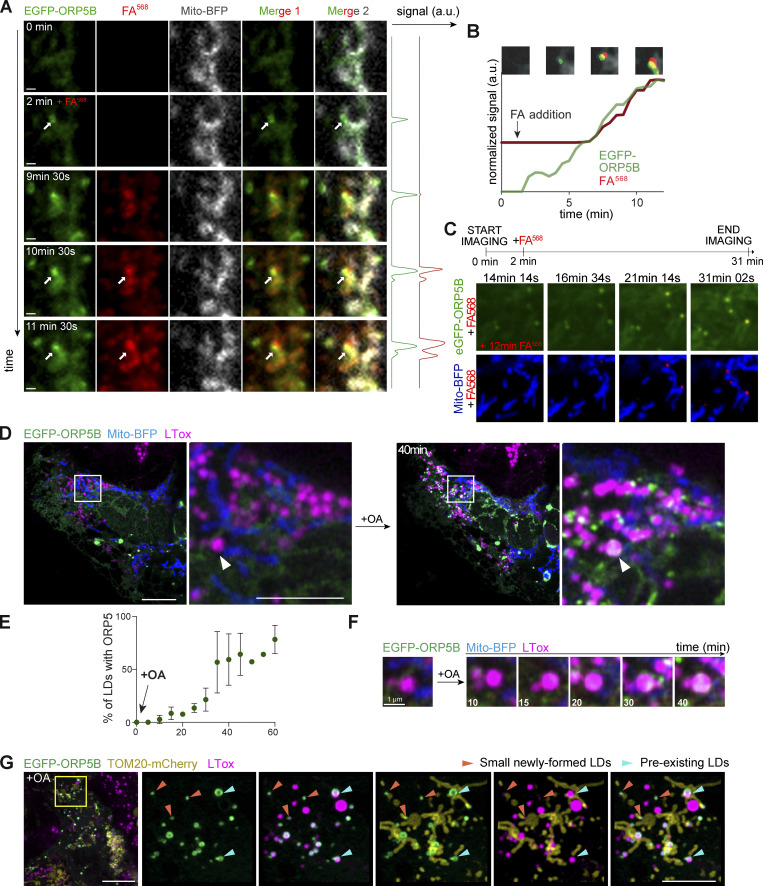
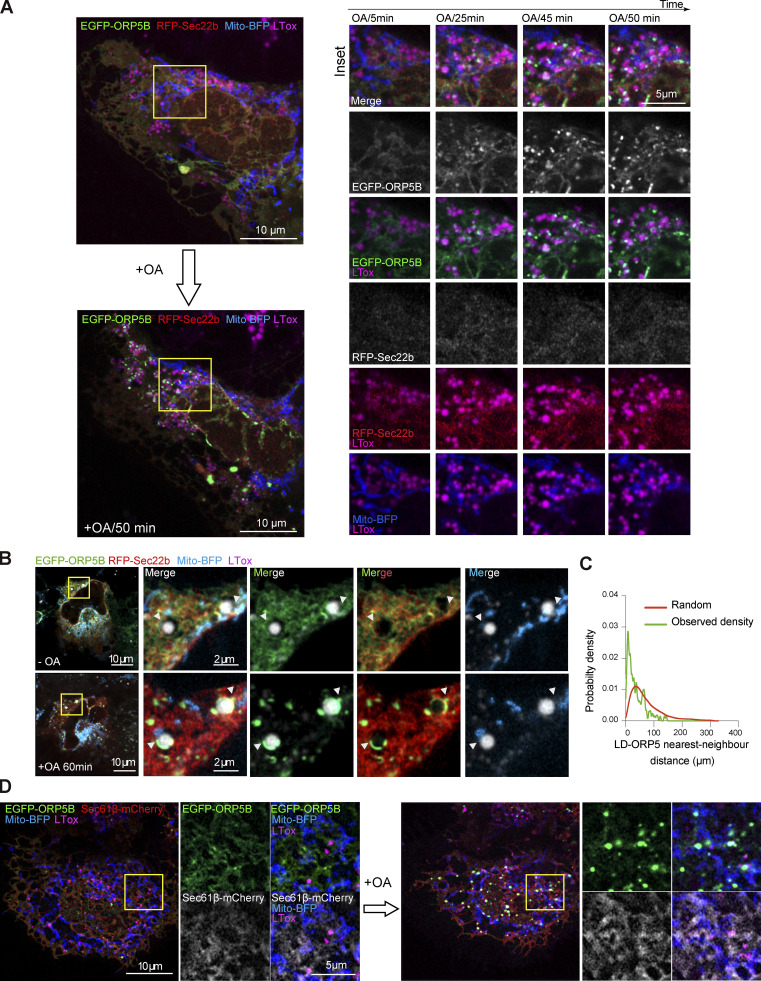
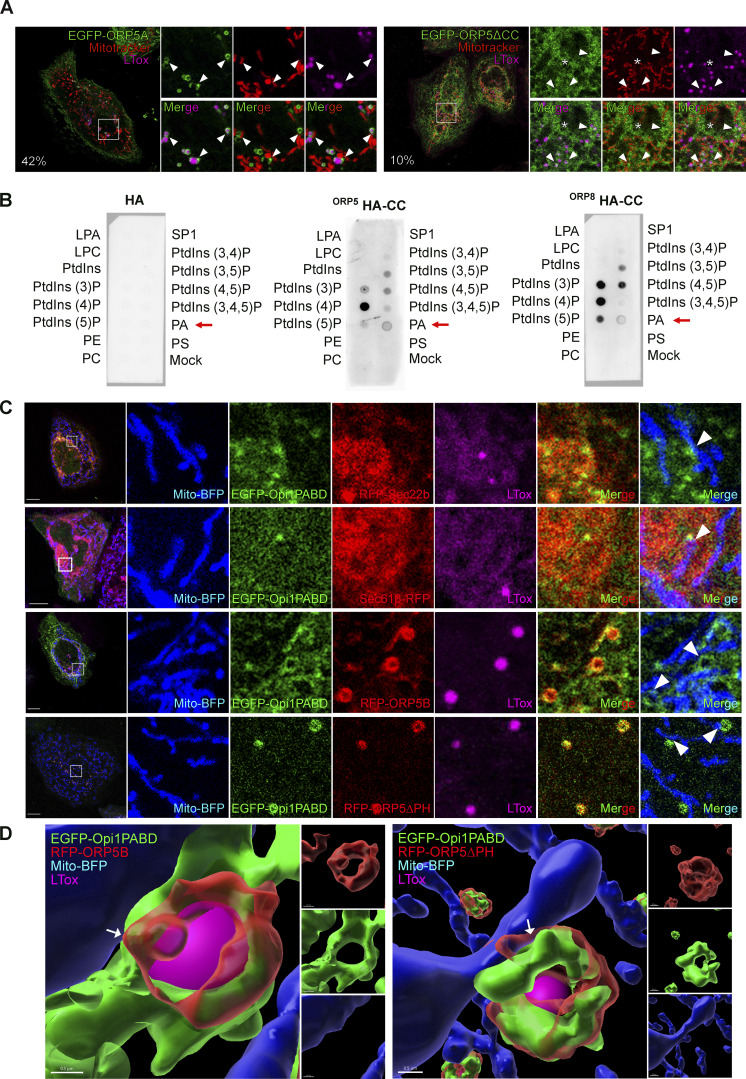
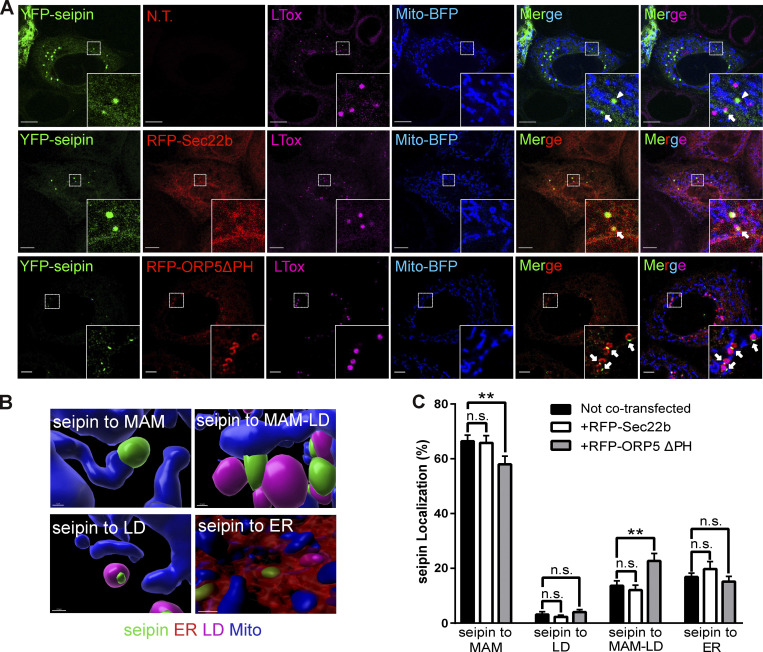
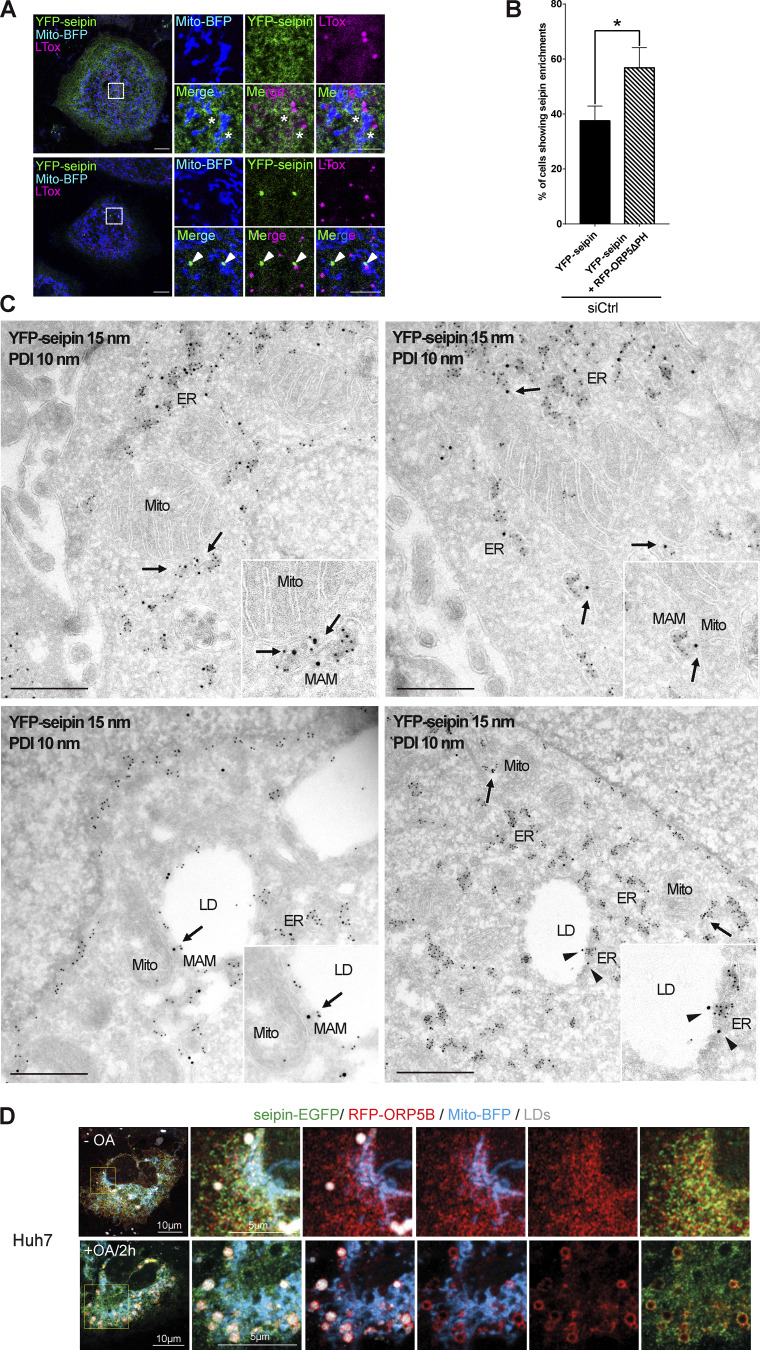
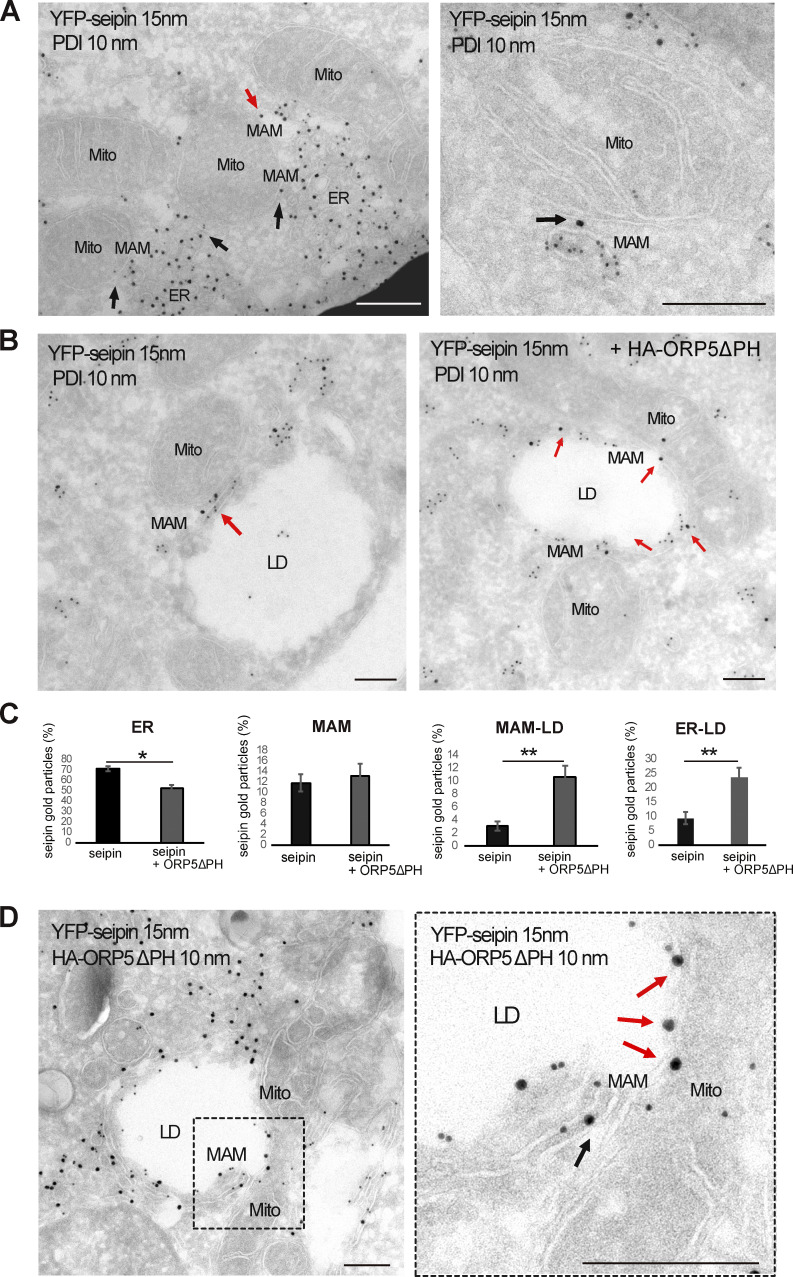
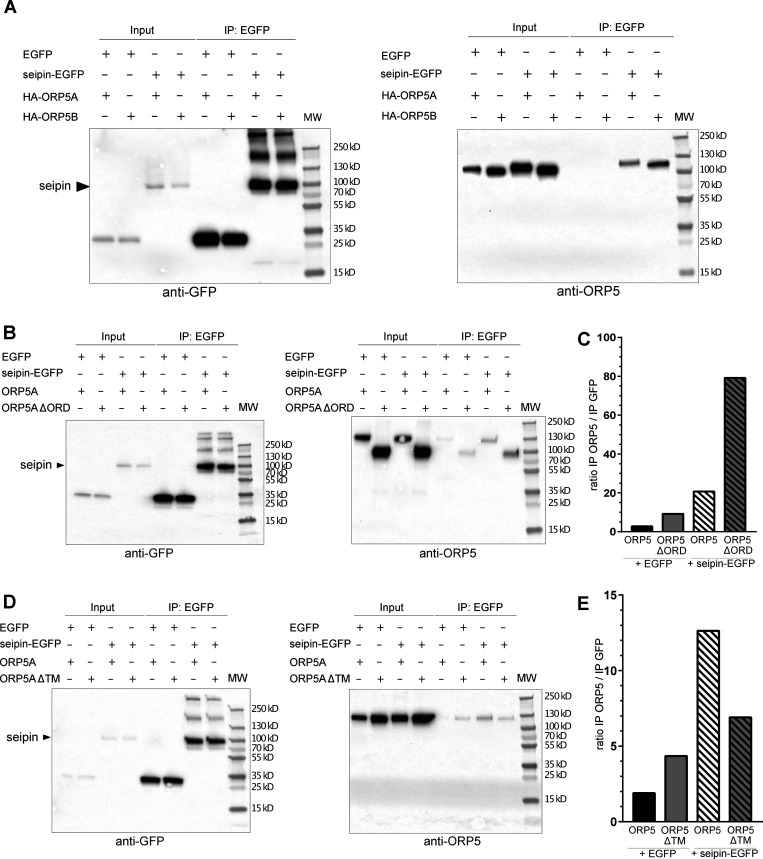
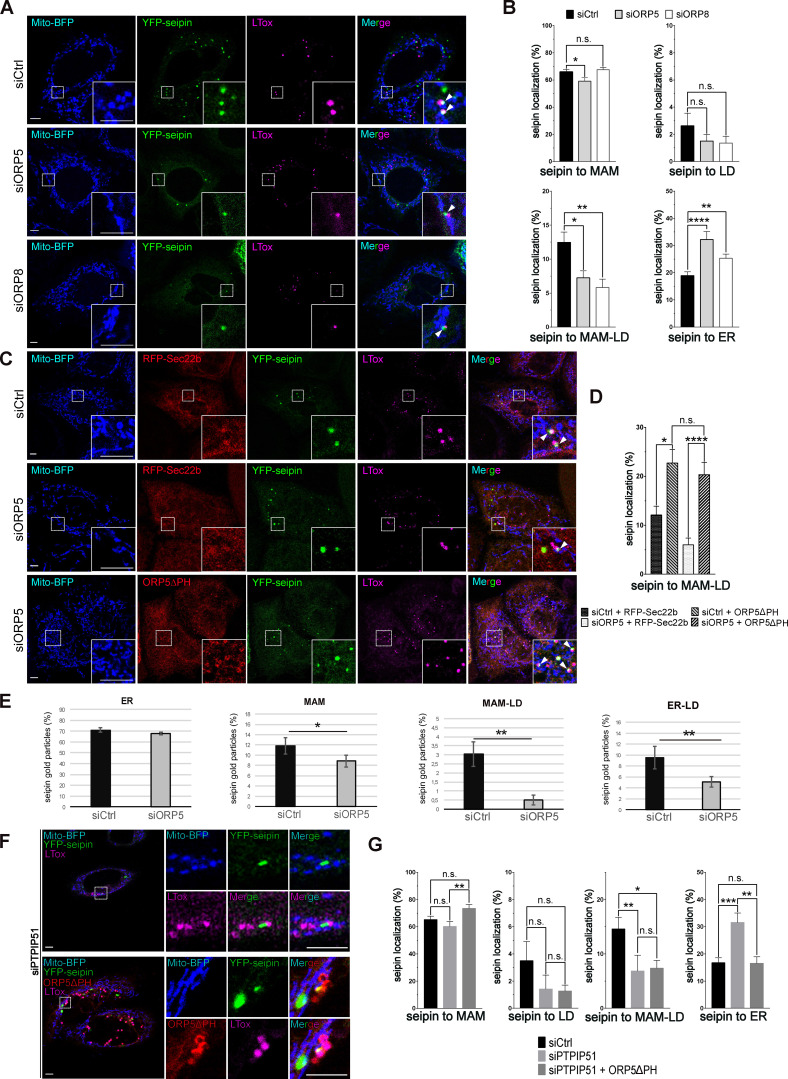
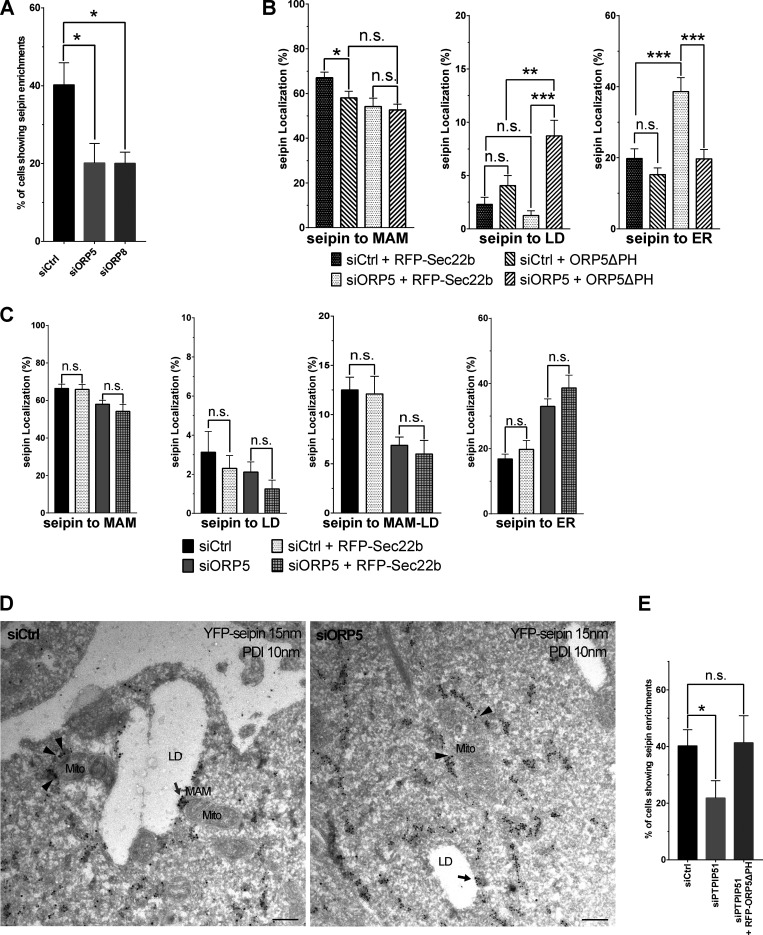
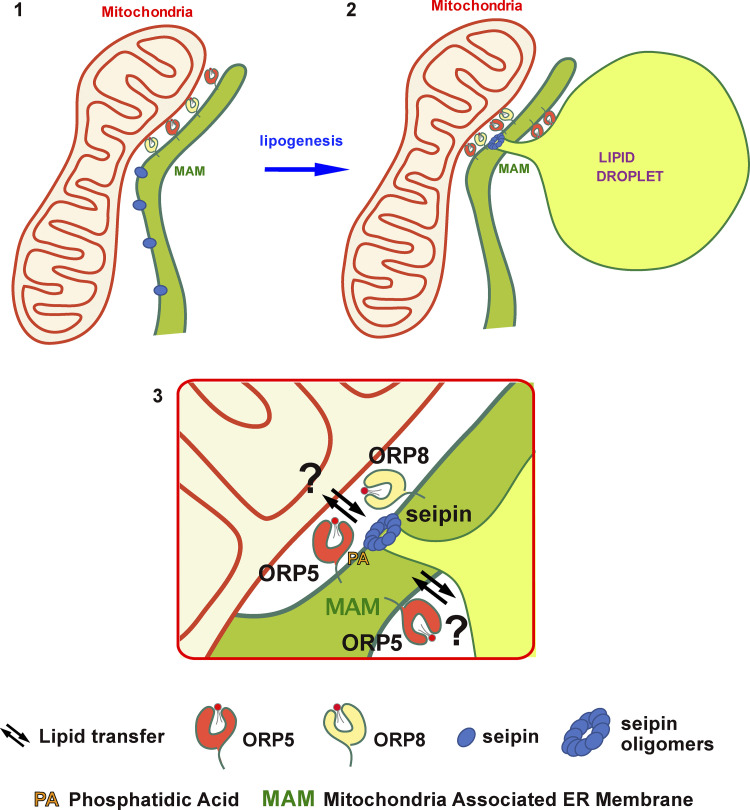
Lipid droplets (LDs) are the primary organelles of lipid storage, buffering energy fluctuations of the cell. They store neutral lipids in their core that is surrounded by a protein-decorated phospholipid monolayer. LDs arise from the endoplasmic reticulum (ER). The ER protein seipin, localizing at ER-LD junctions, controls LD nucleation and growth. However, how LD biogenesis is spatially and temporally coordinated remains elusive. Here, we show that the lipid transfer proteins ORP5 and ORP8 control LD biogenesis at mitochondria-associated ER membrane (MAM) subdomains, enriched in phosphatidic acid. We found that ORP5/8 regulates seipin recruitment to these MAM-LD contacts, and their loss impairs LD biogenesis. Importantly, the integrity of ER-mitochondria contact sites is crucial for ORP5/8 function in regulating seipin-mediated LD biogenesis. Our study uncovers an unprecedented ORP5/8 role in orchestrating LD biogenesis and maturation at MAMs and brings novel insights into the metabolic crosstalk between mitochondria, ER, and LDs at the membrane contact sites.


Figures

Figure 1.
Figure 1.
ORP5 localizes to MAM subdomains in contact with LD. (A) Representative confocal images showing single focal planes of HeLa cells expressing EGFP-ORP5A, EGFP-ORP5B, or EGFP-ORP5ΔPH (green) and treated with Mitotracker (red) and LTox Deep Red (LTox, purple) to label mitochondria and lipid droplets (LDs), respectively. Scale bar, 10 μm (entire cell), or 5 μm (zoom). (B) Quantification of the % of HeLa cells showing localization of EGFP-tagged ORP5A, ORP5B, and ORP5ΔPH to ER-LD contacts close to mitochondria in the absence of oleic acid (OA) or after 2 h of 300 μM OA loading. Data represent the mean ± standard error of the mean (SEM) of n = 25 cells. **P < 0.01, ***P < 0.001, unpaired two-tailed t test. (C) SIM micrographs of HeLa cells expressing EGFP-ORP5B or EGFP-ORP5ΔPH (green), treated with OA for 2 h, and stained with Mitotracker (red) and LTox Deep Red (purple). 3D-SIM images were obtained by segmentation using Software Imaris (v 9.3, Bitplaine). Scale bar, 5 μm (entire cell), or 2.5 μm (zoom). (D) Electron micrograph of ultrathin cryosections of HeLa cells transfected with EGFP-ORP5ΔPH, treated with OA for 2 h, and immunogold stained with anti-EGFP (15 nm gold). Left: red arrows indicate EGFP-ORP5ΔPH localized to MAM. Right: blue arrows indicate ORP5ΔPH localized to ER–LD contacts and red arrows indicate ORP5ΔPH localized to MAM–LD contacts. Scale bar, 500 nm. (E) Quantification of the distribution of EGFP-ORP5B and EGFP-ORP5ΔPH immunogold particles (15 nm) to the different ER compartments: MAM, MAM–LDs, ER–LDs (associated to MAM–LDs), ER–LDs (isolated) and reticular ER, after 2 h of OA. Data are shown as % of mean ± SEM of cell profiles with n = 20 (360 and 470 gold particles analyzed in EGFP-ORP5B and EGFP-ORP5ΔPH overexpression, respectively). (F) Representative electron micrographs of HeLa cells co-overexpressing EGFP-ORP5A or EGFP-ORP5ΔPH and HRP-KDEL after 2 h OA treatment, and 3D reconstruction of 27 serial sections by 3Dmod. LD, lipid droplet; Mito, mitochondria; ER, endoplasmic reticulum. Scale bar 500 nm.
Figure S1.
Figure S1.
ORP5 localizes to MAM subdomains in contact with LD. (A) Airyscan live imaging of swollen Huh7 cells co-expressing EGFP-ORP5B (green), Mito-BFP (blue) and KDEL-RFP (red). Scale bar, 10 μm (entire cell), or 5 μm (zoom). (B) Live imaging of EGFP-ORP5B (green), Mito-BFP (yellow) and LDs (purple) 10 min after swelling Huh7 cells. Zoom area is shown below, normal and enhanced EGFP-ORP5 signal to visualize its ER membrane signal (indicated by arrowheads). The bar graphs, from left to right, show (left) the percentage of ER–LD vs. ER–LD contacts events (n = 100) and (right) the signal ratio of EGFP-ORP5 intensity at the ER–LD contacts to the ER membrane (n = 20), as depicted by the illustrating image. Scale bar, 10 μm (entire cell), or 2 μm (zoom). (C) Electron micrograph of ultrathin cryosections of HeLa cells transfected with EGFP-ORP5B treated with OA for 2 h, and immunogold stained with anti-EGFP (15 nm gold) and anti PDI (ER marker). Red arrows indicate ORP5 gold particles localized to MAM-LD contacts. Blue arrows indicate PDI-labeled ER. Scale bar, 500 nm. (D) Electron micrographs of HeLa cells overexpressing HRP-KDEL alone or together with either EGFP-ORP5A (wt) or EGFP-ORP5ΔPH after OA treatment (300 μM for 2 h). Scale bar, 250 nm. (E) Representative confocal images (single focal plane) of HeLa cells co-expressing either EGFP-ORP8 or RFP-Sec61β (green) and RFP-ORP5B (red) and stained with LTox (blue). Scale bar 10 μm (entire cell), or 5 μm (zoom). (F) Representative confocal image (single plane) of control (intact cells) and swollen (+ hypotonic buffer) Huh7 cells co-expressing EGF-ORP8, RFP-ORP5 and Mito-BFP, and treated with LTox (white) to label LDs. (G) Confocal images (single focal plane) of HeLa cells expressing EGFP-ORP5A∆TM or EGFP-ORP8∆TM (green) and treated with LD450. Scale bar, 10 μm (entire cell), or 5 μm (zoom).
Figure 2.
Figure 2.
ORP8 localizes and interacts with ORP5 at MAM-LD contacts. (A) Representative confocal images showing localization of EGFP-ORP8 alone (green) or together with RFP-ORP5B (red) in HeLa cells co-expressing Mito-BFP (blue) and treated with OA for 2 h and stained with LTox Deep Red (purple). Each image represents a single focal plane of confocal 3D stacks. Arrows point to ORP5-labeled MAM associated with mitochondria and LD (MAM-LD contacts). Scale bar, 10 μm (entire cell) or 5 μm (zoom). (B) Zoomed confocal images showing the co-localization of ORP5, ORP8, LD, and mitochondria in swollen Huh7 cells expressing RFP-ORP5B, EGFP-ORP8, and Mito-BFP. Scale bar, 3 μm. (C) Confocal images showing the localization of EGFP-ORD5 and EGFP-ORD8 (green) in HeLa cells treated with OA for 2 h and stained with Mitotracker (red) and LTox Deep Red (blue). Each image represents a single focal plane. Scale bar, 10 μm (entire cell), or 5 μm (zoom). (D) HeLa cells co-expressing EGFP-ORP8ΔTM (green) and RFP-ORP5ΔTM (red), EGFP-ORP8ΔPHΔTM (green) and RFP-ORP5ΔTM (red), or EGFP-ORP8ΔCCΔTM (green) and RFP-ORP5ΔTM (red). Each image represents a single focal plane of confocal 3D stacks. Arrows point to ORP5 localization on the LD surface. Scale bar, 10 μm. (E) Quantitative analysis of the co-localization of either EGFP-ORP8ΔTM, EGFP-ORP8ΔPHΔTM or EGFP-ORP8ΔCCΔTM with RFP-ORP5ΔTM by Pearson’s correlation coefficient. Data represent mean ± SEM of n = 10 cells. **P < 0.001, unpaired student’s t test. (F and G) Confocal micrographs showing endogenous ORP5-ORP8, ORP5-PTPIP51, and ORP8-PTPIP51 PLA interactions (green dots) in regions of HeLa cells co-expressing Mito-BFP (blue) and mCherry-Plin1 (mCh-Plin1) and treated with 300 μM OA for 2 h. Arrows point to PLA dots associated to MAM–LD contacts. Images represents a single focal plane. Scale bar, 10 μm. (H) Quantification of endogenous ORP5-PTPIP51 and ORP8-PTPIP51 PLA interaction at MAM–LD contacts. Data is shown as % mean ± SEM of n = 36 cells (ORP5-PTPIP51) and n = 15 cells (ORP8-PTPIP51).
Figure S2.
Figure S2.
ORP5, ORP8 and PTPIP51 depletion impairs LD formation in HeLa cells. (A) LD biogenesis time-course. Confocal (single focal plane) images of control (siCtrl), and ORP5 (siORP5) or ORP8 (siORP8) siRNA-treated HeLa cells, delipidated for 72 h, and incubated with OA (300 μM) for 15 min, 30 min, 1 and 2 h. Cells were also stained with Mitotracker (red) and LTox (green). Scale bar, 10 μm. (B) WB analysis showing ORP5, ORP8 and GAPDH levels in protein lysates from Ctrl, ORP5 and ORP8 knockdown HeLa cells. (C) Quantification of the number of LTox-positive LDs in siCtrl, siORP5, or siORP8 cells in the indicated times after OA delivery. Data are shown as mean ± SEM of n = 30 cells. *P < 0.01, **P < 0.0001, unpaired two-tailed t test. (D) Analysis of FA568-positive LD in siCtrl and siORP5 HeLa cells, priorly delipidated for 72 h, and then co-transfected with Mito-BFP and EGFP-Sec22b. Data are show as % of siCtrl treated HeLa cells. n = 27 siCtrl and n = 24 siORP5. Bar indicated SEM. **P < 0.001, unpaired two-tailed t test. (E) Western blot analysis of the expression of PTPIP51 in siCtrl and siPTPIP51 HeLa cells, showing the efficiency of PTPIP51 knockdown. (F) Confocal (single focal plane) images of control (siCtrl) and PTPIP51 (siPTPIP51) siRNA-treated HeLa cells, delipidated for 72 h, and transfected with Mito-BFP (blue). Cells were treated with FA568 (1 μM) for 15 min, and stained with LTox (purple). Scale bar, 10 μm. (G) Analysis of the number of FA568-positive LDs in control and PTPIP51 knockdown cells. Data are show as mean ± SEM of n = 15 in siCtrl and n = 16 in siPTPIP51 cells. ***P < 0.001, unpaired two-tailed t test. Source data are available for this figure: SourceData FS2.
Figure 3.
Figure 3.
Depletion of ORP5 and ORP8 affect LD biogenesis. (A) LD biogenesis time-course. HeLa cells delipidated for 72 h were treated with siCtrl, siORP5, or siORP8, incubated with 1 μM FA568 (red) and stained with LTox Deep Red (green). Representative confocal images of regions of HeLa cells submitted to these experimental conditions at time 0 min, 15 min, 30 min and 1 h of FA568 incubation are displayed as a single focal plane. Scale bar, 5 μm. (B) Quantification of the number of FA568-positive LD in control, ORP5 and ORP8 knockdown HeLa cells at the indicated times. Data represent mean ± SEM of n = 30 cells. *P < 0.001, **P < 0.0001, unpaired two-tailed t test. (C) Representative electron micrographs of control and ORP5 knockdown HeLa cells, evidencing (red arrows) the electrondense structure that connects the nascent LD to the ER from which it originated and sometimes also to the mitochondria (Mito) at MAM–LD contacts. Scale bar, 250 nm. (D) Representative electron micrograph of HeLa cells expressing HRP-KDEL (black), showing that the electrondense structure shown on Fig. 3 C is MAM. Scale bar 500 nm. (E) Quantification of the number of LD associated with these ER or MAM electrondense structures. Data represent mean ± SEM of n = 20 cells. **P < 0.0001, unpaired two-tailed t test. (F) Confocal (single focal plane) micrographs of regions of control and ORP5 knockdown delipidated HeLa cells co-overexpressing Mito-BFP (blue) with Sec61β-EGFP (green), EGFP-ORP5B (green), EGFP-ORP5ΔPH (green), or EGFP-ORP5AΔORD (green). Arrowheads indicate the newly formed LD. Scale bar, 2 μm. (G) Quantitative analysis of the number of FA568-positive LD in control and ORP5 knockdown delipidated HeLa cells co-overexpressing Mito-BFP and Sec61β-EGFP, siRNA-resistant EGFP-ORP5B or EGFP-ORP5ΔPH, or EGFP-ORP5AΔORD, and treated for 15 or 30 min with FA568. Data are shown as % of mean ± SEM of n = 20–85 cells. ***P < 0.001, unpaired two-tailed t test. (H) Confocal (single focal plane) micrographs of regions of control and PTPIP51 knockdown delipidated HeLa cells, co-overexpressing Mito-BFP (blue) with Sec61β-EGFP (green) or EGFP-ORP5B (green) and treated for 1 h with FA568. Arrowheads indicate the newly formed LD. Scale bar, 1 μm. (I) Quantification of the number of FA568-positive LD in control and PTPIP51 knockdown delipidated HeLa cells co-overexpressing Mito-BFP and Sec61β-EGFP, or EGFP-ORP5B and treated for 1 h with FA568. Data are shown as % of mean ± SEM of n = 20–22 cells. ***P < 0.001, unpaired two-tailed ttest.
Figure 4.
Figure 4.
ORP5 specifically localizes to ER subdomains where LDs originate and also to the preexisting lipid droplets. (A) Zoom of spinning video snapshots of HeLa cells expressing EGFP-ORP5B (green) and Mito-BFP (grey). After 2 min of acquisition, the cells were treated with FA568 (red) at 1 µM. Arrows indicate ORP5-labeled MAM-LD contacts associated to mitochondria. Scale bar, 1 µm. (B) Full time course analysis of the intensity changes for ORP5B (green) and FA568 (red) over time. (C) Additional spinning video snapshots of a region of HeLa cells expressing EGFP-ORP5B (green) and Mito-BFP (blue). After 2 min of acquisition, the cells were treated with FA568 at 1 µM. Arrows indicate ORP5-labeled MAM-LD contacts associated with mitochondria. Full cell view in Fig. S6 B. Scale bar, 1 µm. (D) Example of an Airyscan video snapshots of Huh7 cells expressing EGFP-ORP5B (green), RFP-Sec22b (red, shown in Fig. S3 A), and Mito-BFP (blue) before and after 40 min of 200 μM OA treatment. The lipid droplets were stained using LTox Deep Red (purple). Arrowheads indicate absence or presence of ORP5B at MAM-LD contacts before and after OA treatment, respectively. Full sequence in Fig. S3 A. Scale bar, 10 μm (entire cell), or 5 μm (zoom). (E) Quantification of the % of LDs with EGFP-ORP5 over the indicated time points. (F) Time course of ORP5 recruitment to a large pre-existing LDs depicted by the white arrowhead in the Huh7 cell in C. Scale bar, 1 µm. (G) Representative Airyscan snapshot of Huh7 cells expressing EGFP-ORP5B (green) and TOM20-mCherry (yellow), staining mitochondria, after 1 h 30 min of 200 μM OA treatment. The lipid droplets were stained using LTox Deep Red (purple). Scale bar, 10 μm (entire cell), or 5 μm (zoom). Orange arrowheads indicate small emerging LDs, light green arrowheads indicate pre-existing LDs.
Figure S3.
Figure S3.
ORP5 localizes to nascent LDs and the preexisting ones in Huh7. (A) Airyscan video snapshots of Huh7 cells expressing EGFP-ORP5B (green), RFP-Sec22b (red) and Mito-BFP (blue). Cells were treated with OA to induce the formation of LDs, and stained by LTox (purple). Images were taken every 5 min for 50 min. Scale bar, 10 μm (entire cell), or 5 μm (zoom). (B) Another example depicting the recruitment of ORP5 to pre-existing LDs, with mitochondria. Arrowheads indicate EGFP-tagged ORP5 at MAM-LD contacts. Scale bar, 10 μm (entire cell), or 2 μm (zoom). (C) Line graph shows the distribution of the nearest-neighbor EGFP-ORP5B puncta to LDs in the images of Huh7 cells treated with OA. The observed probability density largely deviates from randomly distributed LD and puncta EGFP-ORP5B. (D) Airyscan video snapshots of Huh7 cells expressing EGFP-ORP5B (green), Sec61β-mCherry (red) and Mito-BFP (blue). Cells were treated with OA to induce the formation of LDs, and stained by LTox (purple). Scale bar, 10 μm (entire cell), or 5 μm (zoom).
Figure 5.
Figure 5.
ORP5 localizes to LDs and ER subdomains enriched in phosphatidic acid (PA). (A) Confocal images (single focal plane of HeLa cells expressing EGFP-tagged ORP5A or ORP5∆CC (green), treated with OA (300 μM) for 2 h. The mitochondria and the LDs were stained with Mitotracker (red) and LTox (purple), respectively. Arrowhead points ORP5-labeled MAM-LD associated with mitochondria and asterisks marks ORP5 localized to reticular ER. Scale bar, 5 µm. (B) PIP strip overlay assay: PIP strips were incubated with either ORP5-HA CC or ORP8-HA CC or the HA peptide as a negative control and analyzed using the anti-HA antibody. LPA, lysophosphatidic acid; LPC, lysophosphocholine; PtdIns, phosphatidylinositol; PtdIns(3)P; PtdIns(4)P; PtdIns(5)P; PtdIns(3,4)P2; PtdIns(3,5)P2; PtdIns(4,5)P2; PtdIns(3,4,5)P3; PA, phosphatidic acid; PS, phosphatidylserine; PE, phosphatidylethanolamine; PC, phosphatidylcholine; S1P, sphingosine 1-phosphate. (C) Confocal images (single focal plane) of HeLa cells co-expressing EGFP-Opi1PABD (green) with Mito-BFP (blue) and either RFP-Sec22b (red), or Sec61β-RFP, or EGFP-ORP5B (red), or EGFP-ORP5∆PH. The LDs were stained with LTox (purple). Arrowheads points enrichment of Opi1PABD at Mito–MAM–LD contact sites. Scale bar, 10 μm (entire cell), or 3 μm (zoom). (D) 3D reconstruction of cells shown in D using IMARIS. Arrows point to the MAMs where ORP5B and ORP5∆PH co-localize with Opi1PABD at Mito–MAM–LD contact sites. Scale bar, 0.5 µm.
Figure 6.
Figure 6.
ORP5 over-expression induces an increase of the localization of seipin to MAM–LD contact sites. (A) Representative confocal images showing a single focal plane of HeLa cells expressing YFP-seipin (green), Mito-BFP (blue) and Sec22b (red) or ORP5∆PH (red). The LDs were stained LTox (purple). Arrowhead points seipin enrichment at MAM–mitochondria contact sites and arrows mark seipin enrichment at Mito–MAM–LD contact sites. Scale bar, 10 µm. (B) Representative 3D reconstruction images of the different categories for the classification of the localization. (C) Analysis of the localization of seipin enrichments in HeLa cells expressing seipin alone or in co-expression with Sec22b or ORP5∆PH. Data are shown as % mean ± SEM of cell of n = 56 cells in YFP-seipin (expressed alone), n = 14 cells in YFP-seipin + RFP-Sec22b, and n = 40 cells in YFP-seipin + RFP- ORP5∆PH, (** = P < 0.01; Wilcoxon-Mann-Whitney test).
Figure S4.
Figure S4.
ORP5 over-expression induces an increase of the localization of seipin to MAM-LD contact sites. (A) Confocal images (single focal plane) of HeLa cells expressing YFP-seipin (green) and Mito-BFP (blue). The LDs were stained LTox (purple). Upper panels show a cell with a reticular staining of seipin. Lower panels show a cell with enrichment of YFP-seipin in small “clusters.” Arrowheads show the enrichment of seipin in “clusters” closely opposed to MAM-LD contact sites. Asterisks show presence of seipin at MAM-LD contacts also in cells where it has a reticular distribution. Scale bar, 10 μm (entire cell) or 5 μm (zoom). (B) Quantification of the % of cells showing seipin enrichment at MAM-LD in cells expressing seipin alone or together with ORP5∆PH. Data are shown as % mean ± SEM of cells. n = 118 cells in siCtrl, n = 121 cells in siCtrl + RFP-ORP5∆PH. (C) Representative images of electron micrographs of ultrathin cryosections of HeLa cells transfected with YFP-seipin and immunogold stained with anti-GFP (15 nm gold) to detect seipin and anti-PDI (10 nm gold) to label the ER lumen. Arrows point the localization of seipin at MAM or MAM-LDs. Arrowheads point the localization of seipin at ER–LD contacts. Mito, mitochondria; ER, endoplasmic reticulum; MAM, mitochondria-associated membranes; LD, lipid droplets. Scale bar, 250 nm. (D) Confocal images (single focal plane) of Huh7 cells expressing seipin-EGFP (green), RFP-ORP5B (red) and Mito-BFP (blue) before and after 2 h of OA treatment. The LDs were stained with LTox (white). Scale bar, 10 μm (entire cell), or 5 μm (zoom).
Figure 7.
Figure 7.
ORP5∆PH increases the localization of seipin to MAM–LD and ER–LD contacts. (A) Representative images of electron micrographs of ultrathin cryosections of HeLa cells transfected with YFP-seipin and immunogold stained with anti-GFP (15 nm gold) to detect seipin and anti-PDI (10 nm gold) to label the ER lumen. Seipin localizes at MAM–LD contacts (arrows). Mito, mitochondria; ER, endoplasmic reticulum; MAM, mitochondria-associated membranes; LD, lipid droplets. Scale bar, 250 nm. (B) Representative images of electron micrographs of ultrathin cryosections of HeLa cells co-transfected with YFP-seipin alone or together with HA-ORP5. Cells were immunogold stained with anti-GFP (15 nm gold) to detect seipin and anti-PDI (10 nm gold) to label the ER. (C) Quantification of the distribution of seipin immunogold particles (15 nm). Data are shown as % mean ± SEM of cell profiles with n = 32 (750 gold particles analyzed) in seipin individual expression, and n = 50 (940 gold particle) in seipin + ORP5∆PH co-overexpression. *P < 0.001, **P < 0.0001, unpaired two-tailed t test. (D) Electron micrographs of ultrathin cryosections of HeLa cells co-transfected with YFP-seipin and HA-ORP5∆PH and immunogold stained with anti-GFP (15 nm gold) to detect seipin and anti-HA (10 nm gold) to detect ORP5. The localization of seipin at MAM-LD contacts is increased when co-expressed with ORP5∆PH (arrows). Scale bar, 250 nm.
Figure 8.
Figure 8.
ORP5 and seipin biochemically interact in lysates of HeLa cell. (A) Western blot analysis of ORP5A or ORP5B immunoprecipitated (IP) from lysates of HeLa cells co-expressing EGFP or seipin-EGFP with HA-ORP5A or HA-ORP5B, using antibodies against GFP (to detect seipin) or OA1 (to detect ORP5A or ORP5B). (B) Western blot analysis of co-IP products from HeLa cells co-expressing EGFP or seipin-EGFP with ORP5A or ORP5∆ORD using antibodies against GFP (to detect seipin) or OA1 (to detect ORP5A or ORP5∆ORD). (C) Relative quantification of ORP5A or ORP5∆ORD co-immunoprecipitated with seipin-EGFP or EGFP alone. (D) Western blot analysis of co-IP products from HeLa cells co-expressing EGFP or seipin-EGFP with HA-ORP5A or HA-ORP5∆TM, using antibodies against GFP (to detect seipin) or OA1 (to detect ORP5A or ORP5∆TM). (E) Relative quantification of ORP5A or HA-ORP5∆TM co-immunoprecipitated with seipin-EGFP or EGFP alone.
Figure 9.
Figure 9.
ORP5 affects the localization of seipin in a Mito-MAM contact sites integrity dependent way. (A) Representative confocal images (single focal plane) of HeLa cells treated with siCtrl or siORP5 or siORP8 RNA oligos. The cells were then transfected with YFP-seipin (green) and Mito-BFP (blue). The LDs were stained LTox (purple). Arrowheads point to seipin enrichment at MAM–LD contact sites. Scale bar, 5 µm. (B) Analysis of the distribution of seipin enrichments in HeLa cells expressing seipin and treated with either siCtrl, siORP5, or siORP8 interfering RNAs. Data are shown as % mean ± SEM of cells with n = 64 cells in siCtrl, n = 44 cells in siORP5, and n = 32 cells in siORP8 (* = P < 0.05; ** = P < 0.01; **** = P < 0.0001; Wilcoxon-Mann-Whitney test). (C) Confocal images (single focal plane) of HeLa cells treated with siCtrl or siORP5 or siORP8 RNA oligos. The cells were then transfected with YFP-seipin (green), Mito-BFP (blue) and either RFP-Sec22b (red) or ORP5∆PH (red). The LDs were stained LTox (purple). Arrowhead points seipin enrichment at MAM–LD contact sites. (D) Analysis of the distribution of seipin enrichments to MAM-LD contact sites in HeLa cells treated with siCtrl or siORP5 RNA oligos and then co-transfected with seipin and RFP-Sec22b or siRNA-resistant ORP5∆PH. Cells were treated with OA (300 μM) for 2 h before analysis. Data are shown as % mean ± SEM of cells. n = 14 cells in siCtrl + Sec22b, n = 17 cells in siORP5 + Sec22b, n = 41 cells in siCtrl + ORP5∆PH rescue and n = 19 cells in siORP5 + ORP5∆PH rescue (* = P < 0.05; **** = P < 0.0001; Wilcoxon-Mann-Whitney test). (E) Quantification of the distribution of the immunogold particles (15 nm) staining seipin in HeLa cells treated with siCtrl or siORP5. Data are shown as % mean ± SEM of cell profiles with n = 79 (1,500 gold particles analyzed) in siCtrl, and n = 64 (1,800 gold particle) in siORP5. * = P < 0.001, ** = P < 0.0001, unpaired two-tailed t test. (F) Representative confocal images (single focal plane) of HeLa cells treated with siPTPIP51 or siCtrl RNAs. The cells were then transfected with YFP-Seipin (green) alone or in co-expression with ORP5∆PH rescue (red). The LDs were stained with LTox (purple). Scale bar, 5 µm. (G) Quantification of the distribution of seipin immunogold particles in HeLa cells treated with siCtrl or siPTPIP51 and expressing seipin alone or in co-expression with siRNA-resistant ORP5∆PH. Data are shown as % mean ± SEM of cells with n = 41 cells in siCtrl, n = 25 cells in siPTPIP51, and n = 23 cells in siPTPIP51 + ORP5∆PH (* = P < 0.05; ** = P < 0.01; *** = P < 0.001; Wilcoxon-Mann-Whitney test).
Figure S5.
Figure S5.
ORP5 affects the localization of seipin in a ER-mitochondria contact sites integrity dependent way. (A) Quantification analysis of confocal data showing the percentage of YFP-seipin–expressing siCtrl or siORP5 or siORP8 cells displaying seipin enrichment at MAM-LD. Data are shown as % mean ± SEM of cell of n = 118 cells in siCtrl, n = 80 cells in siORP5 and n = 134 cells in siORP8. (B) Analysis of seipin localization to the indicated compartments (MAM = ER–Mito contacts, ER–LD = ER–LD contacts, ER = reticular ER) in siCtrl or siORP5 HeLa cells transfected with YFP-seipin and either RFP-Sec22b or siRNA-resistant ORP5∆PH. Data are shown as % mean ± SEM of cells. n = 14 cells in siCtrl + Sec22b, n = 17 cells in siORP5 + Sec22b, n = 41 cells in siCtrl + ORP5∆PH rescue and n = 19 cells in siORP5+ ORP5∆PH rescue (* = P < 0.05; ** = P < 0.01; *** = P < 0.001; Wilcoxon-Mann-Whitney test). (C) Quantitative analysis of the distribution of seipin enrichments in the indicated compartments (MAM = ER–Mito contacts, ER–LD = ER–LD contacts, MAM–LD = Mito–ER–LD contacts, ER = reticular ER) in HeLa cells treated with siCtrl or siORP5 and expressing YFP-seipin alone or together with RFP-Sec22b. Data are shown as % mean ± SEM of cell of n = 56 cells in siCtrl, n = 14 cells in siCtrl + Sec22b, n = 58 cells in siORP5 and n = 17 cells in siORP5 + Sec22b (n.s. = not significant; Wilcoxon-Mann-Whitney test). (D) Representative electron micrographs of ultrathin cryosections of HeLa cells transfected with YFP-seipin and immunogold stained with anti-GFP (15 nm gold) to detect seipin and anti-PDI (10 nm gold) to label the ER lumen. Arrows point to seipin localization at MAM–LD (red arrow) or ER–LD (black arrow). Arrowheads point to seipin localization at MAM. Mito, mitochondria; ER, endoplasmic reticulum; MAM, mitochondria-associated membranes; LD, lipid droplets. Scale bar, 250 nm. (E) Quantification of the % of siCtrl or siPTPIP51 cells transfected with YFP-seipin or of siPTPIP51 cells co-transfected with YFP-seipin and RFP-ORP5∆PH, showing seipin enrichment at MAM–LD. Data are shown as % mean ± SEM of cell of n = 118 cells in siCtrl, n = 91 cells in siPTPIP51, and n = 58 cells in siPTPIP51 + RFP-ORP5∆PH.
Figure 10.
Figure 10.
ORP5 and ORP8 orchestrate LD biogenesis at MAMs. (1 and 2) The ORP5/8 complex localizes at MAM subdomains (1) where LDs originate (2). (3) During lipogenesis, ORP5 and ORP8 interact with seipin and regulate its recruitment to MAM subdomains enriched in PA phospholipid (3) to sustain proper LD biogenesis. Our data suggest that ORP5/8 could regulate lipid transport pathways across the mitochondria—MAM—LD junctions.

Similar articles

Cited by

References

    1. Adeyo, O., Horn P.J., Lee S., Binns D.D., Chandrahas A., Chapman K.D., and Goodman J.M.. 2011. The yeast lipin orthologue Pah1p is important for biogenesis of lipid droplets. J. Cell Biol. 192:1043–1055. 10.1083/jcb.201010111 - DOI - PMC - PubMed
    1. Ajjaji, D., Ben M’barek K., Mimmack M.L., England C., Herscovitz H., Dong L., Kay R.G., Patel S., Saudek V., Small D.M., et al. . 2019. Dual binding motifs underpin the hierarchical association of perilipins1-3 with lipid droplets. Mol. Biol. Cell. 30:703–716. 10.1091/mbc.E18-08-0534 - DOI - PMC - PubMed
    1. Ben M’barek, K., Ajjaji D., Chorlay A., Vanni S., Forêt L., and Thiam A.R.. 2017. ER membrane phospholipids and surface tension control cellular lipid droplet formation. Dev. Cell. 41:591–604.e7. 10.1016/j.devcel.2017.05.012 - DOI - PubMed
    1. Benador, I.Y., Veliova M., Mahdaviani K., Petcherski A., Wikstrom J.D., Assali E.A., Acín-Pérez R., Shum M., Oliveira M.F., Cinti S., et al. . 2018. Mitochondria bound to lipid droplets have unique bioenergetics, composition, and dynamics that support lipid droplet expansion. Cell Metab. 27:869–885.e6. 10.1016/j.cmet.2018.03.003 - DOI - PMC - PubMed
    1. Bi, J., Wang W., Liu Z., Huang X., Jiang Q., Liu G., Wang Y., and Huang X.. 2014. Seipin promotes adipose tissue fat storage through the ER Ca²⁺-ATPase SERCA. Cell Metab. 19:861–871. 10.1016/j.cmet.2014.03.028 - DOI - PubMed

Publication types

MeSH terms