. 2022;14(6):1269-1294.
doi: 10.1016/j.jcmgh.2022.08.001. Epub 2022 Aug 13.

Sex-Dependent Hepatoprotective Role of IL-22 Receptor Signaling in Non-Alcoholic Fatty Liver Disease-Related Fibrosis

Affiliations

Sex-Dependent Hepatoprotective Role of IL-22 Receptor Signaling in Non-Alcoholic Fatty Liver Disease-Related Fibrosis

Mohamed N Abdelnabi et al. Cell Mol Gastroenterol Hepatol. 2022.

Abstract

Background & aims: Nonalcoholic fatty liver disease (NAFLD) is a major health problem with complex pathogenesis. Although sex differences in NAFLD pathogenesis have been reported, the mechanisms underlying such differences remain understudied. Interleukin (IL)22 is a pleiotropic cytokine with both protective and/or pathogenic effects during liver injury. IL22 was shown to be hepatoprotective in NAFLD-related liver injury. However, these studies relied primarily on exogenous administration of IL22 and did not examine the sex-dependent effect of IL22. Here, we sought to characterize the role of endogenous IL22-receptor signaling during NAFLD-induced liver injury in males and females.

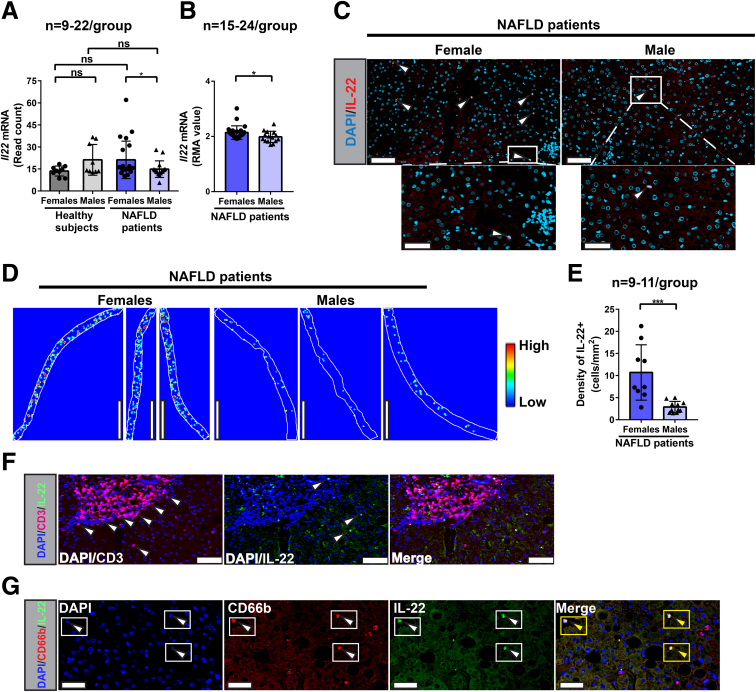
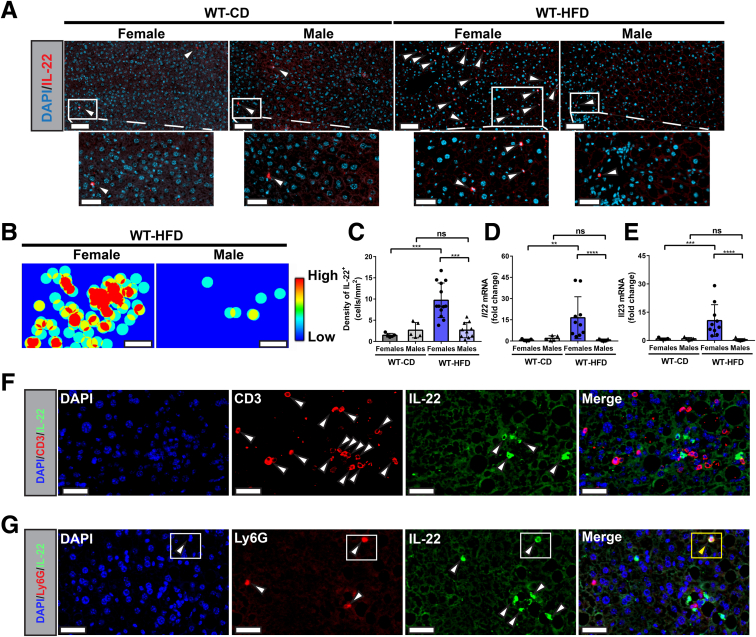
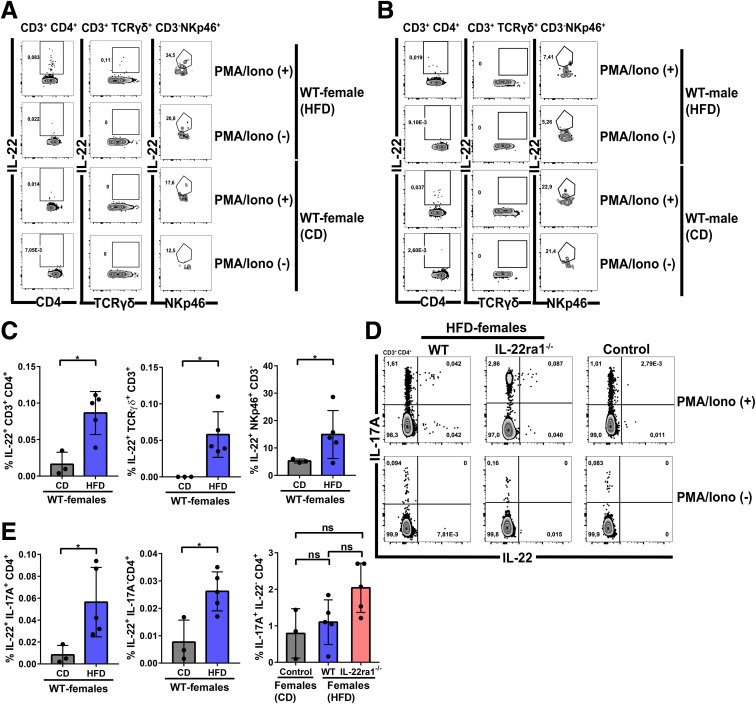
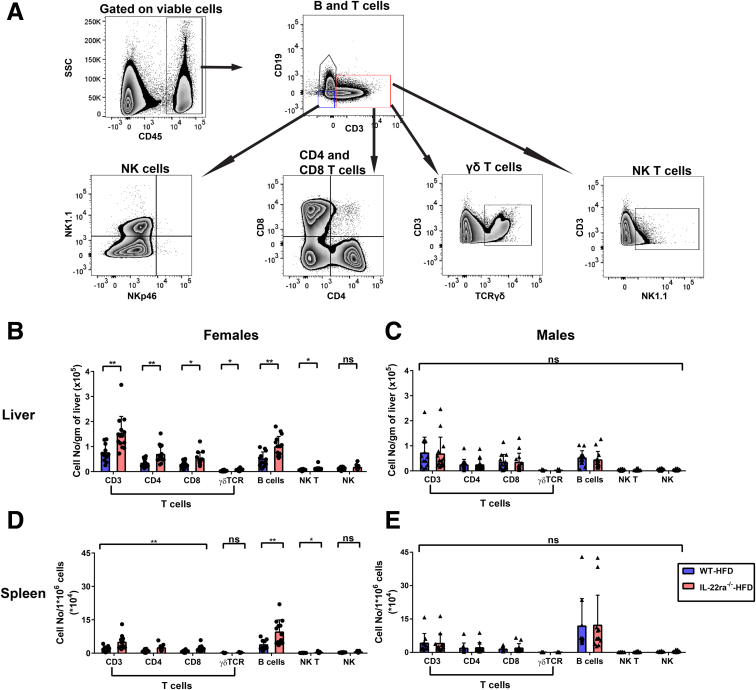
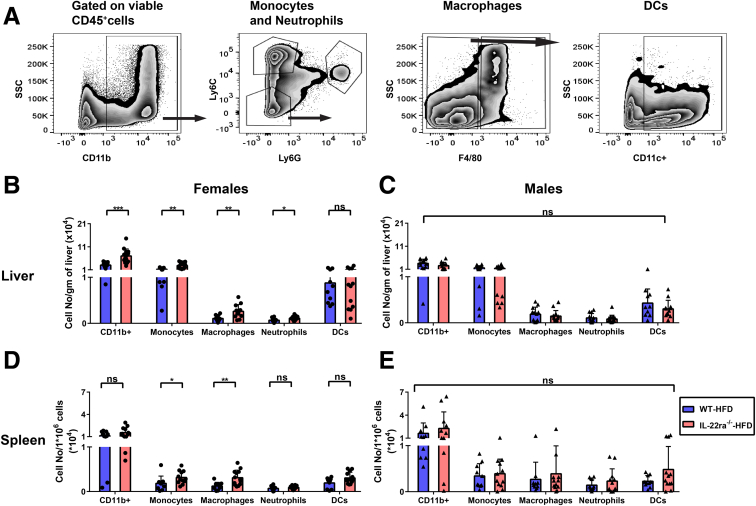
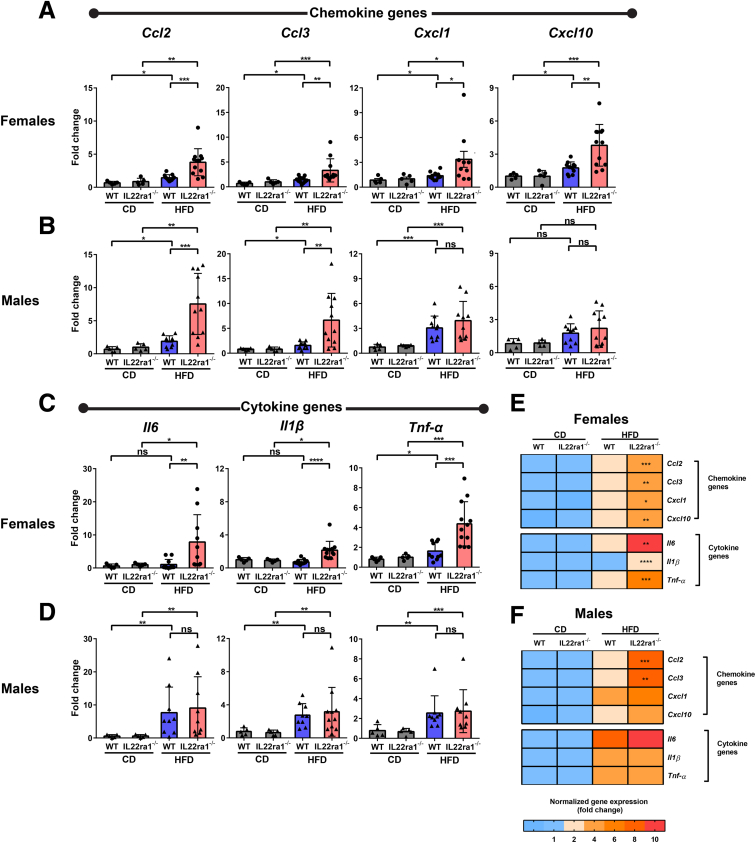
Methods: We used immunofluorescence, flow cytometry, histopathologic assessment, and gene expression analysis to examine IL22 production and characterize the intrahepatic immune landscape in human subjects with NAFLD (n = 20; 11 men and 9 women) and in an in vivo Western high-fat diet-induced NAFLD model in IL22RA knock out mice and their wild-type littermates.

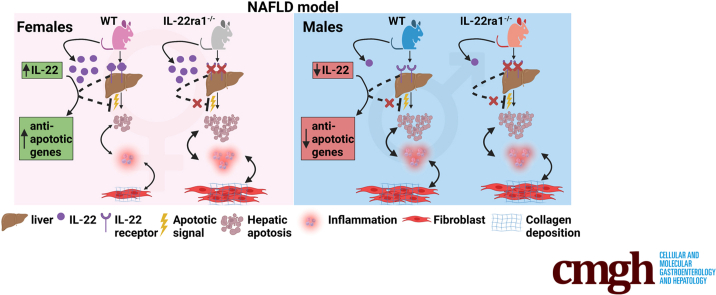
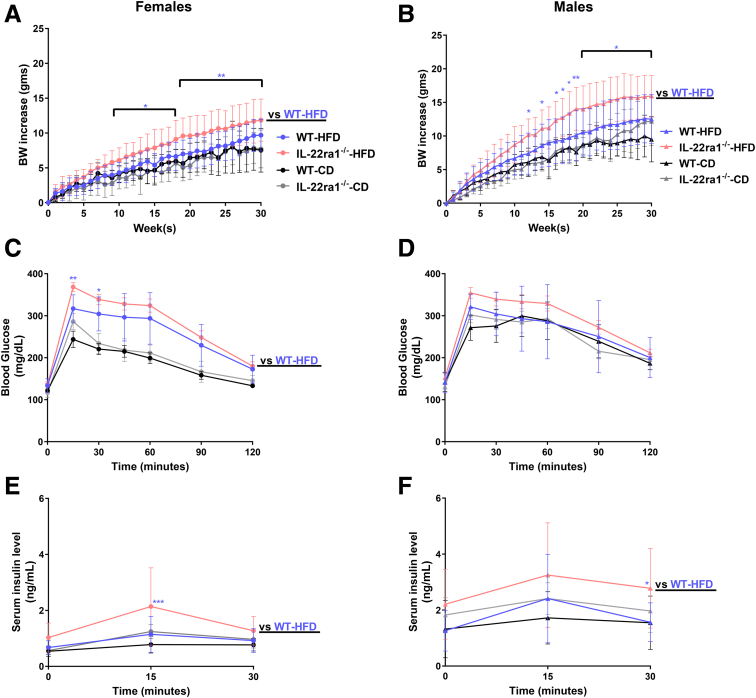
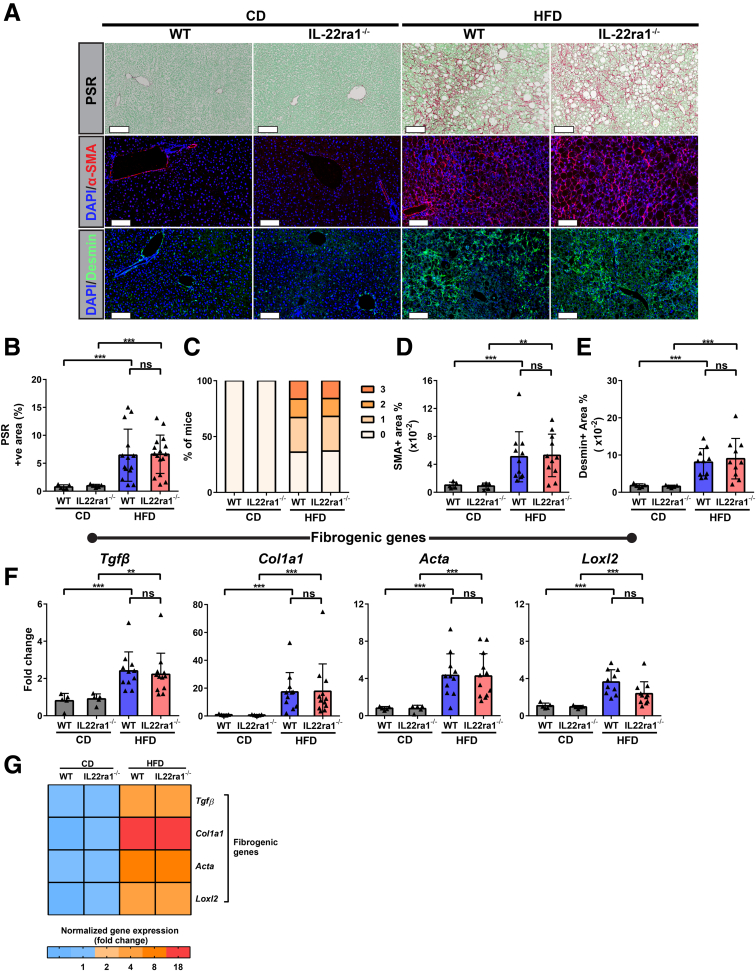
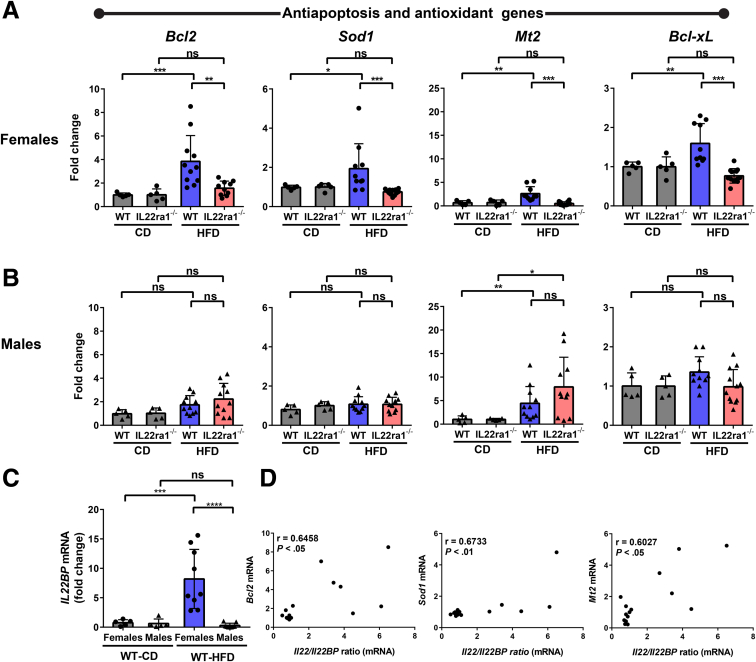
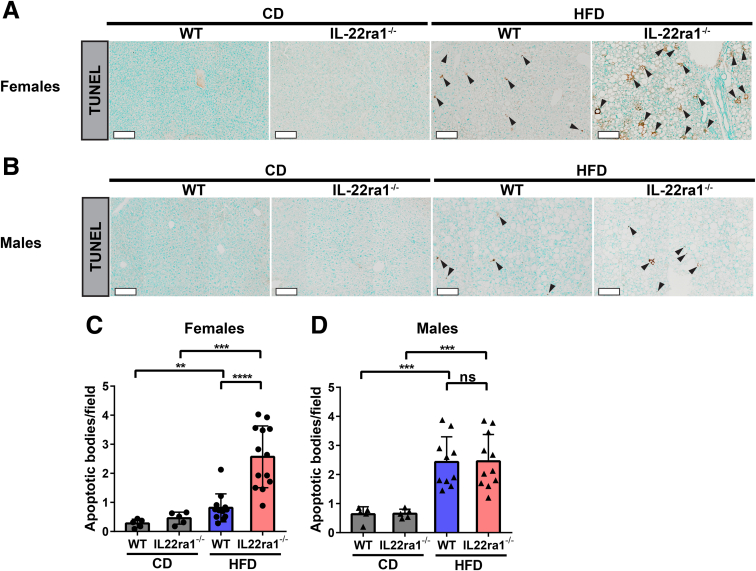
Results: Examination of publicly available data sets from 2 cohorts with NAFLD showed increased hepatic IL22 gene expression in females compared with males. Furthermore, our immunofluorescence analysis of liver sections from NAFLD subjects (n = 20) showed increased infiltration of IL22-producing cells in females. Similarly, IL22-producing cells were increased in wild-type female mice with NAFLD and the hepatic IL22/IL22 binding protein messenger RNA ratio correlated with expression of anti-apoptosis genes. The lack of endogenous IL22-receptor signaling (IL22RA knockout) led to exacerbated liver damage, inflammation, apoptosis, and liver fibrosis in female, but not male, mice with NAFLD.

Conclusions: Our data suggest a sex-dependent hepatoprotective antiapoptotic effect of IL22-receptor signaling during NAFLD-related liver injury in females.

Keywords: IL22 receptor signaling; IL22BP; NAFLD; liver fibrosis.


Figures

None
Graphical abstract
Figure 1
Figure 1
Increased levels of IL22+cells in livers of female vs male patients with NAFLD. (A and B) IL22 mRNA expression from publicly available microarray data sets (GSE151158 and GSE106737) of 2 different cohorts of NAFLD patients. Il22 mRNA levels were normalized and expressed as read counts and robust multiple-array average (RMA) values in GSE151158 and GSE106737, respectively. (C) Representative IF images of liver sections stained with anti-IL22 (red). Lower panels: Magnified insets. White arrowheads indicate IL22+ cells. Scale bars: 70 μm (upper panel) and 35 μm (lower panel); original magnification, 20×. (D) Representative liver tissue heatmaps of IL22+ cells (scale: blue = 0 [low] to red = 3 [high] cells/100-μm diameter). Scale bar: 3000 μm. (E) Total density quantification (counts per mm2) of hepatic IL22+ cells in our cohort (n = 20; females = 9 and males = 11) performed by FIJI software. (F) IL22+ cells did not co-express the T-cell marker (CD3). Representative IF images of CD3 (red) and IL22 (green) in liver biopsy (Formalin-Fixed Paraffin-Embedded liver section) from a female patient with NAFLD. Merge: No colocalization between IL22+ cells and CD3+. Scale bars: 50 μm; original magnification, 20×. White arrowheads indicate CD3+ T cells (magenta) or IL-22+ cells (green). (G) IF detection of CD66b (red) and IL22 (green) in liver biopsy specimen (Formalin-Fixed Paraffin-Embedded liver section) from a female patient with NAFLD. Yellow rectangles and/or yellow arrowheads in the merge section of panel F indicate IL22-producing neutrophils (CD66b+ IL22+). Scale bar: 35 μm; original magnification, 20×. Data are expressed as means ± SD for 9–24 patients per group: Mann–Whitney test. ∗P < .05 and ∗∗∗P < .001. Each dot on the bar graphs represent 1 male (triangle) or female (circle) patient. DAPI, 4′,6-diamidino-2-phenylindole.
Figure 2
Figure 2
Increased density of IL22+cells in livers of WT HFD-fed female mice compared with males. C57BL/6N male (triangle) and female (circle) mice were fed a HFD or chow diet (CD) for 30 weeks as described in the Materials and Methods section. (A) Representative IF images of liver sections stained with anti-IL22 (red). Lower panels: Magnified insets. White arrowheads indicate IL22+ cells. Scale bars: 70 μm (upper panel) and 35 μm (lower panel); original magnification, 20×. (B) Representative liver tissue heatmaps of IL22+ cells (scale: blue = 0 [low] to red = 3 [high] cells/100-μm diameter). Scale bar: 300 μm. (C) Total density quantification (counts per mm2) of hepatic IL22+ cells performed by FIJI software. (D and E) Hepatic Il22 and Il23 mRNA expression normalized to ribosomal 28s. Data are expressed as fold change. White arrowheads indicate CD3+ T cells (Red) or IL-22+ cells (green). (F) IL22+ cells did not co-express the T-cell marker (CD3). Representative IF images of CD3 (red) and IL22 (green) in Formalin-Fixed Paraffin-Embedded liver sections of HFD-fed WT female mice for 30 weeks. Merge: No colocalization between IL22+ cells and CD3+. Scale bars: 35 μm; original magnification, 20×. (G) IF detection of IL22+ (green) and Ly6G+ (red) cells in liver section (Formalin-Fixed Paraffin-Embedded section) of WT female mouse fed a HFD for 30 weeks. The rectangle in the middle panel shows the IL22-producing neutrophils (Ly6G+ IL22+) in the merge. Scale bar: 35 μm; original magnification, 20×. White arrowheads indicate CD3+ T cells (Red) or IL-22+ cells (green). Data are expressed as means ± SD (n = 5–12 mice per group, data were pooled from 3 independent experiments). Mann–Whitney test. ∗∗P < .01, ∗∗∗P < .001, and ∗∗∗∗P < .0001. DAPI, 4′,6-diamidino-2-phenylindole.
Figure 3
Figure 3
Intrahepatic T cells are major producers of IL22 in HFD-fed WT female mice. Representative flow cytometry plots showing intrahepatic IL22-producing cells: CD4+ T cells (IL22+CD3+CD4+), γδ–T cells (IL22+CD3+T cell receptorγδ+), and ILC3s (IL22+CD3-NKp46+) and their frequencies in WT (A) female and (B) male mice. The intrahepatic lymphocytes were extracted from livers of HFD or chow diet (CD)-fed WT female mice at 30 weeks, and then stimulated with/without PMA/ionomycin (PMA/Iono) for 5 hours. (C) The frequency quantification of IL22-producing CD4+ T cells, γδ–T cells, or ILC3s in panel A. (D) Representative flow cytometry plots showing frequencies of IL22 and/or IL17A CD4+ T cells, including Th17 (IL22+ IL17A+ CD4+ and/or IL17A+ IL22- CD4+) and Th22 (IL22+ IL17A- CD4+), in livers of HFD-fed IL22ra1-/- female mice and their WT littermates. (E) The frequency quantification of panel D. Data are expressed as means ± SD (n = 3–5 mice per group). Mann–Whitney test. ∗P < .05.
Figure 4
Figure 4
HFD-fed IL22ra1-/-female and/or male mice developed significant weight gain and insulin resistance compared with their WT littermates at 30 weeks. IL22ra1-/- female (circle) or male mice (triangle) and their WT littermates were fed a HFD or chow diet (CD) for 30 weeks. (A and B) Measurements of total body weight gain (in grams) over time. (C and D) Intraperitoneal glucose tolerance test at 30 weeks. (E and F) Measurements of serum insulin at 30 weeks for (A, C, and E) female and (B, D, and F) male mice. Data are expressed as means ± SD for 8–22 mice per group/sex (data were pooled from 3 independent experiments). (A and B) A 2-way repeated-measures analysis of variance followed by a post hoc test (Holm–Sidak multiple comparisons test) was used. (C and D) Regular 2-way analysis of variance followed by a post hoc test (Holm–Sidak multiple comparisons test) was used. ∗P < .05, ∗∗P < .01, and ∗∗∗P < .001. BW, body weight.
Figure 5
Figure 5
HFD-fed female and/or male mice developed adiposity and hepatic steatosis at 30 weeks. (A and B) Measurements of fat mass (in grams), (C and D) lean mass (in grams), (E and F) liver index (liver/body weight ratio), and (G and H) liver TG level (ug/mg liver weight) at 30 weeks for (A, C, E, and G) female and (B, D, F, and H) male mice. Data are expressed as means ± SD (n = 4–18 mice per group/sex, data were pooled from 3 independent experiments). Mann–Whitney test. ∗P < .05, ∗∗P < .01, ∗∗∗P < .001, and ∗∗∗∗P < .0001. CD, chow diet.
Figure 6
Figure 6
Lack of IL22-receptor signaling exacerbates liver injury and degree of inflammation-induced NASH in HFD-fed female mice. IL22ra1-/- female or male mice and their WT littermates fed on either HFD or chow diet (CD) for 30 weeks. (A) Representative microscopic view of liver sections from IL22ra1-/- and WT female mice stained with H&E and IF staining of macrophage marker F4/80+ (red cells are delineated by arrowheads) and the neutrophil marker, MPO+ (green cells delineated by arrows). Scale bars: 100 μm; original magnification, 20×. The right-most panels are magnified insets. Scale bars of insets 50 μm for the H&E image and 35 μm for both MPO+ and F4/80+ IF images. (B) Measurements of serum ALT level. (C) Blinded pathologic evaluation of NAS score (steatosis grade, lobular inflammation, and hepatocyte ballooning) by an expert pathologist. (D and E) Visiopharm quantification of (D) F4/80+ and (E) MPO+ areas in livers of female mice. Data are expressed as means ± SD for 5–22 mice per group (data were pooled from 3 independent experiments). Mann–Whitney test. ∗P < .05, ∗∗P < .01, ∗∗∗P < .001, and ∗∗∗∗P < .0001. DAPI, 4′,6-diamidino-2-phenylindole.
Figure 7
Figure 7
HFD-fed IL22ra1-/-male mice have a comparable profile of inflammation-induced NASH compared with their WT littermates. (A) Representative microscopic view of liver sections of IL22ra1-/- and WT male mice stained with H&E stain and IF staining of macrophage marker F4/80+ (red cells delineated by arrowheads) and the neutrophil marker MPO+ (green cells delineated by arrowheads). Scale bars: 100 μm; original magnification, 20×. (B) Measurements of serum ALT level. (C) Blinded pathologic evaluation of NAS score (steatosis grade, lobular inflammation, and hepatocyte ballooning) by an expert pathologist. Visiopharm quantification of (D) F4/80+ and (E) MPO+ areas in livers of male mice. Data are expressed as means ± SD for 5–20 mice per group (data were pooled from 3 independent experiments). Mann–Whitney test. ∗P < .05, ∗∗∗P < .001, and ∗∗∗∗P < .0001. CD, chow diet; DAPI, 4′,6-diamidino-2-phenylindole.
Figure 8
Figure 8
HFD-fed IL22ra1-/-female mice, but not males, develop an increase in the absolute number of adaptive immune cells in their livers and spleen compared with their WT littermates at 30 weeks. IHLs and splenocytes were extracted from fatty livers and spleen of IL22ra1-/- and WT female or male mice, respectively, and analyzed by flow cytometry. (A) Representative FACS plot showing an outline for the gating strategy of B cells (CD45+ CD19+ CD3-), T cells (CD45+ CD3+ CD19-), NK cells (CD45+ CD19- CD3- NK1.1+ NKp46-), CD4+ T cells (CD3+ CD19- CD4+), CD8+ T cells (CD3+ CD19- CD8+), T cell receptorγδ T cells (CD3+ CD19- T cell receptorγδ+), and NK–T cells (CD3+ CD19- NK1.1+). The indicated numbers of cell subsets of (B and C) IHLs and (D and E) splenocytes represent cell number/g of liver and splenocyte number/106 cells for (B and D) female and (C and E) male mice, respectively. Data are expressed as means ± SD for 10–13 mice per group/sex (data were pooled from 3 independent experiments). Mann–Whitney test. ∗P < .05 and ∗∗P < .01. SSC, side scatter characteristics.
Figure 9
Figure 9
HFD-fed IL-22ra1-/-female mice, but not males, developed an increase in the absolute number of innate immune cells in their livers and spleen compared with their WT littermates at 30 weeks. IHLs and splenocytes were extracted from fatty livers and spleen of IL22ra1-/- and WT female or male mice, respectively, and analyzed by flow cytometry. (A) Representative zebra plots showing an outline for the gating strategy of granulocytes (CD45+ CD11b+), neutrophils (CD11b+ Ly6Cint Ly6G+), monocytes (CD11b+ Ly6Chi Ly6G-), macrophages (CD11b+ Ly6C- Ly6G- F4/80+), and dendritic cells (DCs) (CD11b+ Ly6C- Ly6G- F4/80- CD11c+). The indicated numbers of cell subsets of (B and C) IHLs and (D and E) splenocytes represent the cell number/gram of liver and splenocyte number/106 cells for (B and D) female and (C and E) male mice, respectively. Data are expressed as means ± SD for 10–13 mice per group/sex (data were pooled from 3 independent experiments). Mann–Whitney test. ∗P < .05, ∗∗P < .01, and ∗∗∗P < .001. SSC, side scatter characteristics.
Figure 10
Figure 10
Absence of IL22-receptor signaling results in significant dysregulation of hepatic inflammatory genes in HFD-fed female mice, but not males. Bar graphs of (A and B) proinflammatory chemokine and/or (C and D) cytokine gene expression (normalized to r28s) as indicated and represented as fold change for (A and C) female and (B and D) male mice. (E and F) Heatmaps representing a summary of gene(s) expression in panels AD for (E) females and (F) males. (E and F) Asterisk(s) indicate statistical significance between the HFD-fed IL22ra1-/- group and their WT littermates. Data are expressed as means ± SD for 5–13 mice per group/sex (data were pooled from 3 independent experiments). Mann–Whitney test. ∗P < .05, ∗∗P < .01, ∗∗∗P < .001, and ∗∗∗∗P < .0001. CD, chow diet.
Figure 11
Figure 11
Loss of IL22-receptor signaling induces severe NASH-related fibrosis in HFD-fed female mice. IL22ra1-/- female mice and their WT littermates were fed either a HFD or chow diet (CD) for 30 weeks. (A) Representative microscopic and IF images of liver sections of IL22ra1-/- female mice and their WT littermates stained with PSR (collagen shown in red), α-smooth muscle actin (α-SMA; shown in red), or desmin (green). Scale bars: 100 μm; original magnification, 20×. (B) FIJI quantification of PSR+ve area in livers of female mice. (C) Blinded pathologic evaluation of liver fibrosis grade of female mice by an expert pathologist. Visiopharm quantification of (D) α-SMA and (E) desmin+ve areas in livers of IL22ra1-/- and WT female mice after HFD or CD treatment for 30 weeks. (F and G) Bar graphs and heatmap of qPCR data of profibrogenic gene expression (normalized to r28s) as indicated and represented as fold change. (G) Asterisk(s) indicate statistical significance between the HFD-fed IL22ra1-/- group and the HFD-fed WT group. Data are expressed as means ± SD for 5–22 mice per group (data were pooled from 3 independent experiments). Mann–Whitney test. ∗∗P < .01, and ∗∗∗P < .001, ∗∗∗∗P < .0001. DAPI, 4′,6-diamidino-2-phenylindole.
Figure 12
Figure 12
HFD-fed IL22ra1-/-male mice have comparable profiles of NASH-related fibrosis compared with their WT littermates. (A) Representative microscopic and IF images of liver sections of IL22ra1-/- male mice and their WT littermates stained with PSR (collagen in red), α-smooth muscle actin (α-SMA; red), or desmin (green). Scale bars: 100 μm; original magnification, 20×. (B) FIJI quantification of PSR+ve area in livers of male mice. (C) Blinded pathologic evaluation of liver fibrosis grade of male mice by an expert pathologist. Visiopharm quantification of (D) α-SMA and (E) desmin+ve areas in livers of IL22ra1-/- and WT female mice after HFD or chow diet (CD) treatment for 30 weeks. (F and G) Bar graphs and heatmap of qPCR data of profibrogenic gene expression (normalized to r28s) as indicated and represented as fold change. (G) Asterisk(s) indicate statistical significance between HFD-fed IL22ra1-/- group and HFD-fed WT group. Data are expressed as means ± SD for 5–20 mice per group (data were pooled from 3 independent experiments). Mann–Whitney test. ∗∗P < .01, ∗∗∗P < .001, and DAPI, 4′,6-diamidino-2-phenylindole.
Figure 13
Figure 13
A positive correlation between the hepatic IL22/IL22BP ratio and IL22-induced anti-apoptotic genes in WT female mice. Female (circle) and male (triangle) mice were fed a HFD or chow diet (CD) for 30 weeks. RNA was extracted from fatty livers of WT female and male mice, converted to cDNA, followed by qPCR. The expression of anti-apoptotic and antioxidant genes as indicated in livers of IL22ra1-/- (A) female or (B) male mice and their WT littermates at 30 weeks. Data were normalized to r28s and represented as fold change. (C) Il22BP mRNA expressions were normalized to r28s and represented as fold change. (D) Spearman correlation graphs between the IL22/IL22BP ratio (mRNA) in livers of HFD-fed WT female mice and IL22 downstream target genes: Bcl2, Sod1, and Mt2 mRNA. Data are expressed as means ± SD for 5–12 mice per group/sex (data were pooled from 3 independent experiments). Mann–Whitney test. ∗P < .05, ∗∗P < .01, ∗∗∗P < .01, and ∗∗∗∗P < .0001.
Figure 14
Figure 14
Endogenous IL22-receptor signaling protects against hepatic apoptosis in HFD-fed WT female mice, but not male mice. Representative microscopic view of liver sections stained with TUNEL of IL22ra1-/- and WT (A) female or (B) male mice after HFD treatment for 30 weeks. Scale bars: 100 μm. Black arrowheads indicate apoptosis. FIJI quantification of apoptotic bodies (count/field) for IL22ra1-/- and WT (C) female or (D) male mice. Data are expressed as means ± SD for 5–13 mice per group/sex (data were pooled from 3 independent experiments). Mann–Whitney test. ∗∗P < .01, ∗∗∗P < .001, and ∗∗∗∗P < .0001. CD, chow diet.

Similar articles

Cited by

References

    1. Younossi Z., Anstee Q.M., Marietti M., Hardy T., Henry L., Eslam M., George J., Bugianesi E. Global burden of NAFLD and NASH: trends, predictions, risk factors and prevention. Nat Rev Gastroenterol Hepatol. 2018;15:11–20. - PubMed
    1. Estes C., Razavi H., Loomba R., Younossi Z., Sanyal A.J. Modeling the epidemic of nonalcoholic fatty liver disease demonstrates an exponential increase in burden of disease. Hepatology. 2018;67:123–133. - PMC - PubMed
    1. Ge X., Zheng L., Wang M., Du Y., Jiang J. Prevalence trends in non-alcoholic fatty liver disease at the global, regional and national levels, 1990-2017: a population-based observational study. BMJ Open. 2020;10 - PMC - PubMed
    1. Lonardo A., Nascimbeni F., Ballestri S., Fairweather D., Win S., Than T.A., Abdelmalek M.F., Suzuki A. Sex differences in nonalcoholic fatty liver disease: state of the art and identification of research gaps. Hepatology. 2019;70:1457–1469. - PMC - PubMed
    1. Zhu L., Martinez M.N., Emfinger C.H., Palmisano B.T., Stafford J.M. Estrogen signaling prevents diet-induced hepatic insulin resistance in male mice with obesity. Am J Physiol Endocrinol Metab. 2014;306:E1188–E1197. - PMC - PubMed

Publication types

Substances