Review
. 2022 Sep 14;122(17):13883-13914.
doi: 10.1021/acs.chemrev.1c00879. Epub 2022 Aug 15.

Electron Diffraction of 3D Molecular Crystals

Affiliations
Review

Electron Diffraction of 3D Molecular Crystals

Ambarneil Saha et al. Chem Rev. .

Abstract

Electron crystallography has a storied history which rivals that of its more established X-ray-enabled counterpart. Recent advances in data collection and analysis have sparked a renaissance in the field, opening a new chapter for this venerable technique. Burgeoning interest in electron crystallography has spawned innovative methods described by various interchangeable labels (3D ED, MicroED, cRED, etc.). This Review covers concepts and findings relevant to the practicing crystallographer, with an emphasis on experiments aimed at using electron diffraction to elucidate the atomic structure of three-dimensional molecular crystals.


Conflict of interest statement

The authors declare the following competing financial interest(s): J.A.R. is a founder and equity stake holder of MEDSTRUC INC.

Figures

Figure 1
Figure 1
(A) Neutral electron scattering factors for seven representative elements. All neutral scattering factors were parametrized into five Gaussians and plotted within the range [0 < formula image 
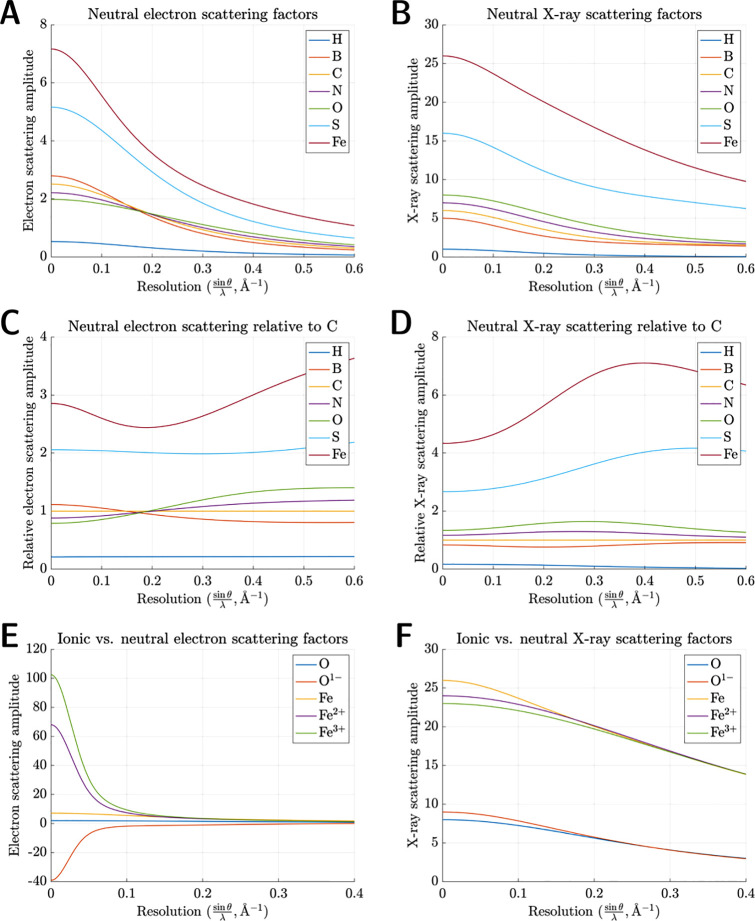
< 0.6 Å–1], equivalent to [∞ < d < 0.83 Å]. (To convert between formula image and d, recall Bragg’s law: formula image.) (B) Neutral X-ray scattering factors. (C) Neutral electron scattering relative to carbon. Relative scattering amplitudes were calculated by dividing each scattering factor by f(s) for neutral carbon. (D) Neutral X-ray scattering relative to carbon. (E) Ionic vs neutral electron scattering factors for O and Fe. To avoid physically unrealistic values in the limit as formula image tends to zero, O1– was truncated at 0.02 Å–1 before parametrization into five Gaussians, while Fe2+ and Fe3+ were truncated at 0.05 Å–1. (F) Ionic vs neutral X-ray scattering factors.
Figure 2
Figure 2
Relativistic (solid blue line) and nonrelativistic (dashed blue line) electron wavelengths plotted as a function of incident energy (E) at a range of accelerating voltages accessible to TEM. Percent error between the two calculations is plotted in orange; characteristic values include ∼4.7% at 100 keV, ∼9.3% at 200 keV, ∼13.7% at 300 keV, and ∼17.9% at 400 keV.
Figure 3
Figure 3
X-ray vs electron Ewald spheres and experimental diffraction patterns. Superimposed X-ray (rendered in blood orange, E = 8.042 keV, λ = 1.541 Å, radius = 0.6485 Å–1, volume = 1.142 Å–3) and electron (rendered in blue, E = 300 keV, λ = 0.0197 Å, radius = 50.76 Å–1, volume = 5.478 × 10⁵ Å–3) Ewald spheres are drawn intersecting a cubic reciprocal lattice. The X-ray Ewald sphere is comfortably dwarfed by its much more voluminous electron counterpart. (A) 2D orthographic projection viewed normal to an arbitrary reciprocal lattice vector. (B) Alternate view revealing the three-dimensionality of the reciprocal lattice. (C) Electron diffraction pattern acquired using an accelerating voltage of 300 kV. Inset shows a close-up view and somewhat noisy 3D peak profile of a 0.95 Å resolution Bragg reflection. (D) X-ray diffraction pattern acquired on an in-house diffractometer equipped with a Cu Kα anode (8.042 keV). Inset shows a close-up view and strong 3D peak profile of a 1.56 Å Bragg reflection.
Figure 4
Figure 4
(A) Elastic cross-sections for neutral carbon at 80 keV (green) and 300 keV (yellow); cross-sectional areas expressed as concentric circles. (B) Elastic cross-section for neutral carbon decreasing as a monotonic function of incident energy, plotted at a range of accelerating voltages relevant to TEM.
Figure 5
Figure 5
(A–C) Optical microscopy of several crystalline compounds suitable for 3D electron crystallography. (A,C) Formally recrystallized material (an organic small molecule suspended in glycerol in A, an oligopeptide suspended in a hanging drop in C) requiring additional pulverization before ED due to their macroscopic size. (B) An inherently microcrystalline powder amenable to a direct “shake-n-bake” approach with a standard 3.05 mm lacey carbon EM grid, encircled in blue. (D–F) Transmission electron microscopy reveals micro- and nanocrystalline specimens with a range of morphologies, all suitable for ED analysis.
Figure 6
Figure 6
Different modalities of 3D ED data collection. In all schematics, the hourglass-shaped missing wedge intrinsic to the TEM goniometer is depicted in red. (A) Zone-axis orientations (purple planes) accessed via stepwise angular tilts. This approach maximizes the density of Bragg reflections per diffraction pattern, streamlining deduction of unit cell parameters. It also leaves several corridors of reciprocal space between zone axes (white) unsampled, hampering completeness. (B) Continuous-rotation electron diffraction. Blue wedges correspond to regions of reciprocal space sampled during the exposure time, whereas red planes represent gaps left unsampled while the TEM stage continues to rotate during the detector readout time; these become negligibly small with modern active-pixel sensors. (C) Zone-axis precession electron diffraction (PED). Thanks to the gyrating motion of the incident beam (blue cones), this method intercepts several off-zone reflections neglected in (A). (D) Precession-assisted electron diffraction tomography (PEDT). This technique combines beam precession with rotation about the goniometer axis, further enhancing coverage of reciprocal space. (E) Automated diffraction tomography (ADT). Stepwise tilts about the goniometer axis ensure that most diffraction patterns (green planes) represent off-zone orientations. (F) Rotation electron diffraction (RED). Exploitation of electron beam tilt enables finer sampling of reciprocal space (closely spaced yellow planes) than relying on the mechanical precision of the TEM goniometer alone (green planes).
Figure 7
Figure 7
Circles represent the mean resolution and refinement R-factor (R1 for small molecules, Rwork for peptides and proteins) for each category of substrate, whereas error bars signify one standard deviation in each direction. Data were taken from Tables 2, 3, and 4.
Figure 8
Figure 8
Ab initio atomic-resolution 3D ED structures of three novel oligopeptide fragments derived from pathologically relevant proteins. Carbon atoms and the peptide backbone are rendered in blue, oxygen atoms in orange, and nitrogen atoms in purple. (A) 1.0 Å resolution structure of 312NFGEFS317 (PDB 5WKB), a hexapeptide segment from the low-complexity domain of the A315E familial mutant of TAR DNA-binding protein 43. (B) 0.75 Å resolution structure of 168QYNNQNNFV176 (PDB 6AXZ), a nonapeptide segment from the β2−α2 loop of the bank vole prion protein. (C) 1.1 Å resolution structure of 20FAEiDVGSNKGAIIGL34 (PDB 6OIZ), a 15-residue segment from wild-type amyloid-β.
Figure 9
Figure 9
ORTEP diagrams of five ab initio small-molecule 3D ED structures, with H atoms omitted. Carbon atoms are rendered in blue, nitrogen atoms in lilac, oxygen atoms in red, chlorine atoms in sea green, and copper atoms in orange. All thermal ellipsoids are drawn at 50% probability, except for compound D, which is depicted at 15% for clarity. (A) 0.77 Å resolution structure of synthetic (+)-limaspermidine (CSD: CAHKUU01), a monoterpene indole alkaloid featuring a cis-fused azadecalin core. Suitable microcrystals were obtained directly from flash column chromatography, without any formal recrystallization. (This compound did not undergo B-factor refinement, so its thermal ellipsoids do not carry any physical meaning.) (B) 0.9 Å resolution structure of the analgesic orthocetamol (CSD: WOFXEX), refined isotropically. (C) 0.8 Å resolution structure of the viridian pigment copper(II) perchlorophthalocyanine (CSD: UZEMIY), refined anisotropically. (D) 1.05 Å resolution structure of the genotoxic natural product (−)-lomaiviticin C (CSD: ERUHEH), featuring two independent molecules in the asymmetric unit. (E) 0.57 Å resolution structure of the organic semiconductor dicyanonaphthalene diimide (CSD: TUKVON), refined anisotropically. This entry represents one of the highest-resolution small-molecule structures currently solved by 3D ED.
Figure 10
Figure 10
Elastic vs inelastic cross-sections for neutral carbon at 300 keV, expressed as concentric circles.

Similar articles

Cited by

References

    1. Davisson C.; Germer L. H. Diffraction of Electrons by a Crystal of Nickel. Phys. Rev. 1927, 30, 705–740. 10.1103/PhysRev.30.705. - DOI
    1. Davisson C.; Germer L. H. The Scattering of Electrons by a Single Crystal of Nickel. Nature 1927, 119, 558–560. 10.1038/119558a0. - DOI
    1. Gehrenbeck R. K. Electron Diffraction: Fifty Years Ago. Physics Today 1978, 31, 34–41. 10.1063/1.3001830. - DOI
    1. De Broglie L. XXXV. A Tentative Theory of Light Quanta. Philosophical Magazine Letters 2006, 86, 411–423. 10.1080/09500830600914721. - DOI
    1. Thomson G. P.; Reid A. Diffraction of Cathode Rays by a Thin Film. Nature 1927, 119, 890–890. 10.1038/119890a0. - DOI

Publication types