. 2022 Aug 15;7(1):288.
doi: 10.1038/s41392-022-01090-z.

ALOX15-launched PUFA-phospholipids peroxidation increases the susceptibility of ferroptosis in ischemia-induced myocardial damage

Affiliations

ALOX15-launched PUFA-phospholipids peroxidation increases the susceptibility of ferroptosis in ischemia-induced myocardial damage

Xiao-Hui Ma et al. Signal Transduct Target Ther. .

Abstract

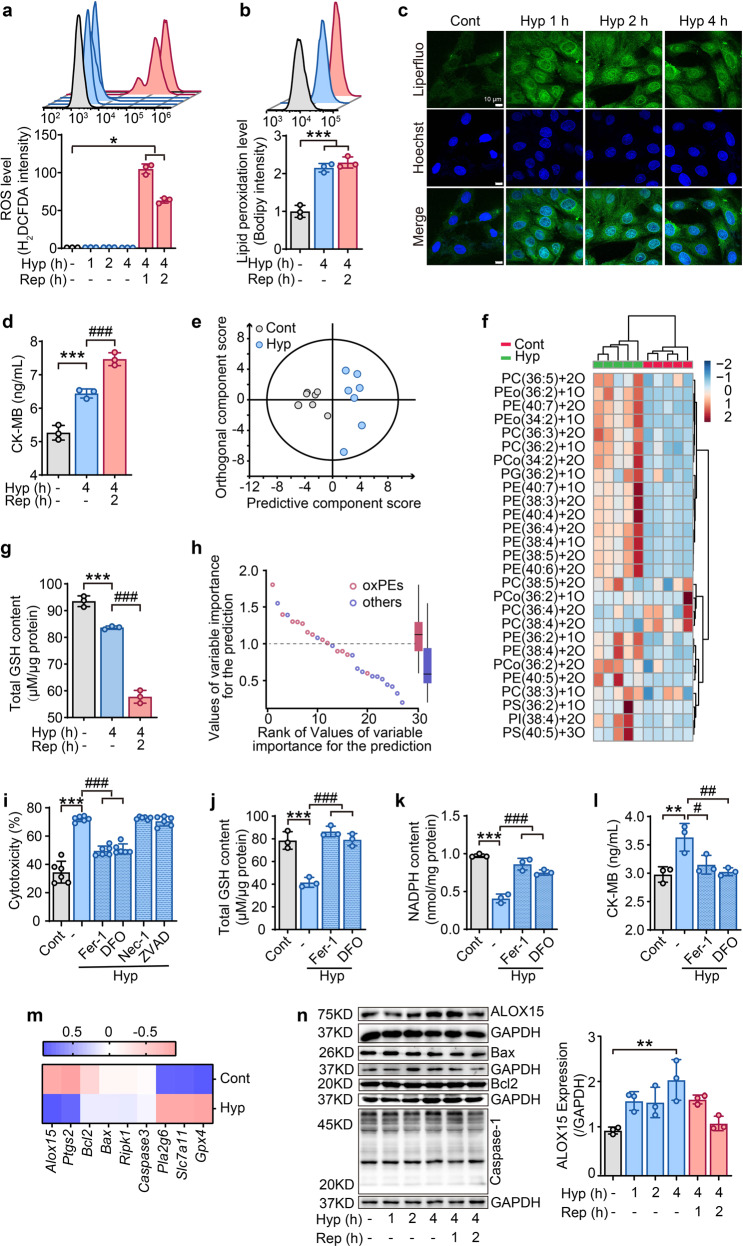
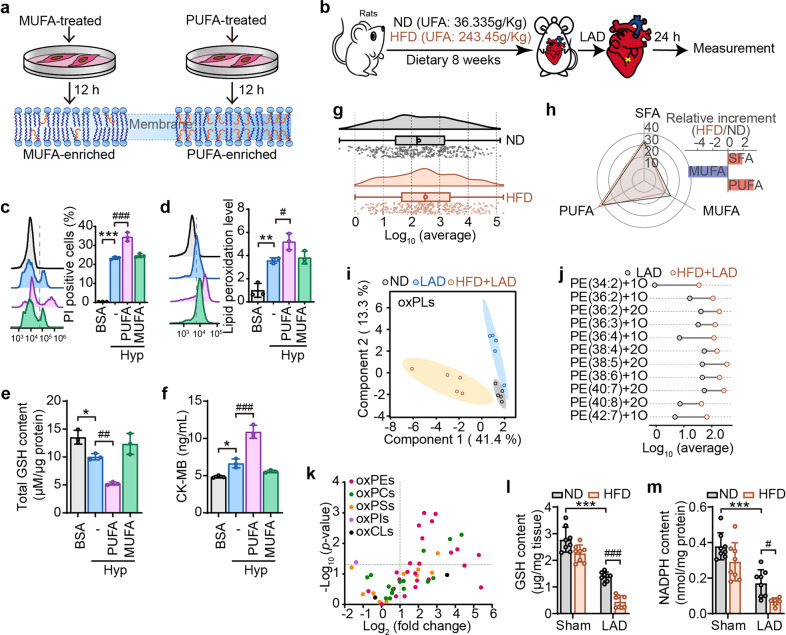
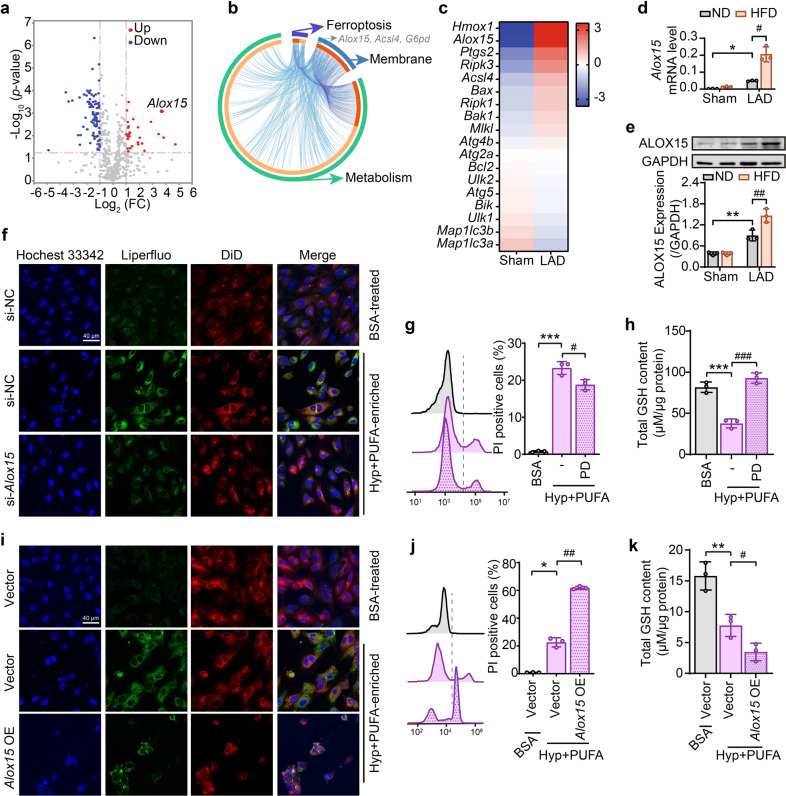
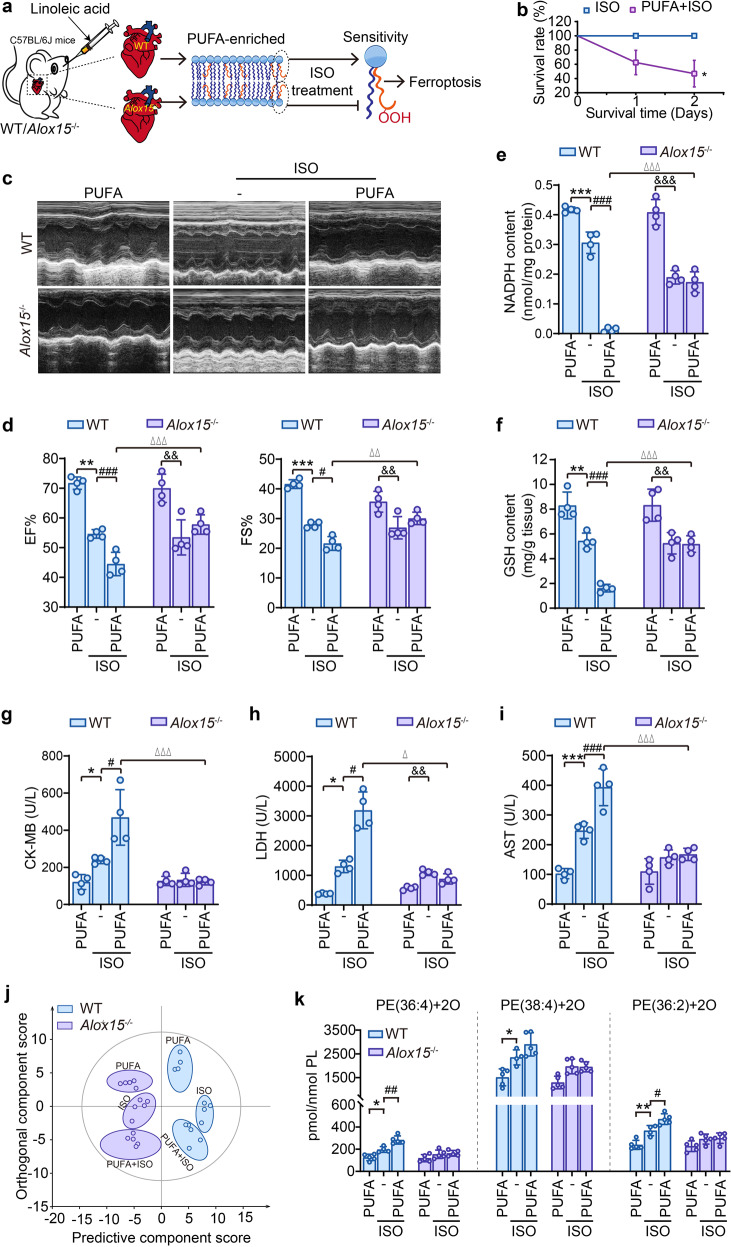
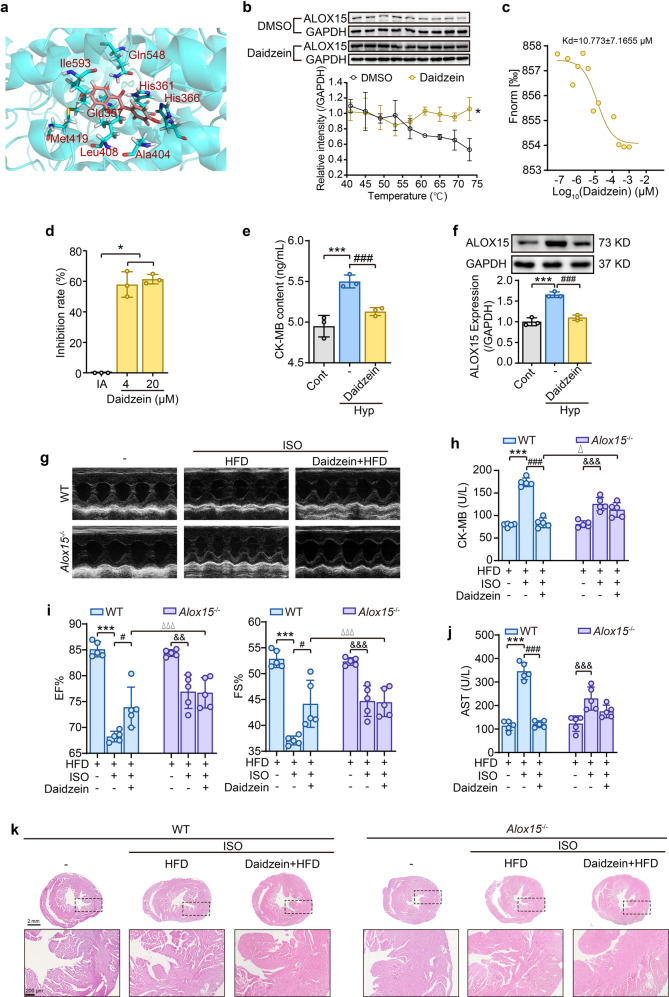
Myocardial ischemia/reperfusion (I/R) injury is a classic type of cardiovascular disease characterized by injury to cardiomyocytes leading to various forms of cell death. It is believed that irreversible myocardial damage resulted from I/R occurs due to oxidative stress evoked during the reperfusion phase. Here we demonstrate that ischemia triggers a specific redox reaction of polyunsaturated fatty acids (PUFA)-phospholipids in myocardial cells, which acts as a priming signaling that initiates the outbreak of robust oxidative damage in the reperfusion phase. Using animal and in vitro models, the crucial lipid species in I/R injury were identified to be oxidized PUFAs enriched phosphatidylethanolamines. Using multi-omics, arachidonic acid 15-lipoxygenase-1 (ALOX15) was identified as the primary mediator of ischemia-provoked phospholipid peroxidation, which was further confirmed using chemogenetic approaches. Collectively, our results reveal that ALOX15 induction in the ischemia phase acts as a "burning point" to ignite phospholipid oxidization into ferroptotic signals. This finding characterizes a novel molecular mechanism for myocardial ischemia injury and offers a potential therapeutic target for early intervention of I/R injury.


Conflict of interest statement

The authors declare no competing interests.

Figures

Fig. 1
Fig. 1
Phospholipid peroxidation is triggered by hypoxia in cardiomyocytes. a After hypoxia/reoxygenation, ROS levels in H9C2 cells were measured by H2DCFDA staining using flow cytometry at different time points. b Lipid ROS detected by flow cytometry after staining H9C2 cells with Bodipy. c Lipid ROS detected by confocal microscopy performed at different time periods of hypoxia in H9C2 cells stained with Liperfluo. d CK-MB content in H9C2 cells after hypoxia/reoxygenation. e Multivariate statistical analysis of oxidative phospholipids using OPLS-DA analysis between control and hypoxia-treated cells. Each point represents a sample (n = 7). f Heat map indicating changes to different oxPLs in hypoxia-exposed H9C2 cells (n = 5). g GSH content in H9C2 cells treated with hypoxia/reoxygenation. h Dot plots demonstrating variable importance for prediction scores of various oxPLs species in distinguishing control versus ischemia-treated H9C2 cells. PE-ox species (variable importance for prediction score>1) were the predominant oxidized species that separated the control from hypoxia treatment (n = 7). i Effect of different cell death inhibitors on the cytotoxicity of H9C2 cells exposed to 4-h hypoxia. All inhibitors were pretreated for 2 h before hypoxia treatment. Ferroptosis inhibitor: ferrostatin-1(Fer-1, 1 μM), deferoxamine (DFO, 100 μM); necroptosis inhibitor: necrostatin-1 (Nec-1, 1 μM); apoptosis inhibitor: Z-VAD-FMK (ZVAD, 1 μM). Effects of ferroptosis inhibitors on the contents of total GSH (j), NADPH (k), and CK-MB (l) after 4-h hypoxia. Ferrostatin-1 (Fer-1, 1 μM) and deferoxamine (DFO, 100 μM) were pretreated for 2 h before hypoxia treatment. m A summary heat map of quantitative RT-PCR analysis of genes related with ferroptosis (Alox15, Ptgs2, Pla2g6, Slc7a11, and Gpx4), apoptosis (Bcl2 and Bax), and necrosis (Ripk1) in H9C2 cells treated with 4-h hypoxia (n = 3). n Protein expressions for ALOX15, Bax, Bcl2 and Caspase-1 in hypoxia/reoxygenation treated H9C2 cells (n = 3). The right panel indicates the statistical analysis forALOX15 expression. All the quantitative data are presented as mean ± SD and statistical significance was assessed by one-way ANOVA followed by Tukey post-hoc test. *p < 0.05, **p < 0.01, ***p < 0.001 vs control (cont) group; #p < 0.05, ##p < 0.01, ###p < 0.001 vs hypoxia (Hyp) group
Fig. 2
Fig. 2
Oxidized PUFA-PEs serve as crucial death signals for ischemia-induced myocardial damage. a Experimental schema for establishing MUFA or PUFA-enriched cells. H9C2 cells were treated with oleic acid (OA, 80 μM) or linoleic acid (LA, 80 μM) for 12 h. MUFA, monounsaturated fatty acids; UFA, unsaturated fatty acids. b Schematic depicting the establishment of ischemia animal model in rats fed with normal diet (ND, containing 36.335 g/kg of UFA) or high-fat diet (HFD, containing 243.45 g/kg of UFA). After 8 weeks-feeding, rats were subjected to ischemia by left anterior descending (LAD) coronary artery ligation. After inducing hypoxia in cells treated with BSA-prepared PUFA or MUFA, cell death (c) and lipid peroxidation (d) were, respectively, evaluated with PI and Liperfluo staining followed by flow cytometry. BSA treatment was set as the control group. Total content of GSH (e) or CK-MB (f) in PUFA/MUFA-enriched cells at 4-h hypoxia treatment. g The raincloud plot shows the content of Log10 (average) changes in total PUFAs in the heart of ND-fed and HFD-fed rats (n = 5). h Radar chart indicates the changes of SFA, MUFA, and PUFA in the heart of ND-fed and HFD-fed rats. The relative increment of these fatty acids was represented by a bar chart (n = 5). i OxPLs were extracted and interpreted by principal component analysis (PCA), and the 2D score plots display repertoires of ND-sham, ND-LAD, and HFD-LAD rats. Each point represents a sample, and ellipses represent 95% confidence regions (n = 5). j Dumbbell chart shows different types of oxPEs in the content of Log10 (average) changes among LAD-ligated rats fed with ND or HFD (n = 5). k Volcano plots showing changes in oxPLs in heart tissue of LAD ligated rats with ND-and HFD-fed (n = 5). The significance of -log10 (P value) by t test. Content of GSH (l) and NADPH (m) were detected in ND or HFD-fed rats after 24-h LAD ligation. All the quantitative data are presented as mean ± SD and statistical significance was assessed by one-way ANOVA followed by Tukey post-hoc test. For the in vitro experiments, *p < 0.05, **p < 0.01, ***p < 0.001 vs BSA control group; #p < 0.05, ##p < 0.01, ###p < 0.001 vs hypoxia (Hyp) group. For the in vivo experiments, ***p < 0.001 vs “ND + sham” group, #p < 0.05, ###p < 0.001 vs “ND + LAD” group
Fig. 3
Fig. 3
ALOX15 expression is highly correlated with ischemia/hypoxia-induced cardiomyocyte damage. ac The differential genes analysis in the heart tissues of sham and ischemia hearts. a The volcano plots express the differentially expressed genes between the two groups in metabolic pathways by KEGG analysis. The genes upregulated (red point) or downregulated (blue point) at least the absolute value of log2 (fold change) >1 and P < 0.05 was set as the thresholds between any two treatments (n = 4). b The Circos plot indicates overlapped differential genes across ferroptosis, membrane and metabolic pathways. Outside of the Circos, each arc represents an identity pathway gene list, and inside, a spot on the arc represents a gene. The greater the number of purple links and the longer the dark orange arcs imply a more significant overlap among the input gene lists. Alox15, Acls4 and G6pd were identified as the overlapping genes of three pathways. c Heat map of differential expressions of classical genes related to ferroptosis (Hmox-1, Alox15, Ptgs2, Acsl4), apoptosis (Bax, Bcl2, Bik, Bak1), necrosis (Ripk3, Mlkl, Ripk1), and autophagy (Atg4b, Atg2a, Ulk2, Atg5, Ulk1, Map1lc3b, Map1lc3a). Color scales show the differences in expression of each gene in the indicated sample relative to its expression in log2 (fold change). The mRNA (d) and protein (e) levels of ALOX15 in heart tissues of ND-or HFD-fed rats after 24-h LAD ligation and the semi-quantification is shown in the lower panel. f After si-Alox15, lipid peroxidation was detected by confocal microscopy after Liperfluo staining in PUFA-enriched H9C2 cells under hypoxia. Effect of ALOX15 inhibitor PD 146176 (PD, 10 μM) on cell death (g) and GSH content (h) was assessed by PI staining in PUFA-enriched H9C2 cells under hypoxia. After Alox15 overexpression (Alox15 OE) in PUFA-enriched H9C2 cells under hypoxia, lipid peroxidation (i), cell death (j) and GSH content (k) were, respectively, determined by confocal microscopy, flow cytometry and HPLC-MS. All the quantitative data are presented as mean ± SD and statistical significance was assessed by one-way ANOVA followed by Tukey post-hoc test. For the in vitro experiments, *p < 0.05, **p < 0.01, ***p < 0.001 vs control (Cont) group; #p < 0.05, ##p < 0.01, ###p < 0.001 vs hypoxia (Hyp) group. For the in vivo experiments, *p < 0.05, **p < 0.01 vs “ND + sham” group, #p < 0.05, ##p < 0.01 vs “ND + LAD” group
Fig. 4
Fig. 4
Alox15–/– mice lose PUFA-induced susceptibility towards ischemia-induced myocardial damage. a Experimental schema for establishing ischemia animal model in PUFA-enriched in WT or Alox15–/– mice. All animals were intragastrically administered with LA (2 g/kg, 14 d) and then intraperitoneally injected isoproterenol (ISO), 40 mg/kg. The heart tissues were obtained one day after ISO injection. b Influence of PUFA on the survival rate of WT mice with ISO treatment (i.p., 40 mg/kg). *p < 0.05 by Log-rank (Mantel-Cox) test (n = 8). c and d Effect of PUFA on heart function of WT or Alox15–/– mice with ISO treatment. c Representative echocardiography images. d The left ventricular ejection fraction (EF%) and left ventricular shortening fraction (FS%). The contents of NADPH (e) and GSH (f) were detected in heart tissues of ISO-injected WT or Alox15–/– mice. The levels of myocardial enzymes, including CK-MB (g), LDH (h) and AST (i) were analyzed in heart tissues of ISO-injected WT or Alox15–/– mice. j OPLS-DA score plots analyze the separation of oxidized oxPLs between WT and Alox15–/– mice. Each point represents a sample (n = 4–5). k Quantitative data for di-oxygenated PE species, including PE (36:4), PE (38:4) and PE (36:2) in heart tissues of ISO-injected WT or Alox15–/– mice. All the quantitative data are presented as mean ± SD and statistical significance was assessed by one-way ANOVA followed by Tukey post-hoc test (di) or t test (k). *p < 0.05, **p < 0.01, ***p < 0.001 vs the “WT + PUFA” group; #p < 0.05, ##p < 0.01, ###p < 0.001 vs “WT + ISO” group. &p < 0.05, &&p < 0.01, &&&p < 0.001 vs “Alox15–/–+PUFA” group; p < 0.05, △△p < 0.01, △△△p < 0.001 vs “WT + PUFA + ISO” group
Fig. 5
Fig. 5
Natural ALOX15 inhibitor daidzein prohibits ischemia-induced myocardial damage. a Representative docking images of ALOX15 and daidzein. b and c The binding affinity of daidzein and ALOX15 was determined by CETSA and MST experiments. CETSA was performed in the lysates of ALOX15-overexpressing HEK293T cells (b). Data is expressed as mean ± SD, and statistical significance was analyzed by two-way ANOVA followed by the Tukey post-hoc test. *p < 0.05 vs the DMSO group. Data points in MST analysis indicate the difference in normalized fluorescence (‰) generated by daidzein binding to ALOX15, and curves show the calculated fits (c). d The inhibition rate of daidzein on ALOX15 enzyme activity. Data is expressed as mean ± SD, and statistical significance was analyzed by one-way ANOVA followed by the Tukey post-hoc test. *p < 0.05 vs Initial Activity (AI) group. Effect of daidzein on CK-MB content (e) and protein expression (f) in hypoxia H9C2 cells. Daidzein (50 μM) was pretreated for 12 h. Data is expressed as mean ± SD, and statistical significance was analyzed by one-way ANOVA followed by the Tukey post-hoc test. ***p < 0.001 vs control (Cont) group; ###p < 0.001 vs hypoxia (Hyp) group. g–k Effect of daidzein on heart functions and histological changes of HFD-fed WT or Alox15–/– mice subjected with ISO. g Echocardiography images. h Serum CK-MB content. i The left ventricular ejection fraction (EF%) and left ventricular shortening fraction (FS%). j serum AST level. k H&E pathological examination of heart sections (n = 3). Data is expressed as mean ± SD, and statistical significance was analyzed by one-way ANOVA followed by the Tukey post-hoc test. ***p < 0.001 vs “WT + HFD” group, #p < 0.05, ###p < 0.001 vs “WT + ISO” group; &&p < 0.01, &&&p < 0.001 vs “Alox15–/–+HFD” group; p < 0.05, △△△p < 0.001 vs “WT + HFD + ISO” group

References

    1. Virani SS, et al. Heart disease and stroke statistics-2020 update: a report From the American Heart Association. Circulation. 2020;141:e139–e596. - PubMed
    1. Del Re DP, Amgalan D, Linkermann A, Liu Q, Kitsis RN. Fundamental mechanisms of regulated cell death and implications for heart disease. Physiol. Rev. 2019;99:1765–1817. doi: 10.1152/physrev.00022.2018. - DOI - PMC - PubMed
    1. Braunwald E, Kloner RA. Myocardial reperfusion: a double-edged sword? J. Clin. Invest. 1985;76:1713–1719. doi: 10.1172/JCI112160. - DOI - PMC - PubMed
    1. Wang J, Zhou H. Mitochondrial quality control mechanisms as molecular targets in cardiac ischemia–reperfusion injury. Acta Pharm. Sin. B. 2020;10:1866–1879. doi: 10.1016/j.apsb.2020.03.004. - DOI - PMC - PubMed
    1. Chazelas P, et al. Oxidative stress evaluation in ischemia reperfusion models: characteristics, limits and perspectives. Int J. Mol. Sci. 2021;22:2366. doi: 10.3390/ijms22052366. - DOI - PMC - PubMed

Publication types

MeSH terms

LinkOut - more resources