

Diagnostic accuracy of symptoms for an underlying disease: a simulation study
- PMID: 35970855
- PMCID: PMC9378763
- DOI: 10.1038/s41598-022-14826-2
Diagnostic accuracy of symptoms for an underlying disease: a simulation study
Abstract
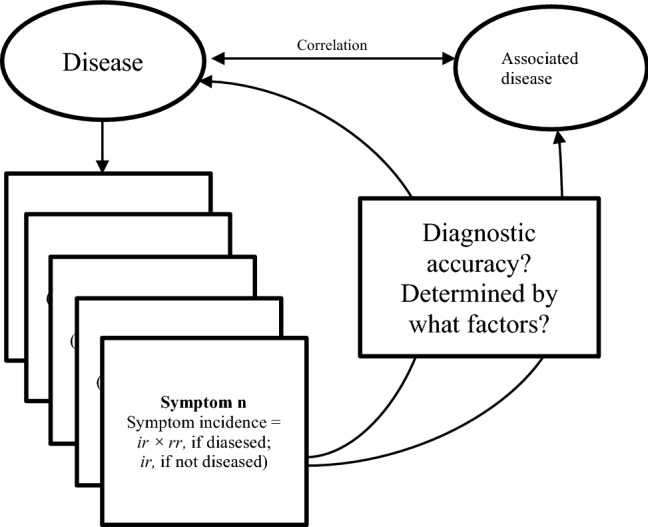
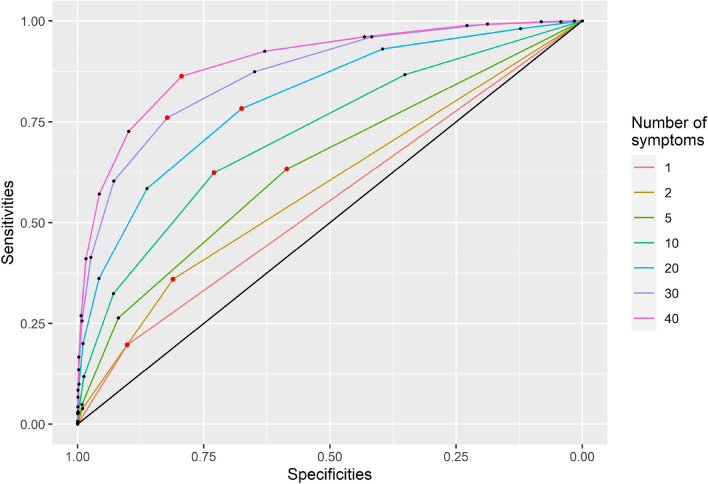
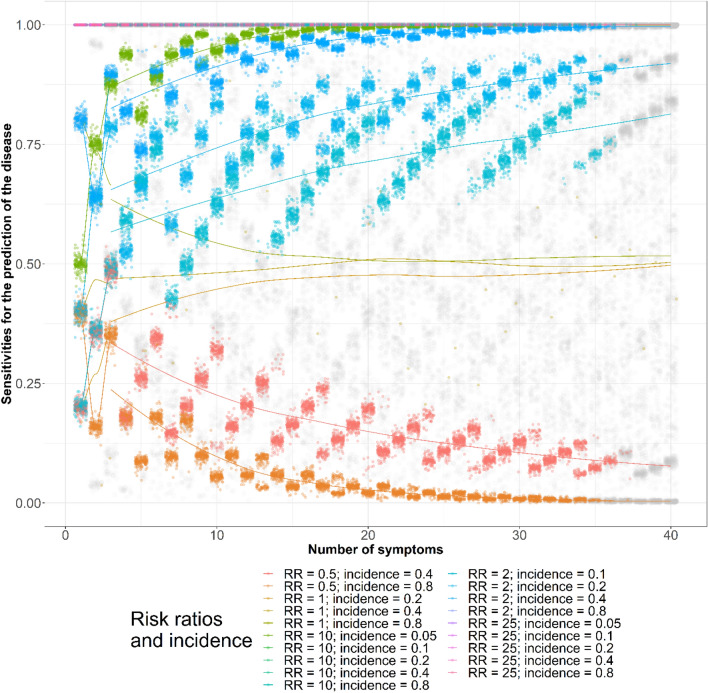
Symptoms have been used to diagnose conditions such as frailty and mental illnesses. However, the diagnostic accuracy of the numbers of symptoms has not been well studied. This study aims to use equations and simulations to demonstrate how the factors that determine symptom incidence influence symptoms' diagnostic accuracy for disease diagnosis. Assuming a disease causing symptoms and correlated with the other disease in 10,000 simulated subjects, 40 symptoms occurred based on 3 epidemiological measures: proportions diseased, baseline symptom incidence (among those not diseased), and risk ratios. Symptoms occurred with similar correlation coefficients. The sensitivities and specificities of single symptoms for disease diagnosis were exhibited as equations using the three epidemiological measures and approximated using linear regression in simulated populations. The areas under curves (AUCs) of the receiver operating characteristic (ROC) curves was the measure to determine the diagnostic accuracy of multiple symptoms, derived by using 2 to 40 symptoms for disease diagnosis. With respect to each AUC, the best set of sensitivity and specificity, whose difference with 1 in the absolute value was maximal, was chosen. The results showed sensitivities and specificities of single symptoms for disease diagnosis were fully explained with the three epidemiological measures in simulated subjects. The AUCs increased or decreased with more symptoms used for disease diagnosis, when the risk ratios were greater or less than 1, respectively. Based on the AUCs, with risk ratios were similar to 1, symptoms did not provide diagnostic values. When risk ratios were greater or less than 1, maximal or minimal AUCs usually could be reached with less than 30 symptoms. The maximal AUCs and their best sets of sensitivities and specificities could be well approximated with the three epidemiological and interaction terms, adjusted R-squared ≥ 0.69. However, the observed overall symptom correlations, overall symptom incidence, and numbers of symptoms explained a small fraction of the AUC variances, adjusted R-squared ≤ 0.03. In conclusion, the sensitivities and specificities of single symptoms for disease diagnosis can be explained fully by the at-risk incidence and the 1 minus baseline incidence, respectively. The epidemiological measures and baseline symptom correlations can explain large fractions of the variances of the maximal AUCs and the best sets of sensitivities and specificities. These findings are important for researchers who want to assess the diagnostic accuracy of composite diagnostic criteria.
© 2022. The Author(s).
Conflict of interest statement
YSC is currently employed by the Canadian Agency for Drugs and Technologies in Health. The other authors declare that they have no competing interests.
Figures


References
-
- American Psychiatric Association . Diagnostic and Statistical Manual of Mental Disorders, Fourth Edition, Text Revision (DSM-IV-TR®) American Psychiatric Association Publishing; 2010.
MeSH terms
LinkOut - more resources
Full Text Sources
