. 2022 Aug 15;13(1):4788.
doi: 10.1038/s41467-022-32541-4.

SH3 domain regulation of RhoGAP activity: Crosstalk between p120RasGAP and DLC1 RhoGAP

Affiliations

SH3 domain regulation of RhoGAP activity: Crosstalk between p120RasGAP and DLC1 RhoGAP

Jocelyn E Chau et al. Nat Commun. .

Abstract

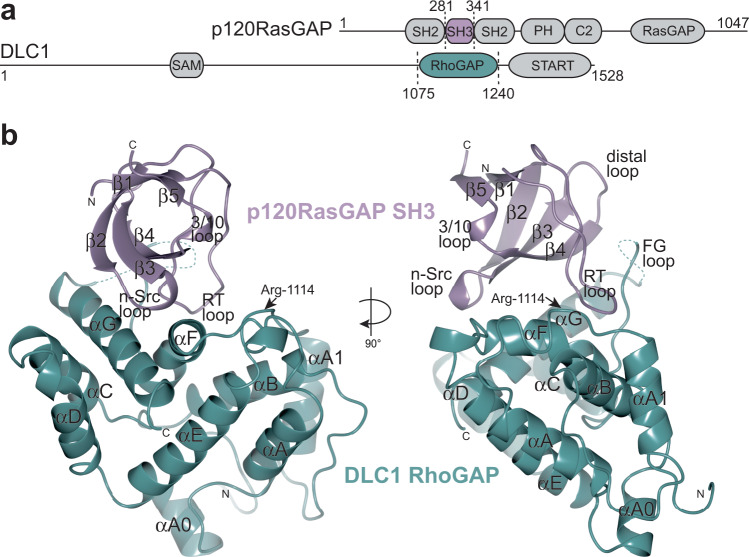
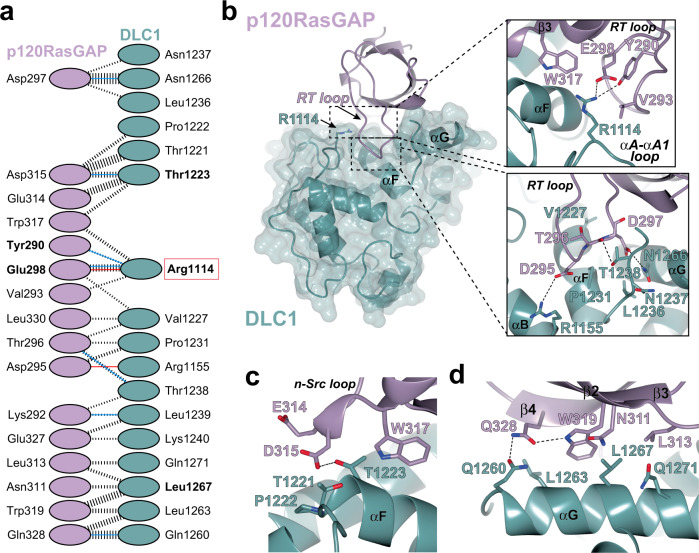
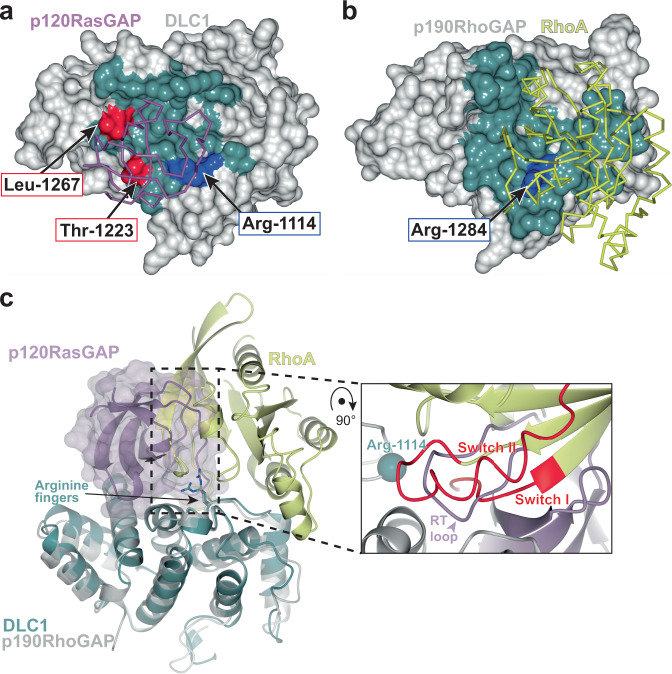
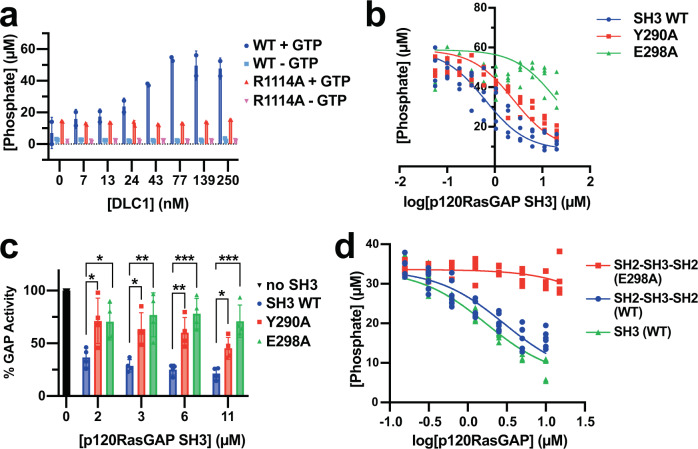
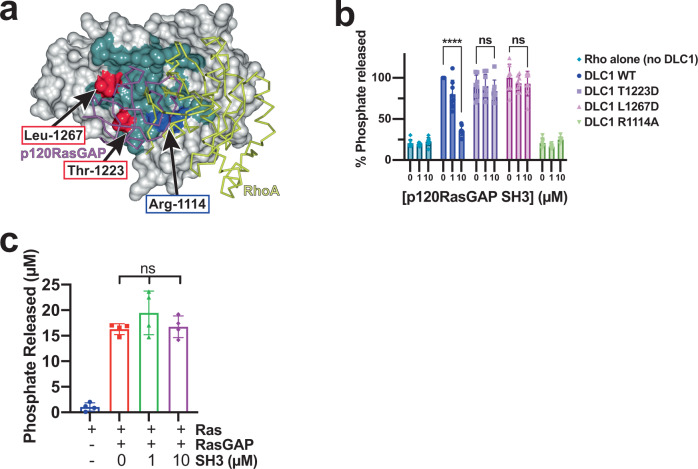
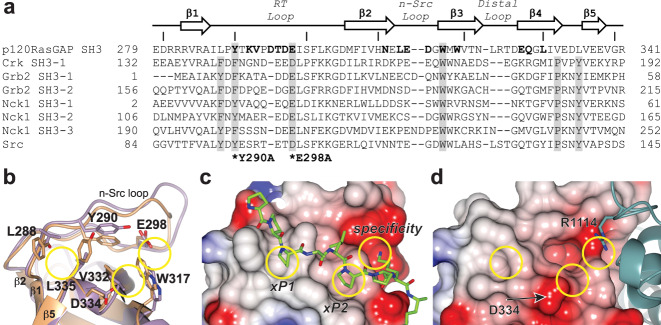
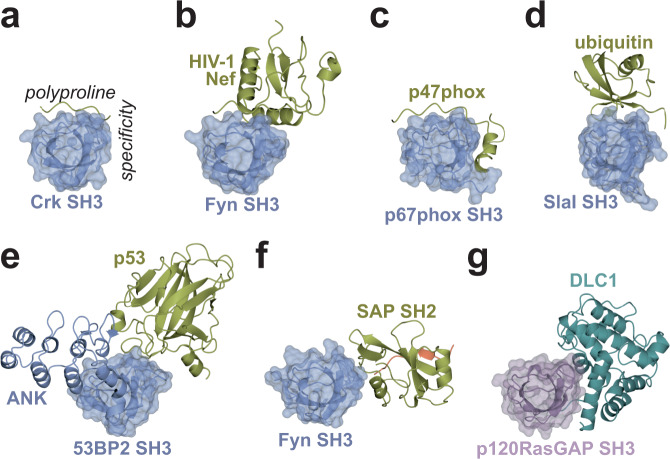
RhoGAP proteins are key regulators of Rho family GTPases and influence a variety of cellular processes, including cell migration, adhesion, and cytokinesis. These GTPase activating proteins (GAPs) downregulate Rho signaling by binding and enhancing the intrinsic GTPase activity of Rho proteins. Deleted in liver cancer 1 (DLC1) is a tumor suppressor and ubiquitously expressed RhoGAP protein; its activity is regulated in part by binding p120RasGAP, a GAP protein for the Ras GTPases. In this study, we report the co-crystal structure of the p120RasGAP SH3 domain bound directly to DLC1 RhoGAP, at a site partially overlapping the RhoA binding site and impinging on the catalytic arginine finger. We demonstrate biochemically that mutation of this interface relieves inhibition of RhoGAP activity by the SH3 domain. These results reveal the mechanism for inhibition of DLC1 RhoGAP activity by p120RasGAP and demonstrate the molecular basis for direct SH3 domain modulation of GAP activity.


Conflict of interest statement

The authors declare no competing interests.

Figures

Fig. 1
Fig. 1. Complex of the SH3 domain of p120RasGAP and the RhoGAP domain of DLC1.
a Domain architecture of p120RasGAP (Uniprot ID: P20936. Domain IDs: SH2: Src Homology 2, SH3: Src Homology 3, PH: Pleckstrin Homology, C2: Protein Kinase C Conserved domain 2; RasGAP: Ras GTPase Activating Protein) and DLC1 (Uniprot ID: Q96QB1, SAM: Sterile Alpha Motif, RhoGAP: Rho GTPase Activating Domain, START: steroidogenic acute regulatory-related lipid transfer). Residue numbers are indicated. Domains from each protein co-crystallized are highlighted in color. b Ribbon diagram of the co-crystal of p120RasGAP SH3 domain (purple) in complex with DLC1 RhoGAP domain (teal). Labeled are the secondary structure elements, loops, amino- and carboxy-termini, and the position of Arg-1114 in DLC1 indicated with an arrow.
Fig. 2
Fig. 2. Details of interface between DLC1 and p120RasGAP.
a Residue interactions adapted from PDBSum and PISA server. Blue line indicates hydrogen bond, red line indicates salt bridge. The width of the black dashed lines is proportional to the number of non-bonded atomic contacts as calculated in PDBSum. SH3 domain in purple and RhoGAP domain in teal. Residues mutated in this study are labeled in bold. b RT loop binding site. Insets show details of the interactions. Details of the interaction showing the SH3 domain contacts made by the n-Src loop (c) and β2-β3-β4 strands with αG (d).
Fig. 3
Fig. 3. Comparison of the RhoGAP binding sites for RhoA and p120RasGAP SH3 domain.
a Surface of DLC1 RhoGAP domain with p120RasGAP SH3 domain binding site highlighted in blue. The Arginine finger Arg-1114 is shown in blue and labeled, and two surface residues mutated in this study (Thr-1223 and Leu-1267) are shown in red. b Surface of p190RhoGAP with RhoA binding site highlighted in teal (PDB ID: 5IRC). The Arginine finger Arg-1284 is shown in red and labeled. Views in A and B are similar after superposition of the RhoGAP domains. Interface residues in (A) and (B) are defined by CCP4mg and is based on buried surface. c Structure of RhoA in complex with p190RhoGAP (PDB ID: 5IRC, gray and yellow) superposed with p120RasGAP SH3 in complex with DLC1 (green and purple). Superposition on the RhoGAP domains. The p120RasGAP SH3 domain (purple) is shown as ribbon and transparent surface to highlight the overlap in binding sites. Inset: the SH3 domain RT loop is a close mimic of the switch I and switch II regions of the active (GTP-bound) conformation of RhoA. The location of the arginine finger Arg-1114 Ca is indicated as a sphere.
Fig. 4
Fig. 4. Biochemical assessment of p120RasGAP SH3 domain inhibition of DLC1 RhoGAP activity.
a DLC1 RhoGAP wild-type (WT, blue and cyan) but not R1114A mutant (red and pink) stimulates RhoA GTPase activity. The concentration of phosphate generated (μM) with added GTP (+GTP) or without GTP (−GTP) is shown. Data are shown as mean values (bars) +/− SD (error bars), and individual measurements are plotted (dots, n = 2). b Titration of p120RasGAP SH3 domain (0–20 μM) wild type (WT, blue) and structurally defined mutants Y290A (red) and E298A (green) to inhibit DLC1 RhoGAP activity. The phosphate generated (in μM) is plotted against the log10 of SH3 concentration (μM), IC50 values were calculated by nonlinear regression (lines), and individual measurements are plotted (dots, n = 4). c Representative SH3 domain concentrations from (b) (2, 3, 6, and 10 μM). % GAP activity is normalized to the maximum phosphate generated by DLC1 stimulated RhoA (black bar, 100%). Data are mean values (bar graph) +/− SD (error bars), and individual measurements are plotted (dots, n = 4). P values: WT vs Y290A: 2 μM SH3: P = 0.0414; 3 μM SH3: P = 0.0263; 6 μM SH3: P = 0.0070; 11 μM SH3: P = 0.0346; WT vs E298A: 2 μM SH3: P = 0.0455; 3 μM SH3: P = 0.0041; 6 μM SH3: P = 0.0004; 11 μM SH3: P = 0.0004. d Inhibition of DLC1 RhoGAP activity by p120RasGAP SH2-SH3-SH2 wild type (blue) or E298A mutant (red), and SH3 domain (green). The phosphate signal (μM) is plotted against the log10 of p120RasGAP concentration. IC50 values were calculated by nonlinear regression (lines), and individual measurements are plotted (dots, n = 7). In b, d, IC50 values are calculated by nonlinear regression in GraphPad Prism using the One site–fit logIC50 model, and are reported in Table 2. In c, P values are calculated in GraphPad Prism using ordinary one-way ANOVA analysis with Tukey’s multiple comparison test. Significant differences are based on P values as indicated:* P = 0.01 to 0.05;** P = 0.001 to 0.01;*** P = 0.0001 to 0.001. Source data are available as a Source Data file.
Fig. 5
Fig. 5. DLC1 RhoGAP mutants and p120RasGAP are not inhibited by SH3 domain.
a Surface representation of DLC1 illustrating the differences in the footprint of binding by p120RasGAP SH3 domain (purple) and RhoA (yellow, predicted), with residues that bind p120RasGAP colored teal. DLC1 residues mutated in this study are labeled. b RhoGAP activity of structurally-defined DLC1 mutants T1223D and L1267D are not inhibited by p120RasGAP SH3 domain. RhoA alone (teal) or RhoA plus the arginine finger mutant DLC1 R1114A (green) are included. Signal is plotted as % phosphate generated, normalized to activity of RhoA plus wild-type DLC1 (blue, 0 μM SH3). Data are presented as mean values (bars) +/− SD (error bars), and individual measurements are plotted (dots, n = 8). P values: WT 0 μM versus 10 μM SH3, P < 0.0001; T1223D 0 μM versus 10 μM SH3, P = 0.7747; L1267D 0 μM versus 10 μM SH3, P = 0.5663. c GTP hydrolysis by Ras (blue) is stimulated by p120RasRasGAP RasGAP domain (red) but is not inhibited by 1 μM (green) or 10 μM (purple) p120RasGAP SH3 domain. Data are presented as mean values (bars) +/− SD (error bars), and individual measurements are plotted (dots, n = 4). P values are: 0 μM versus 1 μM SH3: 0.3148; 0 μM versus 10 μM SH3: 0.9944; 1 μM versus 10 μM SH3: 0.4329. In b, c P values were calculated by ordinary one-way ANOVA analysis with Tukey’s multiple comparison test in GraphPad Prism. Significant differences are based on P values as indicated: ns: P ≥ 0.05; **** P < 0.0001. Source data are available as a Source Data file.
Fig. 6
Fig. 6. p120RasGAP harbors an unusual SH3 domain.
a Structure-based sequence alignment (Dali server) of SH3 domain of p120RasGAP with SH3 domains of human Crk (Uniprot ID: P46108), Grb2 (Uniprot ID: P62993), Nck1 (Uniprot ID: P16333) and Src (Uniprot ID: P12931). SH3-1, -2 or -3 indicates the specific SH3 domain within a protein containing multiple SH3 domains. Residues in p120RasGAP that interact with the RhoGAP of DLC1 are highlighted in bold. Residues in canonical SH3 domains that form the conserved xP binding pockets (xP1 and xP2) and specificity pocket are shaded in gray. Positions of residues mutated in this study - Tyr-290 and Glu-298 - are marked (*) and labeled. In a previous study, only p120RasGAP SH3 domain could inhibit DLC1 RhoGAP activity among these SH3 domains. Every tenth residue in p120RasGAP is marked with a line. b Residues lining the xP1 and xP2 binding pockets and the specificity pockets of p120RasGAP (purple) and Crk SH3-1 domain (orange) (PDB ID: 1CKA). Selected residues of p120RasGAP are labeled. c, d Electrostatic surface potential of (c) Crk SH3 domain in complex with a RapGEF1 peptide shown in stick format (green), d p120RasGAP SH3 domain in complex with DLC1 RhoGAP domain shown in ribbon format (teal). xP1, xP2 and specificity pocket locations are circled as in (b).
Fig. 7
Fig. 7. Comparison of atypical SH3 binding partners.
Examples of atypical SH3 domain complexes that bind partner proteins outside of the canonical polyproline site. In all panels, the SH3 domain (shown as light blue ribbon and partially transparent surface in (a) thru (f) orientation and scale is identical, with the polyproline site on top and the specificity pocket is on the right hand side as labeled in (a). All binding partners in panels (a) thru (f) are shown as ribbon diagrams and colored gold. a Crk/peptide (to illustrate canonical binding; PDB ID: 1CKA). b Fyn SH3 bound to the HIV Nef protein (PDB ID: 1EFN). c p67phox SH3 bound to p47phox (PDB ID: 1K4U). d Yeast SlaI SH3 domain bound to ubiquitin (PDB ID: 2JT4). e 53BP2 SH3 domain interacting with its own ANK repeat region and bound to p53 (gold) (PDB ID: 1YCS). f Fyn SH3 domain bound to SAP SH2 domain which is bound the Slam peptide (orange) (PDB ID: 1M27). g DLC1 RhoGAP (teal) with p120RasGAP SH3 (purple).

Similar articles

Cited by

References

    1. Wennerberg K, Rossman KL, Der CJ. The Ras superfamily at a glance. J. Cell Sci. 2005;118:843–846. doi: 10.1242/jcs.01660. - DOI - PubMed
    1. Etienne-Manneville S, Hall A. Rho GTPases in cell biology. Nature. 2002;420:629–635. doi: 10.1038/nature01148. - DOI - PubMed
    1. Hodge RG, Ridley AJ. Regulating Rho GTPases and their regulators. Nat. Rev. Mol. Cell Biol. 2016;17:496–510. doi: 10.1038/nrm.2016.67. - DOI - PubMed
    1. Mosaddeghzadeh, N. & Ahmadian, M. R. The Rho family GTPases: Mechanisms of regulation and signaling. Cells10, 1831 (2021). - PMC - PubMed
    1. Scheffzek K, et al. The Ras-RasGAP complex: Structural basis for GTPase activation and its loss in oncogenic Ras mutants. Science. 1997;277:333–338. doi: 10.1126/science.277.5324.333. - DOI - PubMed

Publication types

MeSH terms

Substances