. 2022 Aug 15;5(1):818.
doi: 10.1038/s42003-022-03786-y.

The Mis6 inner kinetochore subcomplex maintains CENP-A nucleosomes against centromeric non-coding transcription during mitosis

Affiliations

The Mis6 inner kinetochore subcomplex maintains CENP-A nucleosomes against centromeric non-coding transcription during mitosis

Hayato Hirai et al. Commun Biol. .

Abstract

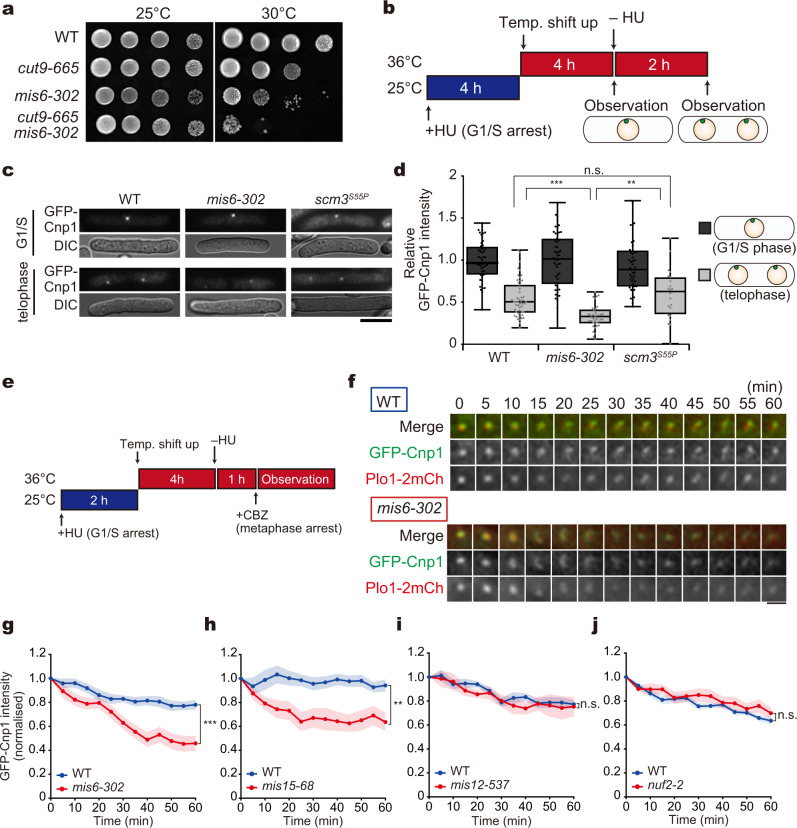
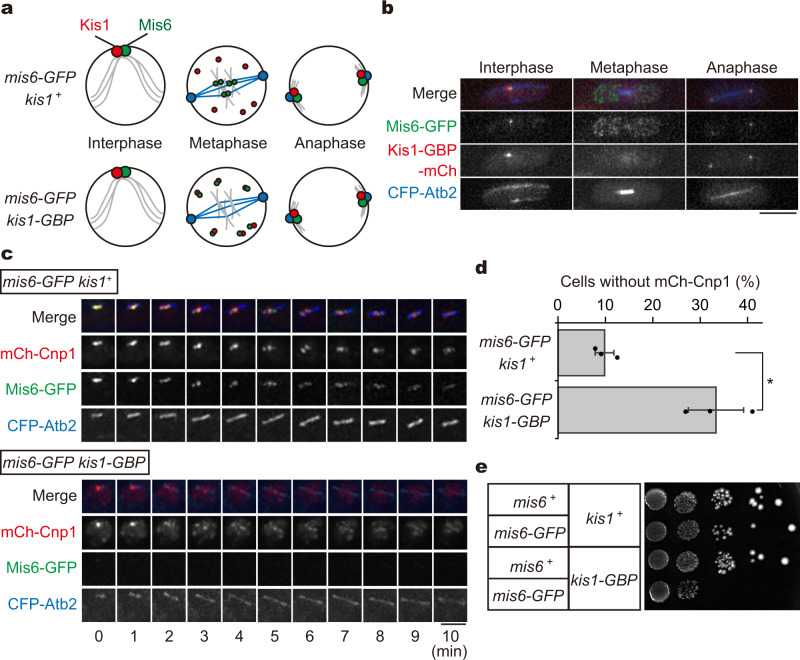
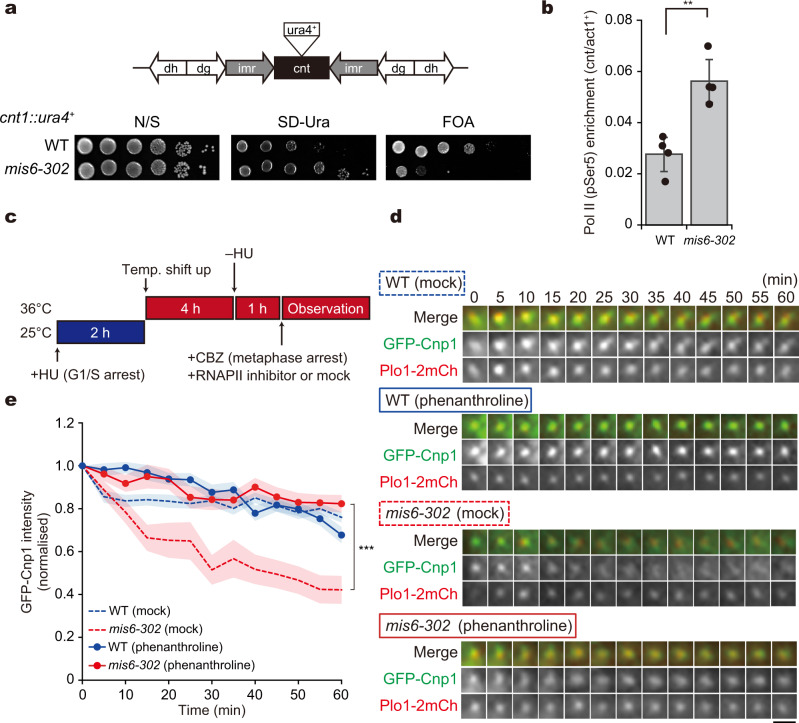
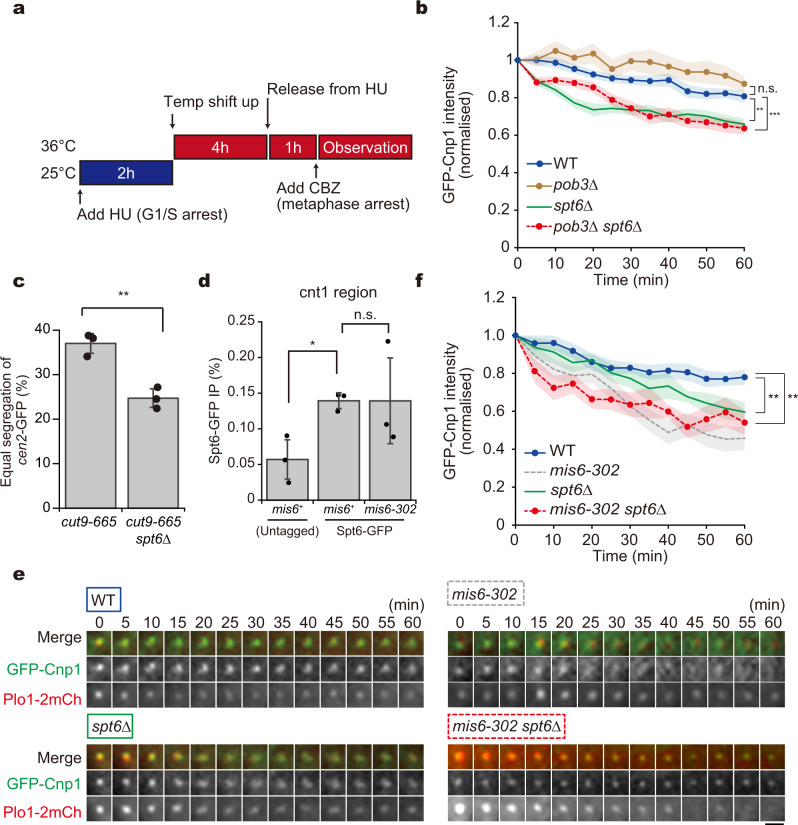
Centromeres are established by nucleosomes containing the histone H3 variant CENP-A. CENP-A is recruited to centromeres by the Mis18-HJURP machinery. During mitosis, CENP-A recruitment ceases, implying the necessity of CENP-A maintenance at centromeres, although the exact underlying mechanism remains elusive. Herein, we show that the inner kinetochore protein Mis6 (CENP-I) and Mis15 (CENP-N) retain CENP-A during mitosis in fission yeast. Eliminating Mis6 or Mis15 during mitosis caused immediate loss of pre-existing CENP-A at centromeres. CENP-A loss occurred due to the transcriptional upregulation of non-coding RNAs at the central core region of centromeres, as confirmed by the observation RNA polymerase II inhibition preventing CENP-A loss from centromeres in the mis6 mutant. Thus, we concluded that the inner kinetochore complex containing Mis6-Mis15 blocks the indiscriminate transcription of non-coding RNAs at the core centromere, thereby retaining the epigenetic inheritance of CENP-A during mitosis.


Conflict of interest statement

The authors declare no competing interests.

Figures

Fig. 1
Fig. 1. Deposition of Cnp1 (CENP-A) ceases in metaphase.
Fluorescence recovery after photobleaching (FRAP) assays were performed with Cnp1-GFP cells arrested at each stage of the cell cycle. Cells with unbleached centromeres were used as controls. a, c, e Recovery kinetics of Cnp1-GFP fluorescence over time (red circles). Controls are also shown (blue circles). Intensities are shown normalised to values before bleaching (pre). b, d, f Time-lapse Cnp1-GFP images of representative cells. Cells were arrested in G1 (using the cdc10 mutant; a, b), G2 (cdc25; c, d) or metaphase (alp12; e, f), and Cnp1-GFP dots were photobleached. Fluorescence recovery at the centromeres was then monitored over time. Numbers of unbleached and bleached cells: n = 11 and 16 (a); n = 9 and 9 (c); n = 19 and 15 (e), respectively. The solid lines indicate the mean value, and the coloured regions indicate the standard error (s.e.m.). Scale bars = 2 µm.
Fig. 2
Fig. 2. Mis6 is required for Cnp1 maintenance at the centromere during metaphase.
a Growth assays for indicated strains. Ten-fold serial dilutions of cells were grown at 25 and 30 °C. bd Comparison of GFP-Cnp1 signals before and after mitosis. b Experimental design. Cells were synchronised at G1/S using hydroxyurea (HU) at 25 °C, followed by a shift up to the restrictive temperature (36 °C) for mis6-302 and scm3S55P mutants in advance. The cells were then released to late mitosis via hydroxyurea (HU) removal. c Representative images showing GFP-Cnp1 and DIC before (G1/S) and after release from hydroxyurea (telophase) in WT, mis6-302, and scm3S55P cells. Scale bar = 5 µm. d GFP-Cnp1 intensities during G1/S (black boxes) and telophase (grey boxes) in WT, mis6-302 and scm3S55P cells were quantified and shown in box plots. WT (G1/S), n = 51 cells; WT (telophase), n = 51 cells; mis6-302 (G1/S), n = 51 cells; mis6-302 (telophase), n = 40 cells; scm3S55P (G1/S), n = 51 cells; scm3S55P (telophase), n = 22 cells. The data are normalised as a ratio of values for telophase to interphase. ***p < 0.001, **p < 0.01, n.s. p > 0.05 (Welch’s t-test). ej Cnp1 maintenance assays using GFP-Cnp1 Plo1-2mCherry cells of the WT, mis6-302, mis15-68, mis12-537 and nuf2-2 background. e Experimental design. Cells were synchronised at G1/S via hydroxyurea (HU) treatment at 25 °C and shifted up to 36 °C for 4 h to inactivate Mis6, Mis15, Mis12, Nuf2 and Alp12 in advance. Cells were released from hydroxyurea (HU) and arrested in mitosis using the microtubule poison carbendazim (CBZ). f Time-lapse images of the GFP-Cnp1 signal (green) during metaphase in WT and mis6-302 cells. Plo1-2mCh (red) is shown as a mitotic and SPB marker (Scale bar: 2 µm). gj Temporal kinetics of GFP-Cnp1 intensities during metaphase arrest in WT (blue solid lines) and each mutant strain (red solid lines), normalised to values for 0 min. g WT, n = 16 cells; mis6-302, n = 20 cells. h WT, n = 20 cells; mis15-68, n = 12 cells. i WT, n = 11 cells; mis12-537, n = 6 cells. j WT, n = 21 cells; nuf2-2, n = 18 cells. The solid lines indicate the mean value, and the coloured regions indicate the standard error (s.e.m.). ***p < 0.001, **p < 0.01, n.s. p > 0.05 (Welch’s t-test).
Fig. 3
Fig. 3. Metaphase-specific removal of Mis6 causes a decrease of Cnp1.
a Schematics illustrating the outline of knocksideways to remove Mis6 from centromeres only during metaphase using Kis1. Kis1 (red) and Mis6 (green) co-localise to centromeres during interphase, but Kis1 disperses at mitosis onset (mis6-GFP kis1+). In cells co-expressing Kis1-GBP and Mis6-GFP, Kis1-GBP brings Mis6-GFP out of centromeres only during metaphase (mis6-GFP kis1-GBP). b Cells expressing Mis6-GFP (green), Kis1-GBP-mCherry (red) and CFP-Atb2 (cyan fluorescent protein fused with α2-tubulin, blue) at each cell cycle stage. Scale bar = 5 µm. c Prometaphase cells expressing Mis6-GFP (green), mCh-Cnp1 (red) and CFP-Atb2 (microtubules; cyan) together with untagged Kis1 (mis6-GFP kis1+) or Kis1-GBP (mis6-GFP kis1-GBP) were imaged. Scale bar = 2 µm. d Population of metaphase cells without mCherry-Cnp1 at centromeres (N = 3 experiments). Error bars = ±s. d. *p < 0.05 (Welch’s t-test). e Growth assays for indicated strains. Cells at ten-fold serial dilutions were grown in EMM at 36 °C.
Fig. 4
Fig. 4. Loss of Cnp1 in mis6-302 cells is coupled with centromeric transcription by RNA polymerase II.
a A schematic illustrating the centromeric DNA structure and ten-fold serial dilution assay. For silencing assays, the ura4+ gene is inserted in the central core (cnt) region (cnt::ura4+) in chromosome I. imr, the innermost repeats; dg and dh, the outer repeats. Ten-fold serial dilution of WT and mis6-302 cells with cnt::ura4+, grown on nonselective (N/S), uracil-deficient (SD–Ura) and counter-selective (5-fluoroorotic acid, FOA) media at 25 °C. b Chromatin IP (ChIP) for phosphorylated RNA polymerase II (RNAPII pSer5) at cnt region (the central core region) in WT and mis6-302 cells at 36 °C (4 h). The % input of the cnt region was normalised to that of the act1+ region. Error bars = ±s. d. (N = 4 experiments). **p < 0.01 (Welch’s t-test). ce RNAPII was inhibited in WT and mis6-302 cells expressing GFP-Cnp1 and Plo1-2mCherry. c Experimental design. Cells arrested to G1/S at 25 °C were shifted up to 36 °C to inactivate Mis6 or Alp12. The cells were then released into mitosis and arrested at metaphase using the microtubule poison carbendazim (CBZ). Cells were treated with an RNAPII inhibitor (1,10-phenanthroline) or mock treatment prior to observation. d Time-lapse imaging of GFP-Cnp1 (green) with Plo1-2mCh (red) in WT and mis6-302 cells with or without the inhibitor. Scale bar = 2 µm. e A Cnp1 maintenance assay. Temporal kinetics of the GFP-Cnp1 fluorescence intensity during metaphase in the indicated samples were monitored. WT (mock, blue dashed line), n = 22 cells; mis6-302 (mock, red dashed line), n = 17 cells; WT (phenanthroline, blue solid line), n = 30 cells; mis6-302 (phenanthroline, red solid line), n = 20 cells. The data are normalised to the intensities at 0 min, and the mean is shown as solid and dashed lines. The coloured regions indicate the standard error (s.e.m.). ***p < 0.001 (Welch’s t-test).
Fig. 5
Fig. 5. Recycling of Cnp1 requires the chromatin remodelling factor Spt6.
a, b Cnp1 maintenance assays during metaphase were performed using mutants of indicated chromatin remodellers. a Experimental design. Cells arrested to G1/S at 25 °C were shifted up to 36 °C to inactivate Alp12. Cells were then released into mitosis and arrested at metaphase via the microtubule poison carbendazim (CBZ) treatment prior to observation. b A Cnp1 maintenance assay. Temporal kinetics of GFP-Cnp1 fluorescence intensity in metaphase were monitored for each mutant. WT (blue solid line), n = 18 cells; pob3∆ (brown solid line), n = 14 cells; spt6∆ (green solid line), n = 16 cells; pob3spt6∆ (red dashed line), n = 35 cells. The data are normalised to intensities at 0 min. c Population of cells with equal segregation of cen2-GFP (chromosome II centromere was visualised with GFP). Error bars = ±s. d., N = 3 experiments. **p < 0.01 (Welch’s t-test [two-tailed]). d ChIP of Spt6-GFP using at the cnt region in mis6+ and mis6-302 cells expressing Spt6-GFP or untagged Spt6. ChIP was performed with the anti-GFP antibody. Error bars = ±s. d., N = 3 experiments. *p < 0.05, n.s. p > 0.05 (Welch’s t-test). e, f Cnp1 maintenance assay. e Time-lapse images for cells expressing GFP-Cnp1 (green) and Plo1-2mCherry (red) for each mutant background. Scale bar = 2 µm. f WT (blue solid line), n = 16 cells; mis6-302 (grey dashed line), n = 20 cells; spt6∆ (green solid line), n = 14 cells; mis6-302 spt6∆ (red dashed line), n = 11 cells. The data are normalised to intensities at 0 min, and used for WT and mis6-302 cells are identical to that in Fig. 2g. The solid and dashed lines indicate the mean value, and the coloured regions indicate the standard error (s.e.m.). ***p < 0.001, **p < 0.01, n.s. p > 0.05 (Welch’s t-test).

Similar articles

References

    1. Walczak CE, Cai S, Khodjakov A. Mechanisms of chromosome behaviour during mitosis. Nat. Rev. Mol. Cell Biol. 2010;11:91–102. doi: 10.1038/nrm2832. - DOI - PMC - PubMed
    1. Biggins S. The composition, functions, and regulation of the budding yeast kinetochore. Genetics. 2013;194:817–846. doi: 10.1534/genetics.112.145276. - DOI - PMC - PubMed
    1. Pidoux AL, Allshire RC. Kinetochore and heterochromatin domains of the fission yeast centromere. Chromosome Res. 2004;12:521–534. doi: 10.1023/B:CHRO.0000036586.81775.8b. - DOI - PubMed
    1. Schueler MG, Sullivan BA. Structural and functional dynamics of human centromeric chromatin. Annu. Rev. Genomics Hum. Genet. 2006;7:301–313. doi: 10.1146/annurev.genom.7.080505.115613. - DOI - PubMed
    1. Holland AJ, Cleveland DW. Boveri revisited: chromosomal instability, aneuploidy and tumorigenesis. Nat. Rev. Mol. Cell Biol. 2009;10:478–487. doi: 10.1038/nrm2718. - DOI - PMC - PubMed

Publication types

MeSH terms

LinkOut - more resources