. 2022 Aug 15;12(1):13825.
doi: 10.1038/s41598-022-17338-1.

A GLP1 receptor agonist diabetes drug ameliorates neurodegeneration in a mouse model of infantile neurometabolic disease

Affiliations

A GLP1 receptor agonist diabetes drug ameliorates neurodegeneration in a mouse model of infantile neurometabolic disease

L Poupon-Bejuit et al. Sci Rep. .

Abstract

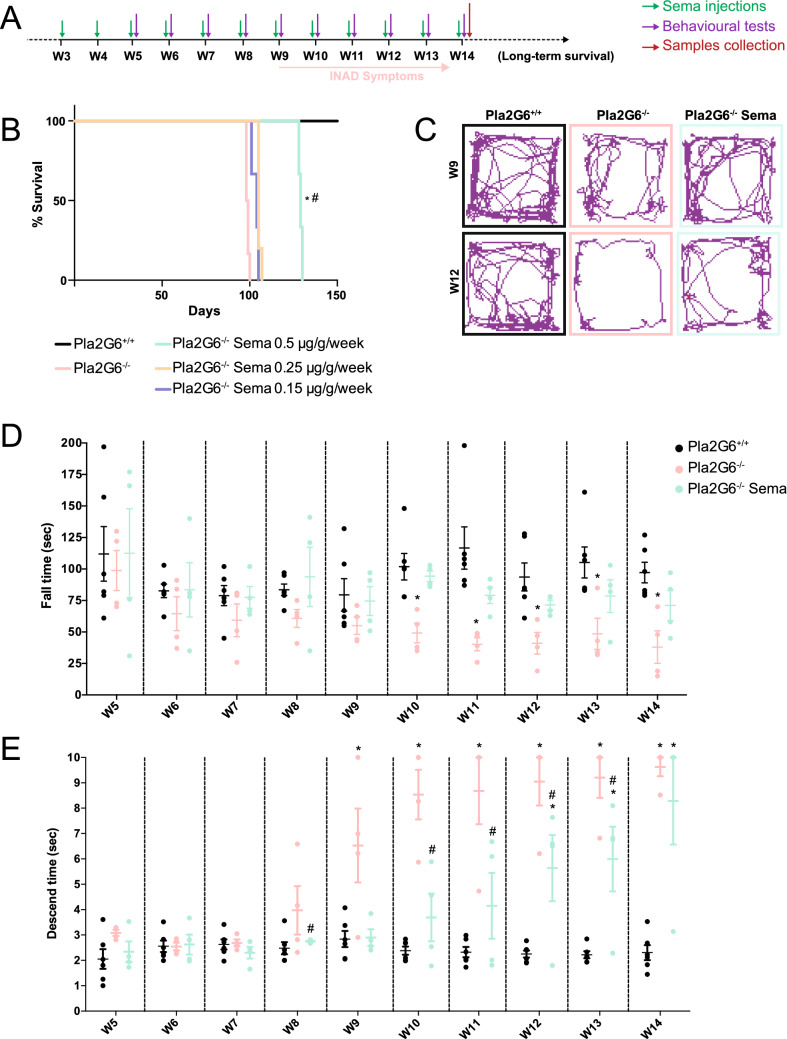
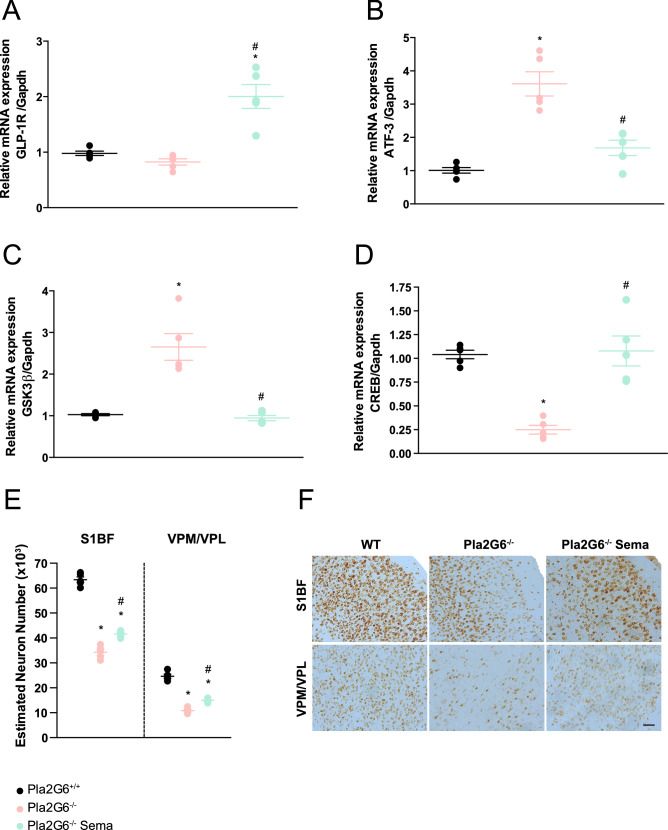
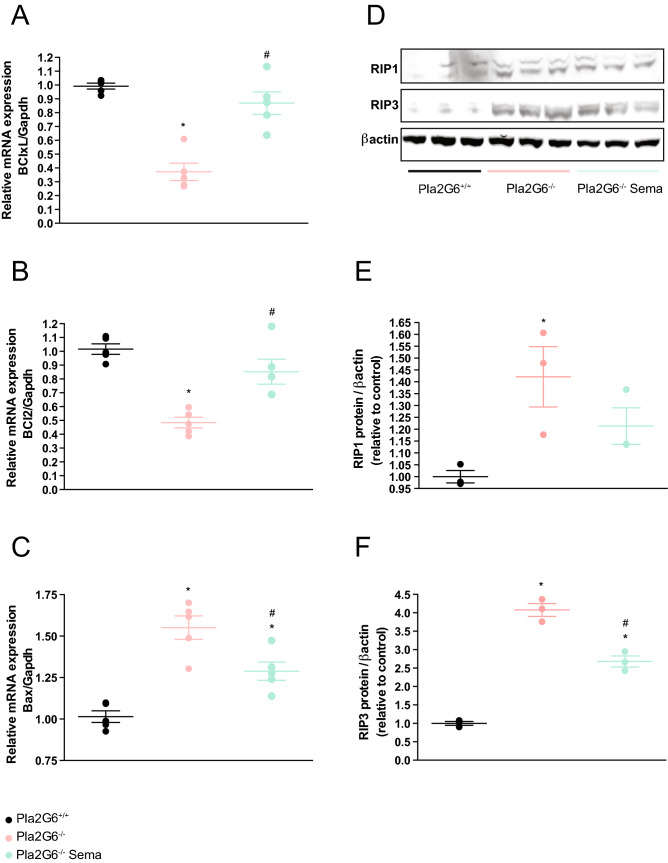
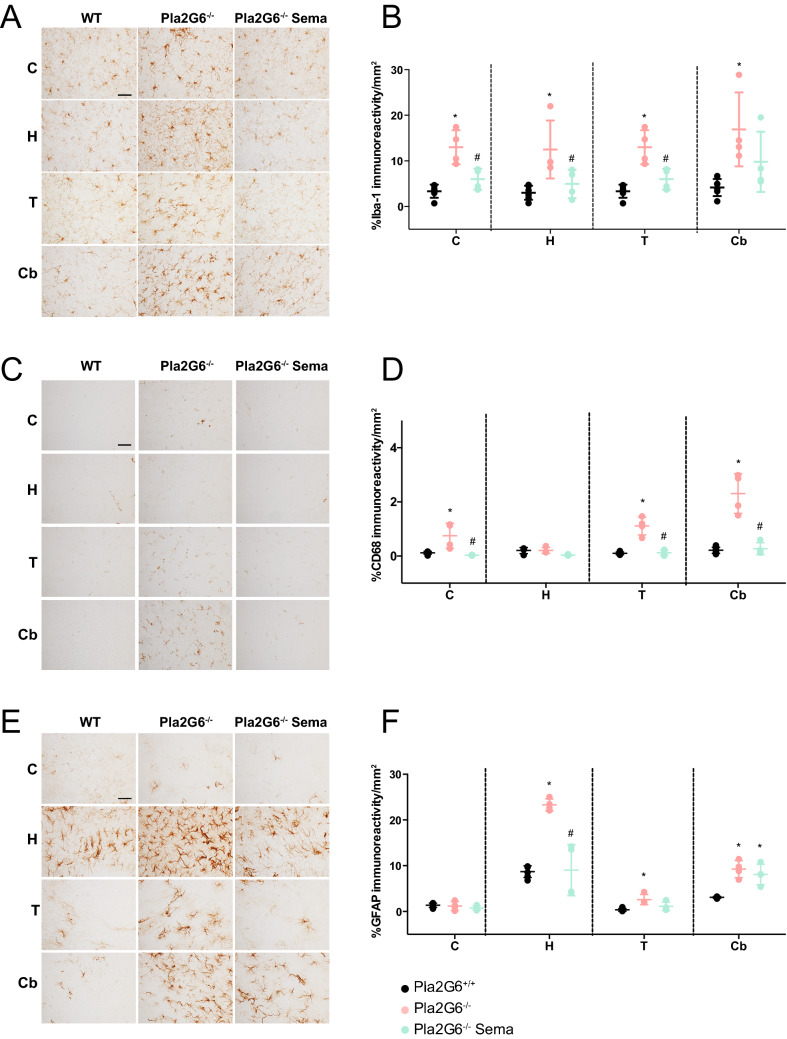
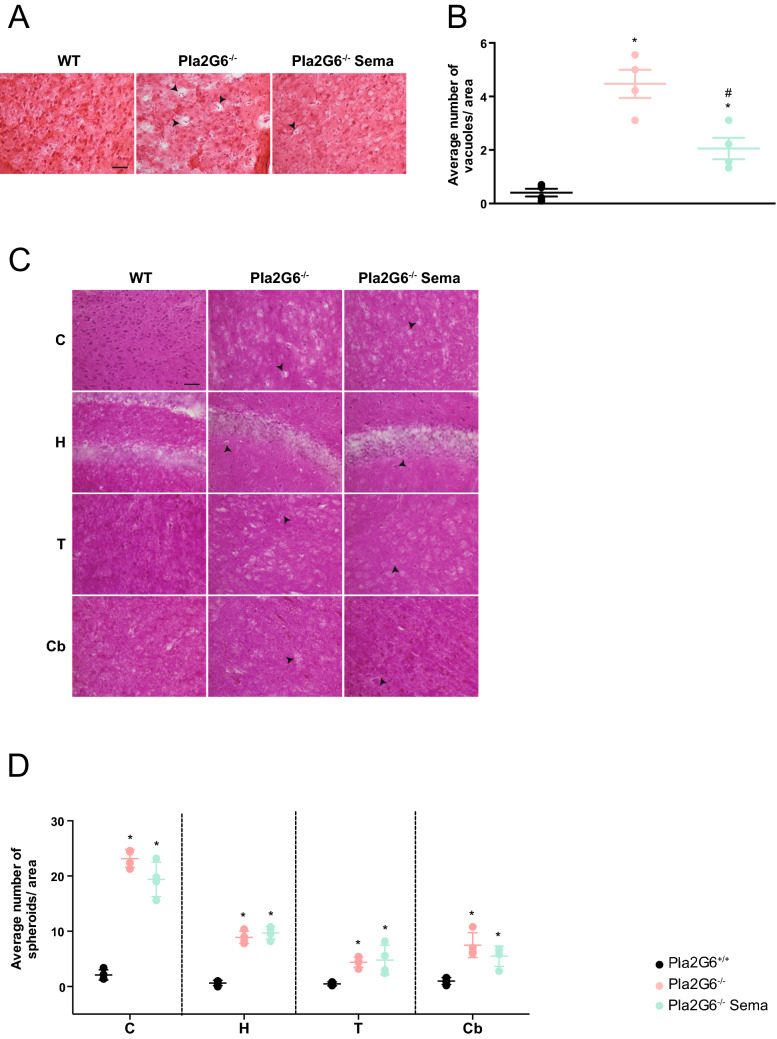
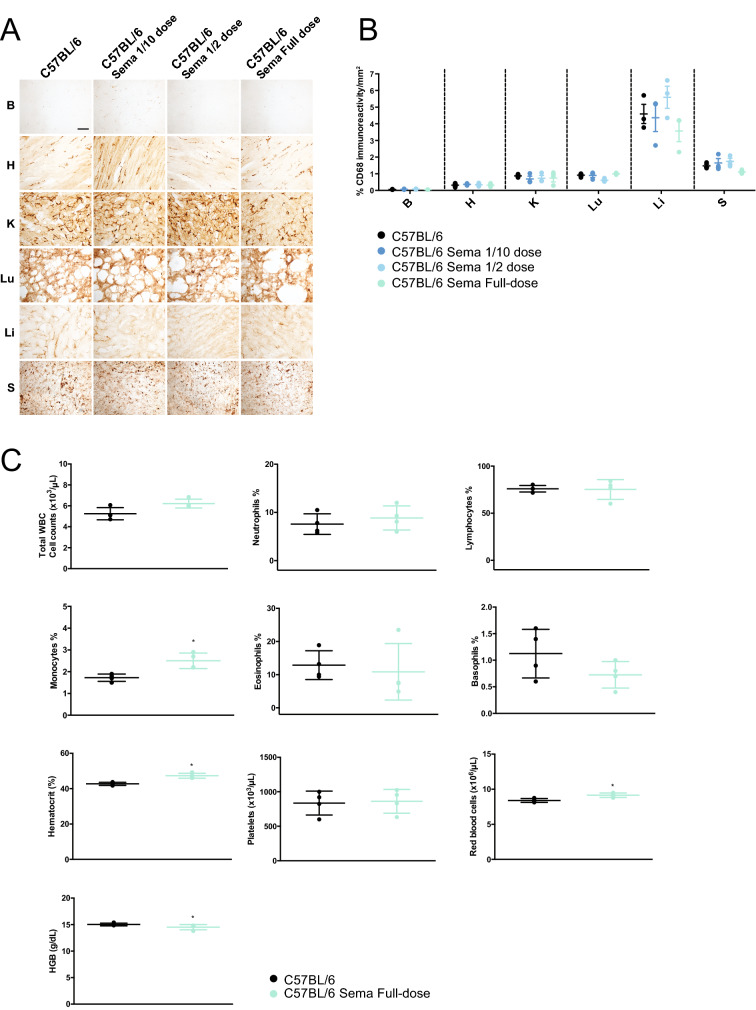
Infantile neuroaxonal dystrophy (INAD) is a rare paediatric neurodegenerative condition caused by mutations in the PLA2G6 gene, which is also the causative gene for PARK14-linked young adult-onset dystonia parkinsonism. INAD patients usually die within their first decade of life, and there are currently no effective treatments available. GLP1 receptor (GLP-1R) agonists are licensed for treating type 2 diabetes mellitus but have also demonstrated neuroprotective properties in a clinical trial for Parkinson's disease. Therefore, we evaluated the therapeutic efficacy of a new recently licensed GLP-1R agonist diabetes drug in a mouse model of INAD. Systemically administered high-dose semaglutide delivered weekly to juvenile INAD mice improved locomotor function and extended the lifespan. An investigation into the mechanisms underlying these therapeutic effects revealed that semaglutide significantly increased levels of key neuroprotective molecules while decreasing those involved in pro-neurodegenerative pathways. The expression of mediators in both the apoptotic and necroptotic pathways were also significantly reduced in semaglutide treated mice. A reduction of neuronal loss and neuroinflammation was observed. Finally, there was no obvious inflammatory response in wild-type mice associated with the repeated high doses of semaglutide used in this study.


Conflict of interest statement

The authors declare no competing interests.

Figures

Figure 1
Figure 1
Improvement of survival and locomotor symptoms in Pla2g6−/− mice following high-dose weekly semaglutide treatment. (A) Schematic of study design. Pla2g6−/− mice received weekly IP administration of semaglutide (n = 6 per group, 0.5 µg/g, 0.25 μg/g or 0.15 μg/g) starting at 3 weeks old. Behavioural assays were performed for the high-dose treated group (0.5 μg/g/week) every week from week 5 to week 14. Tissue was collected at week 14. (B) Survival curve (n = 6 per experimental group); (C) examples of open field traces at weeks 9 and 12. All data are presented as mean (SEM); ordinary two-way ANOVA adjusted using Dunnett’s multiple comparisons test; p values reported in Table S4. (D) rotarod performance represented by latency to fall from accelerating rotarod (WT n = 6, Pla2g6−/− n = 4; Pla2g6−/− Sema n = 4), and (E) time taken for mice to descend on the pole test (WT n = 6, Pla2g6−/− n = 4; Pla2g6−/− Sema n = 4). * indicates statistically significant difference between the relevant experimental group and WT controls; # indicates statistically significant difference between Pla2g6−/− Sema mice and untreated Pla2g6−/− controls.
Figure 2
Figure 2
Semaglutide induces neuroprotection and reduces neuronal damage demonstrated by modulation of neuroprotective markers and neuronal damage markers. Relative quantification of (A) GLP-1R, (B) ATF-3, (C) GSK3β and (D) CREB, with Gapdh as internal reference by quantitative PCR. RT-qPCR performed from RNA samples prepared from WT, untreated Pla2g6−/− and treated Pla2g6−/− Sema brain samples (n = 5 per group). (E) Optical fractionator estimation of NeuN stained neuronal numbers in the somatosensory barrel-field cortex (S1BF) and ventral posteromedial nucleus/ventral posterolateral nucleus (VPM/VPL) of WT, untreated Pla2g6−/− and treated Pla2g6−/− (n = 5 per group) brain sections. (F) Representative images of brain sections stained with NeuN. Scale bar = 100 µm. All data are presented as mean (SEM); ordinary one-way ANOVA adjusted using Tukey’s multiple comparisons test; p values reported in Table S5. * indicates statistically significant difference between the relevant experimental group and WT controls; # indicates statistically significant difference between Pla2g6−/− Sema mice and untreated Pla2g6−/− controls.
Figure 3
Figure 3
Involvement of apoptosis and necroptosis mechanisms in Pla2g6−/− mice treated with semaglutide once weekly. Relative quantification of (A) BClxL, (B) BCl2 and (C) Bax with Gapdh as internal reference by quantitative PCR. RT-qPCR performed from RNA samples prepared from WT, untreated Pla2g6−/− and treated Pla2g6−/− (Pla2g6−/− Sema) brain samples (n = 5 per group). (D) Western blot analysis and quantification of the expression of (E) RIP1 and (F) RIP3 in WT, untreated Pla2g6−/− semaglutide treated Pla2g6−/− brain samples at week 14 (n = 3 per group). Protein quantification was normalised with β-actin. All data are presented as mean (SEM); ordinary one-way ANOVA adjusted using Tukey’s multiple comparisons test; p values reported in Table S6. * indicates statistically significant difference between the relevant experimental group and WT controls; # indicates statistically significant difference between Pla2g6−/− Sema mice and untreated Pla2g6−/− controls.
Figure 4
Figure 4
Neuroinflammation in Pla2g6−/− mice is reduced by semaglutide treatment. (A) Representative micrographs of brain regions (C = cortex, H = hippocampus, T = thalamus, Cb = cerebellum) from Iba-1 stained brain sections and (B) neuropathological quantification of Iba-1 positive microglia immunostaining in Pla2g6−/− mice treated with 0.5 µg/g semaglutide once weekly (WT n = 6, Pla2g6−/− n = 4; Pla2g6−/− Sema n = 4). Scale bar = 100 µm. (C) Representative micrographs of brain regions stained with CD68 and (D) quantification of CD68 positive microglia immunostaining in Pla2g6−/− mice treated with 0.5 µg/g semaglutide once weekly (WT n = 6, Pla2g6−/− n = 4; Pla2g6−/− Sema n = 4). Scale bar = 100 µm. (E) Representative micrographs of brain regions from GFAP stained brain sections and (F) quantification of immunoreactivity of GFAP immunostaining in Pla2g6−/− mice treated with high-dose semaglutide once weekly (WT n = 6, Pla2g6−/− n. = 4; Pla2g6−/− Sema n = 4). Scale bar = 100 µm. All data are presented as individual animals mean (SEM); ordinary one-way ANOVA adjusted using Tukey’s multiple comparisons test; p values reported in Table S7. * indicates statistically significant difference between the relevant experimental group and WT controls; # indicates statistically significant difference between Pla2g6−/− Sema mice and untreated Pla2g6−/− controls.
Figure 5
Figure 5
Assessment of INAD disease specific markers: vacuoles and spheroids quantification in Pla2g6−/− mice. (A) Representative images and (B) vacuole quantification in Pla2g6−/− brains using H&E staining (WT n = 4, Pla2g6−/− n = 4; Pla2g6−/− Sema n = 4). Scale bar = 100 µm. (C) Representative images of different brain regions stained with periodic acid-Shiff (PAS) staining (C = cortex H = hippocampus T = thalamus Cb = cerebellum). Scale bar = 100 µm. (D) Spheroids quantification in Pla2g6−/− brains and controls (WT n = 4, Pla2g6−/− n = 4; Pla2g6−/− Sema n = 4). All data are presented as individual animals mean (SEM); ordinary one-way ANOVA adjusted using Tukey’s multiple comparisons test; p values reported in Table S8. * indicates statistically significant difference between the relevant experimental group and WT controls; # indicates statistically significant difference between Pla2g6−/− Sema mice and untreated Pla2g6−/− controls.
Figure 6
Figure 6
Histopathological organ assessment for macrophage mediated inflammatory response and blood analysis following weekly semaglutide administration. (A) Representative images and (B) quantitative immunoreactivity threshold measurements of microglial and macrophage marker CD68 in the brain, heart, spleen, liver, lung, pancreas and kidney for the different groups (n = 4 per group) in C57BL/6 mice following semaglutide treatment (ip weekly—3 different doses : 1/10 = 0.05 µg/g, half dose = 0.25 µg/g, full-dose = 0.5 µg/g), B = brain, H = heart, K = kidney, Lu = lung, Li = liver, S = spleen. Scale bar = 100 µm. All data are presented as individual animals mean (SEM); ordinary one-way ANOVA adjusted using Dunnett’s multiple comparisons test. (C) Total white blood cell (WBC), neutrophils, lymphocytes, monocytes, eosinophils and basophils counts, haematocrit (HCT), platelets, red blood cells (RBC), haemoglobin at the end of the treatment regimen in Pla2g6+/+ mice. All data are presented as individual animals mean (SEM); Mann–Whitney U test; p values reported in Table S9. * indicates statistically significant difference between the relevant experimental group and WT controls; # indicates statistically significant difference between Pla2g6−/− Sema mice and untreated Pla2g6−/− controls.

Similar articles

Cited by

References

    1. Morgan NV, et al. PLA2G6, encoding a phospholipase A2, is mutated in neurodegenerative disorders with high brain iron. Nat Genet. 2006;38:752–754. doi: 10.1038/ng1826. - DOI - PMC - PubMed
    1. Paisan-Ruiz C, et al. Characterization of PLA2G6 as a locus for dystonia-parkinsonism. Ann Neurol. 2009;65:19–23. doi: 10.1002/ana.21415. - DOI - PMC - PubMed
    1. Paisan-Ruiz C, et al. Early-onset L-dopa-responsive parkinsonism with pyramidal signs due to ATP13A2, PLA2G6, FBXO7 and spatacsin mutations. Mov Disord. 2010;25:1791–1800. doi: 10.1002/mds.23221. - DOI - PMC - PubMed
    1. Gregory, A., Kurian, M. A., Maher, E. R., Hogarth, P. & Hayflick, S. J. in GeneReviews((R)) (eds M. P. Adam et al.) (1993).
    1. Illingworth MA, et al. PLA2G6-associated neurodegeneration (PLAN): further expansion of the clinical, radiological and mutation spectrum associated with infantile and atypical childhood-onset disease. Mol Genet Metab. 2014;112:183–189. doi: 10.1016/j.ymgme.2014.03.008. - DOI - PMC - PubMed

Publication types

Substances

Supplementary concepts