. 2022 Oct;30(10):1121-1131.
doi: 10.1038/s41431-022-01162-2. Epub 2022 Aug 15.

Whole exome and genome sequencing in mendelian disorders: a diagnostic and health economic analysis

Affiliations

Whole exome and genome sequencing in mendelian disorders: a diagnostic and health economic analysis

Lisa J Ewans et al. Eur J Hum Genet. 2022 Oct.

Abstract

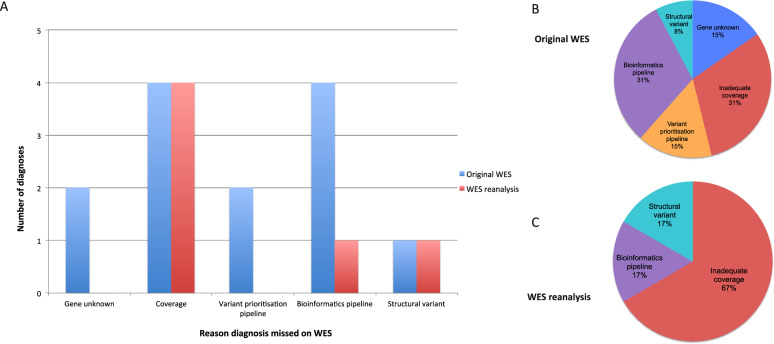
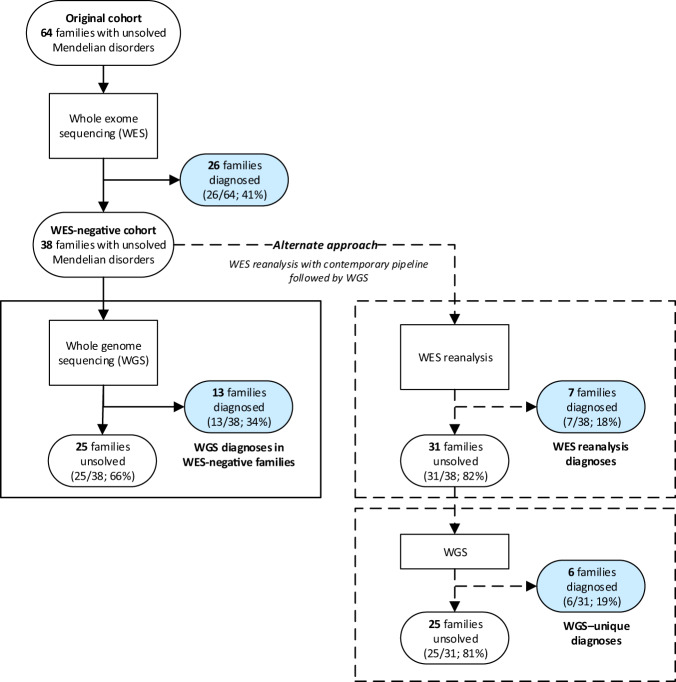
Whole genome sequencing (WGS) improves Mendelian disorder diagnosis over whole exome sequencing (WES); however, additional diagnostic yields and costs remain undefined. We investigated differences between diagnostic and cost outcomes of WGS and WES in a cohort with suspected Mendelian disorders. WGS was performed in 38 WES-negative families derived from a 64 family Mendelian cohort that previously underwent WES. For new WGS diagnoses, contemporary WES reanalysis determined whether variants were diagnosable by original WES or unique to WGS. Diagnostic rates were estimated for WES and WGS to simulate outcomes if both had been applied to the 64 families. Diagnostic costs were calculated for various genomic testing scenarios. WGS diagnosed 34% (13/38) of WES-negative families. However, contemporary WES reanalysis on average 2 years later would have diagnosed 18% (7/38 families) resulting in a WGS-specific diagnostic yield of 19% (6/31 remaining families). In WES-negative families, the incremental cost per additional diagnosis using WGS following WES reanalysis was AU$36,710 (£19,407;US$23,727) and WGS alone was AU$41,916 (£22,159;US$27,093) compared to WES-reanalysis. When we simulated the use of WGS alone as an initial genomic test, the incremental cost for each additional diagnosis was AU$29,708 (£15,705;US$19,201) whereas contemporary WES followed by WGS was AU$36,710 (£19,407;US$23,727) compared to contemporary WES. Our findings confirm that WGS is the optimal genomic test choice for maximal diagnosis in Mendelian disorders. However, accepting a small reduction in diagnostic yield, WES with subsequent reanalysis confers the lowest costs. Whether WES or WGS is utilised will depend on clinical scenario and local resourcing and availability.


Conflict of interest statement

The authors declare no competing interests.

Figures

Fig. 1
Fig. 1. Explanations for WGS diagnoses missed by WES.
A Bar chart comparing grouping of explanation for missed WES diagnoses made by WGS in blue for prior (original) WES and red for WES reanalysis. Visualisation of proportion of missed WES diagnoses based on reason for prior WES (B) and WES reanalysis (C).
Fig. 2
Fig. 2. Structural variants identified through WGS.
A RAB39B partial exon 1 deletion diagnosed through WGS. Simplified IGV (PMC3346182) screenshot showing ClinSV-detected deletion encompassing part of exon 1 and into the upstream untranslated region with supporting evidence. Tracks from top to bottom: sequencing read coverage, called structural variant, supporting discordant mapping read pairs, gnomAD variants with allele frequencies, gene models. There is no evidence of a similar deletion in gnomAD. Complex structural variant involving chromosome 1 and chromosome X in the region of MID1: (B) Simplified IGV (PMC3346182) screenshot showing intronic MID1 duplication in an affected male; (C) Illustration of complex structural variant connecting parts of chromosome X and chromosome 1. The evidence suggests that a part of the pseudoautosomal regions (PAR) is connected with the intronic MID1 duplication and a duplication on chromosome 1. The insertion point in the genome remains elusive, but is suspected to be on chromosome X due to evidence of X-linked inheritance in the family.
Fig. 3
Fig. 3. Comparison of diagnostic outcomes between WES, WES reanalysis with contemporary pipeline, and WGS.
Blue shading represents families receiving a genomic diagnosis; grey shading represents undiagnosed families.

References

    1. Gilissen C, Hehir-Kwa JY, Thung DT, van de Vorst M, van Bon BWM, Willemsen MH, et al. Genome sequencing identifies major causes of severe intellectual disability. Nature. 2014;511:344–7. doi: 10.1038/nature13394. - DOI - PubMed
    1. Belkadi A, Bolze A, Itan Y, Cobat A, Vincent QB, Antipenko A, et al. Whole-genome sequencing is more powerful than whole-exome sequencing for detecting exome variants. Proc Natl Acad Sci. 2015;112:5473–8. doi: 10.1073/pnas.1418631112. - DOI - PMC - PubMed
    1. Stavropoulos DJ, Merico D, Jobling R, Bowdin S, Monfared N, Thiruvahindrapuram B, et al. Whole-genome sequencing expands diagnostic utility and improves clinical management in paediatric medicine. Npj Genom Med. 2016;1:15012. doi: 10.1038/npjgenmed.2015.12. - DOI - PMC - PubMed
    1. Harel T, Lupski JR. Genomic disorders 20 years on-mechanisms for clinical manifestations. Clin Genet. 2018;93:439–49. doi: 10.1111/cge.13146. - DOI - PubMed
    1. Cooper TA, Wan L, Dreyfuss G. RNA and disease. Cell. 2009;136:777–93. doi: 10.1016/j.cell.2009.02.011. - DOI - PMC - PubMed

Publication types