. 2022 Aug 15;12(1):13826.
doi: 10.1038/s41598-022-15883-3.

Global patterns of the cranial form of modern human populations described by analysis of a 3D surface homologous model

Affiliations

Global patterns of the cranial form of modern human populations described by analysis of a 3D surface homologous model

Hirofumi Matsumura et al. Sci Rep. .

Abstract

This study assessed the regional diversity of the human cranial form by using geometric homologous models based on scanned data from 148 ethnic groups worldwide. This method adopted a template-fitting technique for a nonrigid transformation via the iterative closest point algorithm to generate the homologous meshes. Through the application of principal component analysis to 342 sampled homologous models, the largest variation was detected in overall size, and small South Asian crania were clearly verified. The next greatest diversity was found in the length/breadth proportion of the neurocranium, which showed the contrast between the elongated crania of Africans and the globular crania of Northeast Asians. Notably, this component was slightly correlated with the facial profile. Well-known facial features, such as the forward projection of the cheek among Northeast Asians and compaction of the European maxilla, were reconfirmed. These facial variations were highly correlated with the calvarial outline, particularly the degree of frontal and occipital inclines. An allometric pattern was detected in facial proportions in relation to overall cranial size; in larger crania, the facial profiles tend to be longer and narrower, as demonstrated among many American natives and Northeast Asians. Although our study did not include data on environmental variables that are likely to affect cranial morphology, such as climate or dietary conditions, the large datasets of homologous cranial models will be usefully available for seeking various attributions to phenotypic skeletal characteristics.


Conflict of interest statement

The authors declare no competing interests.

Figures

Figure 1
Figure 1
Creation process of the homologous fitting model of 3D scanned crania.
Figure 2
Figure 2
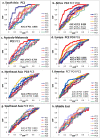
ROC curves applied to nine principal component scores based on vertex data sets of 342 male homologous cranial models. AUC: area under the curve with significance at 0.01% level to distinguish each geographical assemblage from other pooled assemblage. TPF true-positive fraction (effective discrimination), FPF false-positive fraction (non-effective discrimination).
Figure 3
Figure 3
Frequency distribution (normal fit curve) for PC1 scores of 342 male cranial individuals worldwide, a color map of cranial surface highly correlating vertices to PC1 (interpretation of color against X, Y, Z axis: see text), and virtual shape deformations with a magnitude of 3 SD at the opposite sides of this axis. The scale is given as a green colored sphere of 50 mm in diameter.
Figure 4
Figure 4
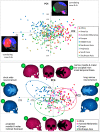
Scatter scoring diagrams of PC2 and PC4 for cranial individuals from nine geographical units (upper), and four geographical units (lower), color maps of cranial surface highly correlating vertices to each PC (interpretation of color against X, Y, Z axis: see text), and virtual shape deformations with a magnitude of 3 SD at the opposite sides of these axes. The scale is given as a green colored sphere of 50 mm in diameter.
Figure 5
Figure 5
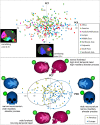
Scatter scoring diagrams of PC6 and PC7 for cranial individuals from nine geographical units (upper), and two geographical units (lower), color maps of cranial surface highly correlating vertices to each PC (interpretation of color against X, Y, Z axis: see text), and virtual shape deformations with a magnitude of 3 SD at the opposite sides of these axes. The scale is given as a green colored sphere of 50 mm in diameter.
Figure 6
Figure 6
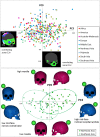
Scatter scoring diagrams of PC3 and PC9 for cranial individuals from nine geographical units (upper), and three geographical units (lower), color maps of cranial surface highly correlating vertices to each PC (interpretation of color against X, Y, Z axis: see text), and virtual shape deformations with a magnitude of 3 SD at the opposite sides of these axes. The scale is given as a green colored sphere of 50 mm in diameter.
Figure 7
Figure 7
The regression slopes in log liner relations between the PC scores of shape components (derived from normalized data) and centroid sizes, with virtual shape deformations having a magnitude of 3 SD at the opposite sides of the lines, for the significant allometric relationships listed in Table 4.

Similar articles

Cited by

References

    1. Wolpoff MH. Climatic influence on the skeletal nasal aperture. Am. J. Phys. Anthropol. 1968;29:405–423. doi: 10.1002/ajpa.1330290315. - DOI - PubMed
    1. Beals KL. Head form and climatic stress. Am. J. Phys. Anthropol. 1972;37:85–92. doi: 10.1002/ajpa.1330370111. - DOI - PubMed
    1. Beals KL, Smith CL, Dodd SM. Climate and the evolution of brachycephalization. Am. J. Phys. Anthropol. 1983;62:425–437. doi: 10.1002/ajpa.1330620407. - DOI - PubMed
    1. Beals KL, et al. Brain size, cranial morphology, climate, and time machines. Curr. Anthropol. 1984;25:301–330. doi: 10.1086/203138. - DOI
    1. Perez SI, Monteiro LR. Nonrandom factors in modern human morphological diversification: A study of craniofacial variation in southern South american populations. Evolution. 2009;63:978–993. doi: 10.1111/j.1558-5646.2008.00539.x. - DOI - PubMed

Publication types