. 2022 Aug;28(8):1646-1655.
doi: 10.1038/s41591-022-01930-z. Epub 2022 Aug 15.

Genomic and transcriptomic determinants of response to neoadjuvant therapy in rectal cancer

Affiliations

Genomic and transcriptomic determinants of response to neoadjuvant therapy in rectal cancer

Walid K Chatila et al. Nat Med. 2022 Aug.

Abstract

The incidence of rectal cancer is increasing in patients younger than 50 years. Locally advanced rectal cancer is still treated with neoadjuvant radiation, chemotherapy and surgery, but recent evidence suggests that patients with a complete response can avoid surgery permanently. To define correlates of response to neoadjuvant therapy, we analyzed genomic and transcriptomic profiles of 738 untreated rectal cancers. APC mutations were less frequent in the lower than in the middle and upper rectum, which could explain the more aggressive behavior of distal tumors. No somatic alterations had significant associations with response to neoadjuvant therapy in a treatment-agnostic manner, but KRAS mutations were associated with faster relapse in patients treated with neoadjuvant chemoradiation followed by consolidative chemotherapy. Overexpression of IGF2 and L1CAM was associated with decreased response to neoadjuvant therapy. RNA-sequencing estimates of immune infiltration identified a subset of microsatellite-stable immune hot tumors with increased response and prolonged disease-free survival.


Figures

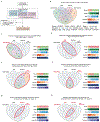
Extended Data Fig. 1
Extended Data Fig. 1. Cohort overview and patient breakdown by analyses
((A) Overview of the different sample sets used for the different analyses described in the manuscript, including sample sizes and reasons for exclusion. (B) Venn diagrams showing overlaps for patients with available MSK-IMPACT, WES, RNA-Seq and NAT outcome data. Color bars show the distribution of different relevant clinical variables. (C-H) Same as B, but restricted to the subset of patients used in specific analyses described in the manuscript. Thick red contours drawn on top of the Venn diagrams are used to highlight the set of patients used in each case. The G# in the titles refer to the columns found in Table S1.
Extended Data Fig. 2
Extended Data Fig. 2. Additional insights into the genomic landscape of rectal cancer
(A) Overview of driver alterations in rectal cancer stratified by tumor stage. (B) Distribution of clonal vs. driver mutations for the most frequently mutated genes in our rectal cancer cohort. (C) Fraction of samples with two driver mutations in selected genes where both are clonal, both are subclonal or only one is clonal. (D) Distribution of KRAS mutations stratified by affected codon and specific amino acid change. Blue vertical bars show the fraction of clonal vs. subclonal mutations. Red and gray bars show the fraction of samples with allelic imbalance (mutant selection). (E) Distribution of mutational signatures for samples in the WES cohort. Samples were ordered from left to right in terms of decreasing SBS1 signature (mitotic clock) and stratified according to dMMR/MSI status.
Extended Data Fig. 3
Extended Data Fig. 3. Comparison of colon and rectal adenocarcinomas
(A) Clinicopathological features for right colon, left colon, and rectum samples. (B) Differences in first site of metastasis stratified by primary tumor location. (C) TMB and FGA in pMMR/MSS tumors from the right colon (n=121), left colon (n=187), and rectum (n=449). Statistical significance was assessed using a two-sided Mann-Whitney U test. (D) Frequency of somatic alterations in oncogenic signaling pathways by anatomic location. Significant results were denoted as * indicating q <0.05, ** indicating q<0.01, *** indicating q<0.005, and **** indicating q<0.001. (E) Frequency of RAS/RAF alterations in hypermutated and non-hypermutated tumors stratified by tumor location. (F) Copy number profiles for tumors in the analyzed cohorts. (G) Frequency of copy number alterations affecting the p and q arms of chromosome 20 by anatomic location. (H) FGA as a function of TP53 status, stratified by missense vs. truncating and mono-allelic vs. biallelic inactivation, for tumors from the right colon (wild-type n=39, missense n=8, missense biallelic n=33, truncating n=1, truncating biallelic n=17), left colon (wild-type n=32, missense n=10, missense biallelic n=77, truncating n=5, truncating biallelic n=29) and rectum (wild-type n=73, missense n=44, missense biallelic n=175, truncating n=12, truncating biallelic n=81). (I) Fraction of dMMR/MSI tumors by rectal segment. (J) Distance to the anal verge by APC status in the validation cohort of metastatic patients. APC WT (n=43) were compared to APC altered (n=115) using a two-sided Mann-Whitney U test, * indicates p=0.0029. (K) Distribution of APC mutations by genomic location in tumors from the right colon, left colon, upper rectum, middle rectum, and lower rectum. In panels (B), (D) and (G), statistical significance was assessed using a two-sided Fisher’s exact test and p values were corrected for multiple testing using false discovery rate. In panels (C), (H) and (J), boxplots’ center lines indicate medians, edges indicate the interquartile range, and whiskers extend to the highest and lowest values not considered outliers.
Extended Data Fig. 4
Extended Data Fig. 4. Clinical and genomic determinants of response to NAT in LARC
(A) Frequency of somatic alterations in rectal cancer driver genes for the patients used in our analyses of clinical outcomes, stratified by cohort. (B) Frequency of somatic alterations in oncogenic signaling pathways for the patients used in our analyses of clinical outcomes, stratified by cohort. (C) Left panel shows results from a multivariate analysis of associations between CR and a combination of clinicopathological and genomic features using a logistic regression model. The error bars indicate the 95% confidence interval. Right panel shows results from a multivariate analysis of associations between DFS and a combination of clinicopathological and genomic features using a Cox proportional hazards model. The results shown in this panel were obtained using patients treated with CRT-CNCT. (D) The left panel shows a multivariate analysis of associations between CR and a combination of clinicopathological and genomic features using a logistic regression model. The error bars indicate the 95% confidence interval. The right panel shows results from a multivariate analysis of associations between DFS and a combination of clinicopathological and genomic features using a Cox proportional hazards model. The results shown in this panel were obtained using patients treated with INC-CRT.
Extended Data Fig. 5
Extended Data Fig. 5. Stratification of rectal adenocarcinomas using the consensus molecular subtypes (CMS) classification
(A) Expression levels for selected genes stratified by CMS group. Genes were annotated using the signatures from Budinska et al.57 (B) TMB stratified by CMS groups. Sample sizes are: CMS1 (n=11), CMS2 (n=26), CMS3 (n=26), and CMS4 (n=38). (C) FGA stratified by CMS groups. Sample sizes are: CMS1 (n=11), CMS2 (n=26), CMS3 (n=26), and CMS4 (n=38). (D) Percentage of KRAS mutated tumors by CMS group. (E) ssGSEA scores for selected pathways from the Hallmark dataset35. Sample sizes are: CMS1 (n=11), CMS2 (n=26), CMS3 (n=26), and CMS4 (n=38). (F) DFS for LARC patients treated with NAT, stratified by CMS group. (G) Levels of CA9 gene expression as a function of KRAS and PIK3CA mutational status. Double-mutants and KRAS-mutant tumors had significantly higher expression of CA9 compared to wild-type tumors, p=1.3e-07 and p=4.65e-05, respectively. Sample sizes are: Double-mutant (n=8), KRAS-mutant (n=26), PIK3CA-mutant (n=6), and wild-type (n=5). Statistical significance was assessed using a two-sided Mann-Whitney U test. (H) Expression of L1CAM stratified by CMS group. L1CAM expression was higher in CMS2 and CMS4 compared to CMS3, q=0.0498 and q=0.096, respectively. Sample sizes are: CMS1 (n=11), CMS2 (n=26), CMS3 (n=26), and CMS4 (n=38). (I) Validation of transcriptomic findings using an independent cohort of 15 LARC cases from Kamran et al.10 Differential gene expression was conducted using DESeq2 and the p-values attained by the Wald test were corrected using false discovery rates. In panels (B), (C), (E) and (H), statistical significance was assessed using a two-sided Mann-Whitney U test. P values were corrected using the Bonferroni method and significant results were denoted as * indicating q <0.05, ** indicating q<0.01, *** indicating q<0.005, and **** indicating q<0.001. In panels (B), (C), (E), (G), and (H), boxplots’ center lines indicate medians, edges indicate the interquartile range, and the whiskers extend to the highest and lowest values not considered outliers.
Extended Data Fig. 6
Extended Data Fig. 6. Supporting information for the characterization of immune hot pMMR/MSS LARC tumors with favorable outcomes from NAT
(A) Quantification of intra-tumoral TILs from H&E slides for 20 patients, including cases from IG1 (n=6), IG2 (n=6), IG3 (n=5) and IG4 (n=3). Statistical significance was assessed using a two-sided Mann-Whitney U test. P values were corrected using the Bonferroni method. Boxplots’ center lines indicate medians, edges indicate the interquartile range, and the whiskers extend to the highest and lowest values not considered outliers. Right panel shows correlation between estimated fractions of intra-tumoral and inter-tumoral TILs. Statistical significance was assessed using a two-sided Spearman correlation. Error bands represent 95% confidence intervals. (B) ssGSEA scores for immune cell signatures from Bindea et al. . Displayed cell types are the ones with an adjusted p-value < 0.10 after Bonferroni correction, based on a Kruskal-Wallis test. (C) Comparison of ssGSEA scores for specific oncogenic pathway signatures from the Hallmark set across the four immune clusters. Displayed cell types are the ones with an adjusted p-value < 0.10 after Bonferroni correction, based on a Kruskal-Wallis test. In panels (B) and (C), sample sizes are: IG1 (n=52), IG2 (n=37), IG3 (n=7), and IG4 (n=5). (D) Correlation plot showing gene signatures for 27 selected oncogenic pathways (yellow diamonds) and immune cell infiltrates (green diamonds). Right panels show illustrative scatter plots for pairs of variables with strong positive and negative correlations. White dots in the correlation heatmap highlight pairs of variables with significant two-sided Spearman correlation after Bonferroni correction. Error bands represent 95% confidence intervals. In panels (B) and (C), statistical significance was assessed using a two-sided Mann-Whitney U test. P values were corrected using the Bonferroni method and significant results were denoted as * indicating q <0.05, ** indicating q<0.01, *** indicating q<0.005, and **** indicating q<0.001. Boxplots’ center lines indicate medians, edges indicate the interquartile range, and the whiskers extend to the highest and lowest values not considered outliers.
Extended Data Fig. 7
Extended Data Fig. 7. Validation of immune groups in an independent cohort of LARC tumors from TCGA
Validation of results using an idendepent cohort of 42 LARC samples from TCGA. (A) Unsupervised hierarchical clustering of pMMR/MSS tumors using ssGSEA scores for a set of well established immune signatures reveals three groups with increasing levels of overall immune infiltrate (IG1-IG3). dMMR/MSI tumors were added later as a fourth group (IG4). (B) Tumors in IG4 had higher TMB and had lower FGA than tumors in the IG1-IG3 groups. Sample sizes for each group are as follows: IG1 (n=16), IG2 (n=17), IG3 (n=7), and IG4 (n=2). Boxplots’ center lines indicate medians, edges indicate the interquartile range, and the whiskers extend to the highest and lowest values not considered outliers. (C) Distribution of CMS classes across immune groups. (D) Selected significant differences in ssGSEA scores for specific immune cell types across immune groups. Sample sizes for each group are as follows: IG1 (n=16), IG2 (n=17), IG3 (n=7), and IG4 (n=2). (E) Comparison of expression levels for genes encoding proteins involved in immune checkpoint blockade. Sample sizes for each group are as follows: IG1 (n=16), IG2 (n=17), IG3 (n=7), and IG4 (n=2). In panels (D) and (E), statistical significance was assessed using a two-sided Mann-Whitney U test. P values were corrected using the Bonferroni method and significant results were denoted as * indicating q <0.05, ** indicating q<0.01, *** indicating q<0.005, and **** indicating q<0.001. Boxplots’ center lines indicate medians, edges indicate the interquartile range, and the whiskers extend to the highest and lowest values not considered outliers.
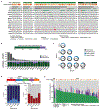
Figure 1.
Figure 1.. The genomic landscape of rectal cancer.
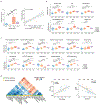
(A) Oncoprint showing the most frequently altered genes in rectal cancer, stratified by pMMR/MSS and POLE/dMMR/MSI patients. Asterisk indicates samples for which the gene was not present on the panel. (B) Bar plots showing frequency of alterations in a set of selected oncogenic signaling pathways. (C) Patterns of co-occurrence and mutual exclusivity at the gene and pathway level. C- and N-Terminal mutations in the APC gene were analyzed separately. Statistical significance was assessed using a two-sided Fisher’s exact test. P values were corrected using the false discovery rate (FDR) method and significant results were denoted as * indicating q <0.1 and *** indicating q<0.05. (D) Fraction of genome altered by copy number changes for TP53 missense/truncating mutations stratified by biallelic inactivation status. Results are shown for 408 MSS cases from the MSK-C cohort that passed quality-control criteria for FACETS analysis. The following groups: wild-type (n=73), TP53 Missense (n=44), TP53 Missense, Biallelic (n=175), TP53 Truncating (n=12), and TP53 Truncating, Biallelic (n=81) were compared using a two-sided Mann-Whitney U test. Significant results were as follows: wild-type vs TP53 Missense, Biallelic p=1.32e-12; wild-type vs TP53 Truncating, Biallelic p=2.826e-10; TP53 Missense vs TP53 Missense, Biallelic p=6.755e-06; TP53 Missense vs TP53 Truncating, Biallelic p=5.762e-05. Boxplots’ center lines indicate medians, edges indicate the interquartile range, and the whiskers extend to the highest and lowest values not considered outliers. (E) Highest level of therapeutic actionability and number of actionable alterations in pMMR/MSS tumors stratified by stage at diagnosis.
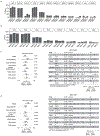
Figure 2.
Figure 2.. Differences in WNT signaling across the rectum.
(A) Frequency of signaling pathway alterations stratified by anatomic location across the rectum. Statistical significance was assessed using a two-sided Fisher’s exact test and p values were corrected for multiple testing using the false discovery rate method, *** indicates q<0.005 and **** indicates q<0.001. Significant results are as follows: WNT pathway, upper rectum (92%) vs lower rectum (77%), q=4.45e-4, and middle rectum (90%) vs lower rectum (77%), q=2.78e-3. (B) Distance to the anal verge by APC status. APC WT (n=113) were compared to APC altered (n=508) using a two-sided Mann-Whitney U test, * indicates p=1.20e-9. Boxplots’ center lines indicate medians, edges indicate the interquartile range, and the whiskers extend to the highest and lowest values not considered outliers. (C) WNT pathway alteration frequencies across the rectum and in a selected set of sequenced anal adenocarcinomas. Asterisk indicates samples for which the gene was not present on the panel. (D) Proportion of biallelic inactivation of APC across the rectum and a curated set of sequenced anal adenocarcinomas. (E) Distribution of APC mutations by genomic location for tumors from the lower, middle, and upper rectum.
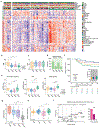
Figure 3.
Figure 3.. Clinical and genomic determinants of response to NAT in LARC.
(A) Overview of clinicopathological features for the LARC patients used for outcome analyses in our study. (B) Distribution of years for beginning of NAT for patients in the TIMING, MSK-R and MSK-C cohorts. (C) Fraction of patients benefiting from OP at the time of last follow-up, stratified by year of NAT initiation. All these patients came from the MSK-R and MSK-C cohorts. (D) Comparison of DFS for the patients in the TIMING, MSK-R, and MSK-C cohorts. Inset shows the fraction of patients with either a pathological complete response (pCR), a clinical complete response (cCR), or a incomplete response (iCR), stratified by cohort. (E) Multivariate analysis of associations between clinical and genomic variables and CR (n=263). Odds ratios and associated p-values were computed using a multivariate logistic regression model that included all of the clinical and genomic variables shown in the panel. Odd ratio values above one are associated with better CR rates.The error bars indicate the 95% confidence interval for each odds ratio. (F) Multivariate analysis of associations between clinical and genomic variables and DFS. Hazard ratios and p-values were computed using a Cox proportional-hazards model that included all of the clinical and genomic variables shown in the panel. Hazard ratios above one are associated with worse DFS. The numbers in brackets and the length of the error bars show the 95% confidence interval for each hazard ratio.
Figure 4.
Figure 4.. Transcriptomic determinants of response to NAT in LARC.
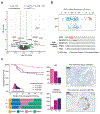
(A) Volcano plot illustrating differentially expressed genes in CR vs. iCR patients. Differential gene expression was conducted using DESeq2 and the p-values computed using the Wald test were corrected for multiple testing using the false discovery rate method. (B) IGF2 expression of CR (n=26) compared to iCR (n=68) patients. All the patients in the high IGF2 expression group (n=12) exhibited iCRs. Also, none of these patients had somatic alterations within the PI3K pathway. Boxplots’ center lines indicate medians, edges indicate the interquartile range, and the whiskers extend to the highest and lowest values not considered outliers. (C) Higher expression of L1CAM was observed in tumors with poor outcomes. T1-T3 labels represent sample stratification by population tertile. A density plot showing the distribution of expression values per tertile is shown as an inset. Expression of L1CAM was negatively correlated with DFS and rate of CR, but positively correlated with rate of distant recurrence. Tumors in the top tertile of L1CAM expression (T3) included a higher fraction of CMS4 specimens. IHC staining of L1CAM in matched pre- and post-treatment samples shows that it can be detected at pre-treatment and that observed levels increase during treatment, as previously reported.
Figure 5.
Figure 5.. Immune profiling identifies a subset of immune hot pMMR/MSS LARC tumors with favorable outcomes from NAT.
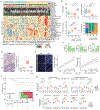
(A) Unsupervised hierarchical clustering of pMMR/MSS tumors using ssGSEA scores for immune signatures reveals three groups with increasing levels of immune infiltrates (IG1-IG3). dMMR/MSI tumors were added later as a fourth group (IG4). (B) Comparison of TMB, FGA, inflammatory response signature and CMS labels for IG1 (n=52), IG2 (n=37), IG3 (n=7), and IG4 (n=5). (C) Mutations in APC and TP53 occurred at lower frequencies in IG3 and IG4 (p=0.008 and p=0.005, respectively; Fisher’s exact test), while mutations in KRAS were less frequent in IG2 (p=0.011). (D) H&E staining of 21 cases shows a higher fraction of inter-tumoral TILs in IG3 (n=6) than IG1 (n=6) (q=0.0288) and IG2 (n=6) (q=0.0288). H&E images illustrate the higher fraction of TILs in a representative IG3 case compared to a representative IG1 case. (E) Levels of CD3 and CD4 quantified by IF staining correlated with RNA-Seq ssGSEA scores for T cells and T helper cells. Statistical significance was assessed based on two-sided Spearman correlation. Error bands show 95% confidence intervals. (F) IG3 and IG4 patients exhibited better DFS and better response rates than IG1 & IG2 patients, although differences were not significant. (G) Selected significant differences in ssGSEA scores for specific immune cell types and oncogenic signaling pathways. (H) Expression levels for genes encoding proteins involved in immune checkpoint blockade. In panels (G) and (H), sample sizes are as follows: IG1 (n=52), IG2 (n=37), IG3 (n=7), and IG4 (n=5). In panels (B), (D), (G) and (H), statistical significance was assessed using a two-sided Mann-Whitney U test. P values were corrected using the Bonferroni method and significant results were denoted as * indicating q <0.05, ** indicating q<0.01, *** indicating q<0.005, and **** indicating q<0.001. Boxplots’ center lines indicate medians, edges indicate the interquartile range, and the whiskers extend to the highest and lowest values not considered outliers.

Similar articles

Cited by

References

    1. Siegel RL, Miller KD, Fuchs HE & Jemal A Cancer Statistics, 2021. CA Cancer J. Clin 71, 7–33 (2021). - PubMed
    1. Saad El Din K et al. Trends in the epidemiology of young-onset colorectal cancer: a worldwide systematic review. BMC Cancer 20, 288 (2020). - PMC - PubMed
    1. Marr R et al. The modern abdominoperineal excision: the next challenge after total mesorectal excision. Ann. Surg 242, 74–82 (2005). - PMC - PubMed
    1. Smith JJ et al. Assessment of a Watch-and-Wait Strategy for Rectal Cancer in Patients With a Complete Response After Neoadjuvant Therapy. JAMA Oncol. 5, e185896 (2019). - PMC - PubMed
    1. Garcia-Aguilar J et al. Preliminary results of the organ preservation of rectal adenocarcinoma (OPRA) trial. JCO 38, 4008–4008 (2020).

Publication types