. 2022 Nov;6(11):1225-1235.
doi: 10.1038/s41551-022-00916-z. Epub 2022 Aug 15.

A wearable electrochemical biosensor for the monitoring of metabolites and nutrients

Affiliations

A wearable electrochemical biosensor for the monitoring of metabolites and nutrients

Minqiang Wang et al. Nat Biomed Eng. 2022 Nov.

Abstract

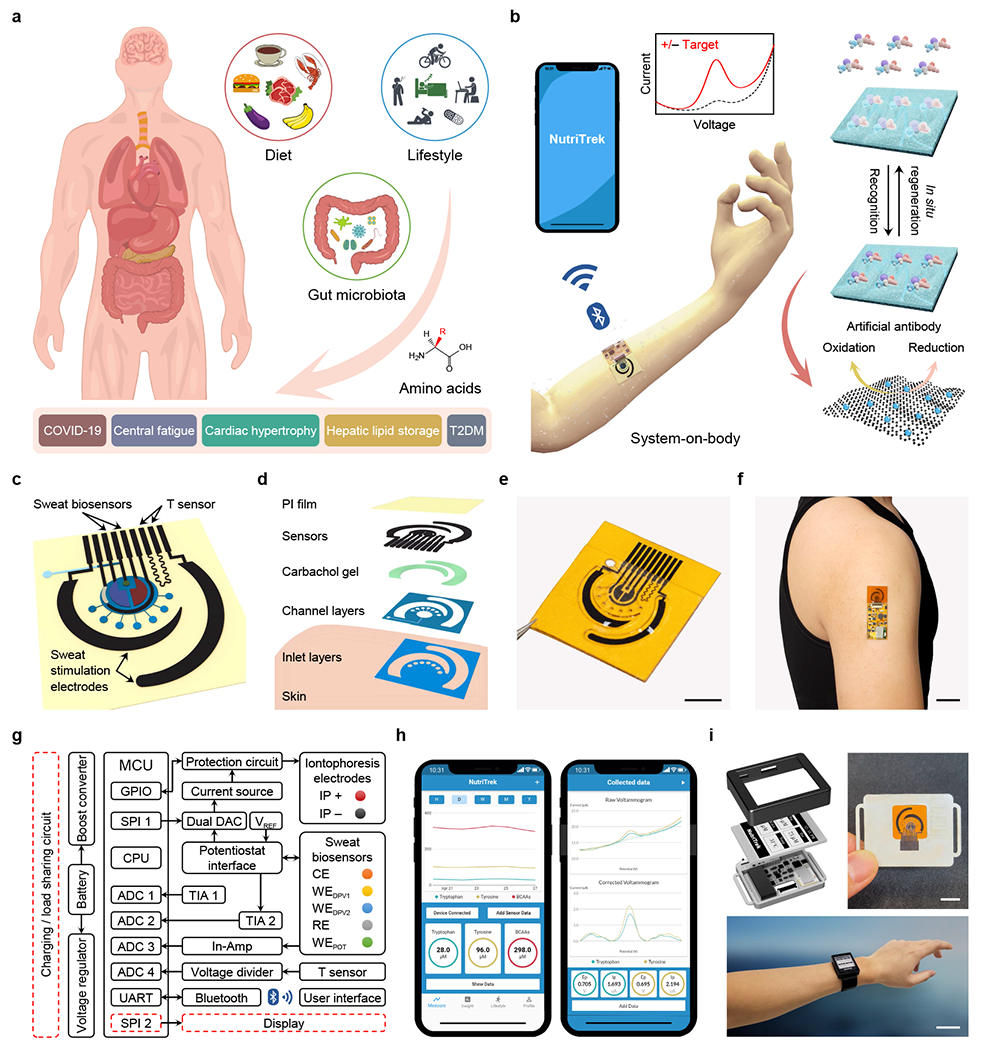
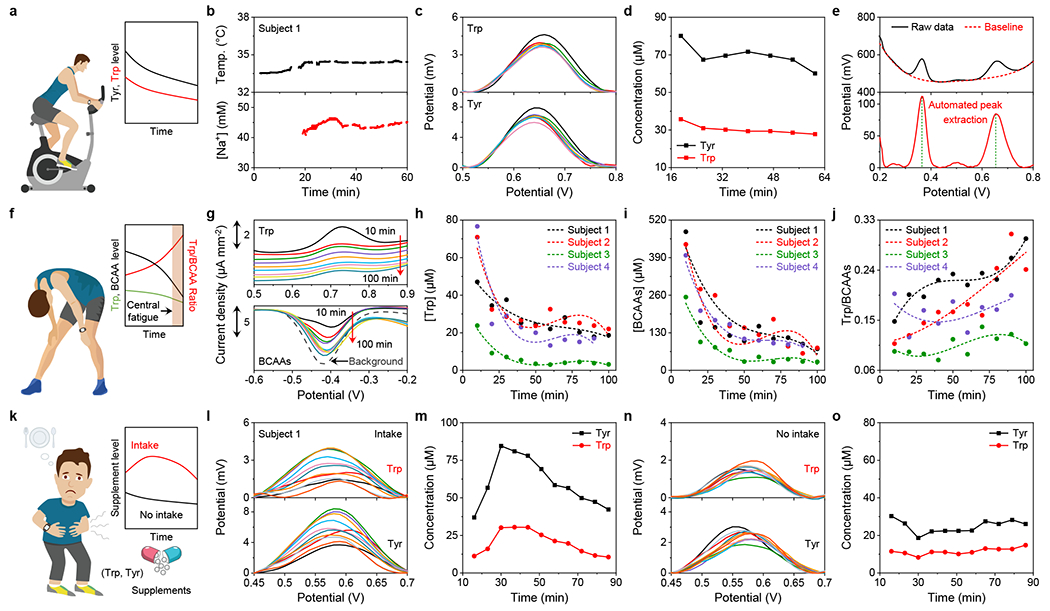
Wearable non-invasive biosensors for the continuous monitoring of metabolites in sweat can detect a few analytes at sufficiently high concentrations, typically during vigorous exercise so as to generate sufficient quantity of the biofluid. Here we report the design and performance of a wearable electrochemical biosensor for the continuous analysis, in sweat during physical exercise and at rest, of trace levels of multiple metabolites and nutrients, including all essential amino acids and vitamins. The biosensor consists of graphene electrodes that can be repeatedly regenerated in situ, functionalized with metabolite-specific antibody-like molecularly imprinted polymers and redox-active reporter nanoparticles, and integrated with modules for iontophoresis-based sweat induction, microfluidic sweat sampling, signal processing and calibration, and wireless communication. In volunteers, the biosensor enabled the real-time monitoring of the intake of amino acids and their levels during physical exercise, as well as the assessment of the risk of metabolic syndrome (by correlating amino acid levels in serum and sweat). The monitoring of metabolites for the early identification of abnormal health conditions could facilitate applications in precision nutrition.


Conflict of interest statement

Competing interests

The authors declare no competing interests.

Figures

Fig. 1 |
Fig. 1 |. Schematics and images of the wearable biosensor ‘NutriTrek’.
a, Circulating nutrients such as amino acids are associated with various physiological and metabolic conditions. b, Schematic of the wearable ‘NutriTrek’ that enables metabolic monitoring through a synergistic fusion of laser-engraved graphene, redox-active nanoreporters, and artificial. c,d, Schematic (c) and layer assembly (d) of the microfluidic ‘NutriTrek’ patch for sweat induction, sampling, and biosensing. T, temperature; PI, polyimide. e,f, Images of a flexible sensor patch (e) and a skin-interfaced wearable system (f). Scale bars, 5 mm (e) and 2 cm (f). g, Block diagram of electronic system of ‘NutriTrek’. The modules outlined in red dashes are included in the smartwatch version. ADC, analog-to-digital converter; DAC, digital-to-analog converter; CPU, central processing unit; GPIO, general-purpose input/output; POT, potentiometry; In-Amp, instrumentation amplifier; MCU, microcontroller; SPI, serial peripheral interface; TIA, transimpedance amplifier; UART, universal asynchronous receiver-transmitter; IP, iontophoresis; CE, counter electrode; RE, reference electrode; WE, working electrode; DPV, differential pulse voltammetry. h, Custom mobile application for real-time metabolic and nutritional tracking. i, ‘NutriTrek’ smartwatch with a disposable sensor patch and an electrophoretic display. Scale bars, 1 cm (top) and 5 cm (bottom).
Fig. 2 |
Fig. 2 |. Schematics and characterizations of the LEG-MIP sensors.
a, Direct detection of electroactive molecules using LEG-MIP sensors. b,c, DPV voltammograms of the LEG-MIP sensors for direct Tyr (b) and Trp (c) detection. Insets, the calibration plots with a linear fit. ∆J, peak height current density. d, In situ continuous sensing and regeneration of an LEG-MIP Trp sensor in 50 μM Trp. e, Indirect molecular detection using LEG-RAR-MIP sensors. f, LSV voltammograms of indirect Leu detection with LEG-PBNP-MIP sensors. Inset, the calibration plot with a linear fit. g,h, Indirect detection of all essential AAs (g) and multiple vitamins, lipids, and metabolites (h) using LEG-PBNP-MIP sensors. Dashed lines represent linear fit trendlines. i, Schematic of multi-MIP AA sensors. j, LSV voltammograms of a LEG multi-MIP sensor for BCAA quantification. Inset, the calibration plot with a linear fit. k, In situ continuous sensing and regeneration of an LEG-PBNP-MIP Leu sensor in 50 μM Leu. l, Repetitive CV scans of an LEG-PBNP electrode in 0.1 M KCl. m, DPV voltammograms of indirect Leu detection with LEG-AQCA-MIP sensors. Inset, the calibration plot. n, In situ regeneration of an LEG-AQCA-MIP Leu sensor in a raw sweat sample. o, Selectivity of the Trp, Tyr, Leu, Ile, Val, and BCAA sensors against other AAs. p, Validation of Tyr, Trp, and Leu sensors for analyzing raw exercise sweat samples (n=20) against GC-MS. All error bars represent the s.d. from 3 sensors.
Fig. 3 |
Fig. 3 |. Wearable system design for autonomous sweat induction, sampling, analysis, and calibration.
a, Illustration of a multifunctional wearable sensor patch. b–d, The two-scan sensor calibration strategy enabling selective Trp sensing in situ in the presence of Tyr. ∆I, peak height current; ∆I’, peak height difference caused by target recognition. Solid and dashed curves in c,d represent linear fit trendlines. e, Electrolyte calibration of the AA sensor reading, with a linear fit. f, Schematic of localized sweat sampling based on iontophoretic sweat extraction with muscarinic agents: pilocarpine and carbachol. g,h, Localized sweat rates measured from the stimulated (g) and surrounding (h) skin areas after a 5-min iontophoresis with pilocarpine and carbachol. Solid and dashed curves represent quadratic fit trendlines. S, subject. i, Numerically simulated [Trp] distributions in the microfluidic reservoir at 120 s after the inlet fluid changed from 20 to 80 μM Trp (flow rate, 1.5 μL min−1) (with varied designs in inlet number, angle span, inlet and outlet orientation). j, On-body evaluation of the optimized flexible microfluidic patch for efficient carbachol-based iontophoretic sweat induction and surrounding sampling at rest. Timestamps represent the period (min) after a 5-min iontophoresis session. Black dye was used in the reservoir to facilitate the direct visualization of sweat flow in the microfluidics. Scale bar, 3 mm.
Fig. 4 |
Fig. 4 |. Wearable system evaluation across activities toward prolonged physiological and nutritional monitoring.
a–d, Continuous on-body Trp and Tyr analysis using a wearable sensor array with real-time sensor calibrations during cycling exercise. e, Custom voltammogram analysis with an automatic peak extraction strategy based on a polynomial fitting and cut-off procedure. f–j, Dynamic sweat Trp and BCAA analysis during physical exercise toward central fatigue monitoring. Dashed lines in hj represent quadratic fit trendlines. k–o, Dynamic analysis of sweat AA levels with and without Trp and Tyr supplement intake at rest toward personalized nutritional monitoring.
Fig. 5 |
Fig. 5 |. Personalized monitoring of metabolic syndrome risk factors using the LEG-MIP BCAA sensors.
a, Elevated BCAA levels identified in individuals with obesity and/or T2DM. b, The close associations between BCAA metabolism and insulin response in healthy and obesity/T2DM groups. c, Correlation of serum and sweat total BCAA and Leu levels obtained with the LEG-MIP sensors (n=65). Dashed lines represent linear fit trendlines. d, Box-and-whisker plot of measured Leu levels in iontophoresis-extracted sweat and serum in three groups of participants: normal weight (Group I, n=10), overweight or obesity (Group II, n=7), and obesity with T2DM (Group III, n=3), The bottom whisker represents the minima; the top whisker represents the maxima; and the square in the box represents the mean. e,f, Dynamic changes of sweat Leu and total BCAAs, serum insulin (Ins), and blood glucose (BG) levels from two healthy subjects with 5 g BCAAs (e) and a standard protein diet (f) intakes. g, Sweat Leu dynamics collected from Groups I–III after the 5 g BCAAs intake. Inset, the ratio of the Leu level at 50-min after BCAA intake and the level before intake. h, Evaluation of Leu as a metabolic fingerprint for COVID-19 severity in serum samples from COVID-19 negative subjects (n=8) and COVID-19 positive patients (n=8). Error bars represent the s.d. from 3 measurements.

Similar articles

Cited by

References

    1. Trumbo P, Schlicker S, Yates AA & Poos M Dietary reference intakes for energy, carbohydrate, fiber, fat, fatty acids, cholesterol, protein and amino acids. J. Am. Diet. Assoc 102, 1621–1630 (2002). - PubMed
    1. Wu G Amino acids: metabolism, functions, and nutrition. Amino Acids 37, 1–17 (2009). - PubMed
    1. Lynch CJ & Adams SH Branched-chain amino acids in metabolic signalling and insulin resistance. Nat. Rev. Endocrinol 10, 723–736 (2014). - PMC - PubMed
    1. Wang TJ et al. Metabolite profiles and the risk of developing diabetes. Nat. Med 17, 448–453 (2011). - PMC - PubMed
    1. Mayers JR et al. Elevation of circulating branched-chain amino acids is an early event in human pancreatic adenocarcinoma development. Nat. Med 20, 1193–1198 (2014). - PMC - PubMed

Publication types