. 2022 Nov;395(11):1419-1440.
doi: 10.1007/s00210-022-02281-9. Epub 2022 Aug 16.

Poisoning cases in the German crime series Tatort (crime scene) from 1974 to 2022

Affiliations

Poisoning cases in the German crime series Tatort (crime scene) from 1974 to 2022

Rachel Ellerbeck et al. Naunyn Schmiedebergs Arch Pharmacol. 2022 Nov.

Abstract

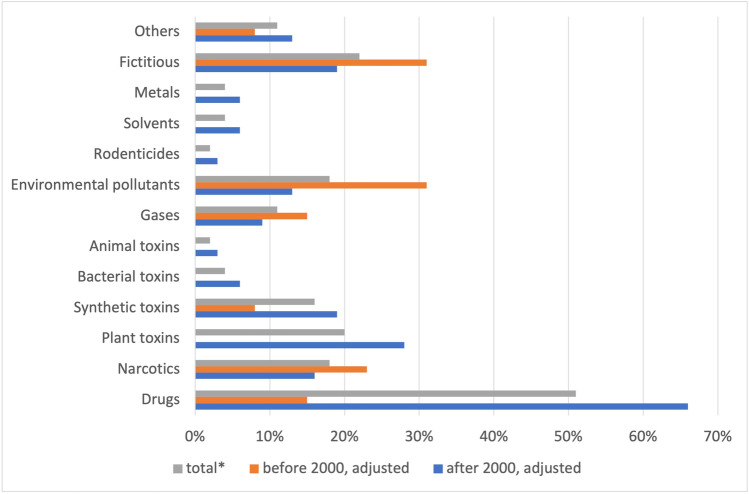
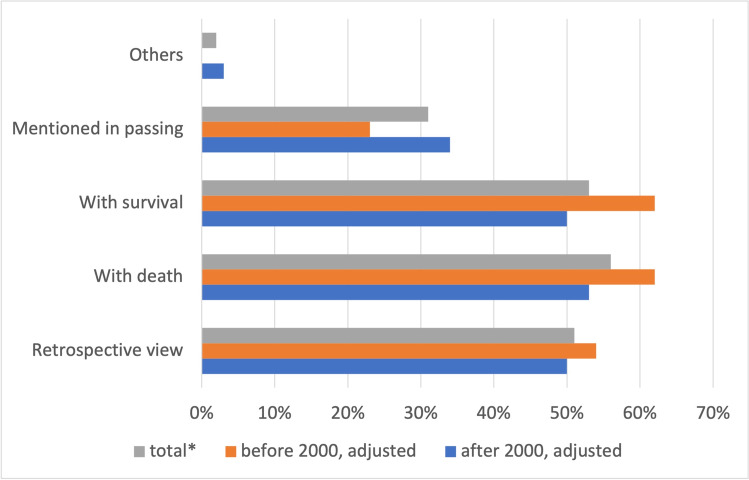
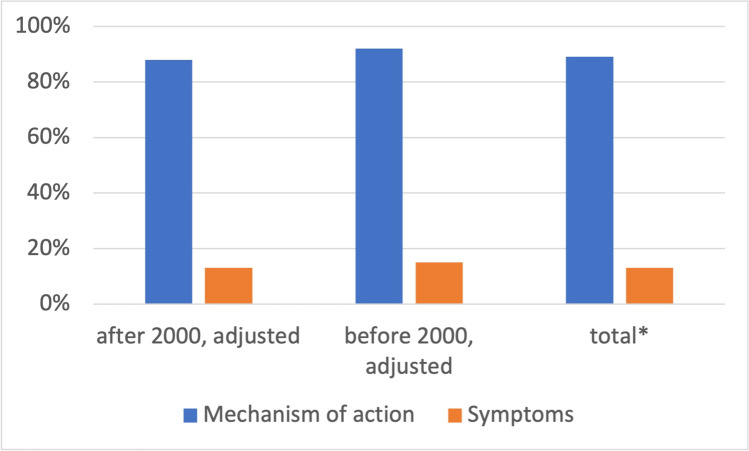
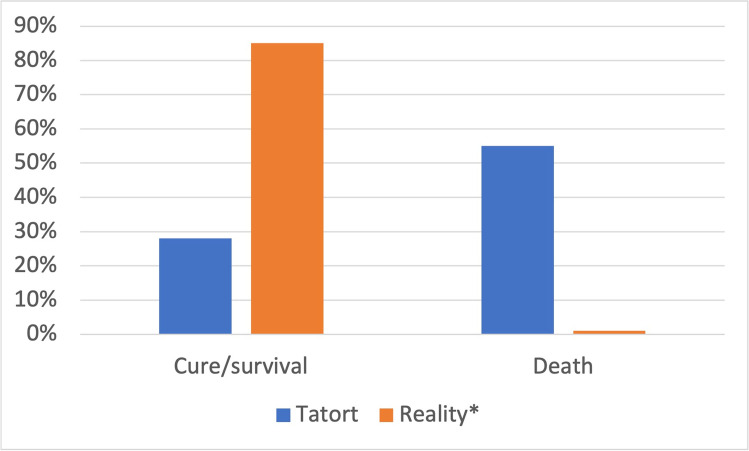
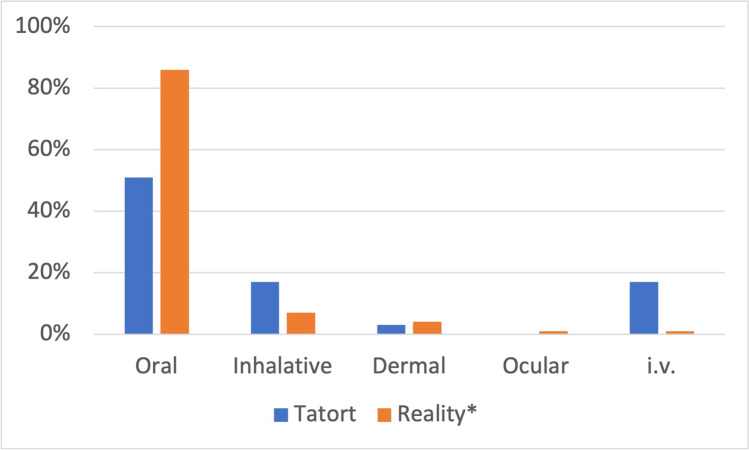
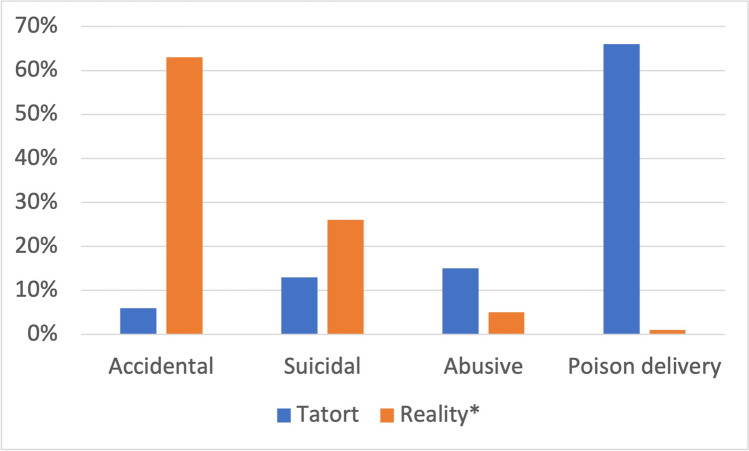
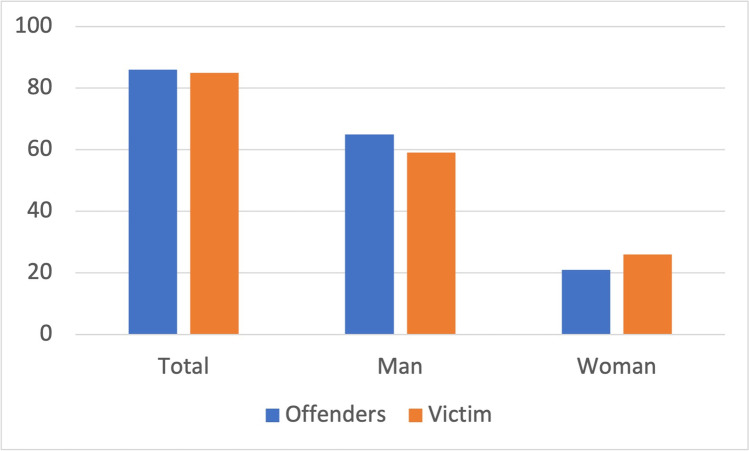
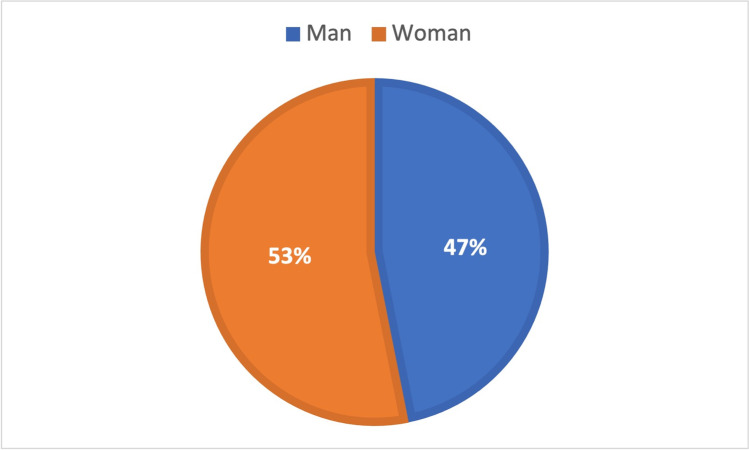
Poisoning occurs frequently in TV crime series but, to the best of our knowledge, has not yet been analyzed scientifically. This study examines the plausibility of poisoning cases in Germany's most popular crime series, Tatort (crime scene), from 1974 to 2022. In the TV series, the increasing rate of poisoning in Germany as well as the increasing variety of substances leading to poisoning over the years are depicted. Largely in line with reality, similar substance categories and routes of administration are presented. However, poisoning outcomes in Tatort differ from reality: over 50% of the victims die in Tatort, whereas in reality, more than 80% survive. In > 95% of the episodes, the mechanism of action of a poison is not explained, omitting an important opportunity for raising public awareness. The TV series also deviates from reality in terms of the etiology of poisonings: External poison delivery is largely overrepresented, while the high rate of accidental poisonings in real life is underrepresented. Almost no accidental poisonings occur in Tatort, although this is the most frequent type of poisoning in real life. In Tatort, men are overrepresented as offenders and victims of poisoning compared to reality. Thus, the crime series does not convey the message that anyone can be a potential victim of poisoning and that particularly vulnerable groups need proper education and the best possible protection. This paper discusses the conflict between detailed, plausible episodes with cases of poisoning and the potential for imitation that they may cause.

Keywords: Drugs; Fiction–reality comparison; Poisoning; Public awareness; Tatort (crime scene).


Conflict of interest statement

The authors declare no competing interests.

Figures

Fig. 1
Fig. 1
Statistical procedure for analyzing individual Tatort episodes, shown in a flowchart
Fig. 2
Fig. 2
Substance categories involved in poisoning. Shown is a bar chart, where the total value (*percentage value of all episodes) is grey, the value before 2000 is orange, and the value after 2000 is blue. Table 1 provides details on the poisoning cases
Fig. 3
Fig. 3
Naming of substances involved in poisoning. Shown is a bar chart, where the total value (*percentage value of all episodes) is grey, the value before 2000 is orange, and the value after 2000 is blue
Fig. 4
Fig. 4
Presentation and outcome of poisoning. Shown is a bar chart, where the total value (*percentage value of all episodes) is grey, the value before 2000 is orange, and the value after 2000 is blue
Fig. 5
Fig. 5
Application of poisons. Shown is a bar chart, where the total value (*percentage value of all episodes) is grey, the value before 2000 is orange, and the value after 2000 is blue
Fig. 6
Fig. 6
Substance presentations involved in poisoning. Shown in a bar chart, where the total value (*percentage value of all episodes) is grey, the value before 2000 is orange, and the value after 2000 is blue
Fig. 7
Fig. 7
Etiology of poisoning. Shown is a bar chart, where the total value (*percentage value of all episodes) is grey, the value before 2000 is orange, and the value after 2000 is blue
Fig. 8
Fig. 8
Substances repeatedly involved in poisoning. Shown in a bar chart, where the value before 2000 is orange, the value after 2000 is blue and the total value (percentage value of all episodes) is grey
Fig. 9
Fig. 9
Ratings of episodes showing poisoning. Shown is a bar chart, where the value for the best episodes is blue and that for the weakest episodes is orange
Fig. 10
Fig. 10
Missing information on mechanism of action and symptoms in poisonings. Shown is a bar chart, where the value for the mechanism of action is blue and that for symptoms is orange
Fig. 11
Fig. 11
Fiction-reality comparison of substance categories involved in poisoning, *mean real-life values for intentional and accidental poisonings from 2000 to 2008, and *mean real-life values for all poisonings in 2011 + 2021. Shown is a bar graph, with Tatort values in blue, real-life accidental poisonings in grey, real-life intentional poisonings in orange, and all poisonings in 2011 + 2021 in yellow
Fig. 12
Fig. 12
Fiction-reality comparison of poisoning outcomes using total values from Tatort and *mean real-life values from 2000 to 2007. Shown is a bar chart, where the value for Tatort is blue and that for reality is orange
Fig. 13
Fig. 13
Fiction–reality comparison of the application using the total values from Tatort and the *mean reality values from 2000 to 2008 and 2011. Shown is a bar chart, with values for Tatort in blue and values for reality in orange
Fig. 14
Fig. 14
Fiction-reality comparison of etiology using total values from Tatort and *mean reality values from 2000 to 2008 and 2011. Shown is a bar chart, where the values for Tatort are blue and those for reality are orange
Fig. 15
Fig. 15
Gender analysis from Tatort. Shown is a bar chart, where the values for offenders are blue and those for victims are orange
Fig. 16
Fig. 16
Gender in general poisoning with data from GIZ. Shown is a pie chart, where the value for men is blue and the one for women is orange
Fig. 17
Fig. 17
Gender in criminal cases involving poisoning. Shown is a bar chart, where the value for offenders are blue and those for victims are orange. Data are based on Fuhrmeister (2005)

Similar articles

Cited by

References

    1. Agthe A (Director) (2002) Bienzle und der süße Tod [Film] SWR 505
    1. Aktories K, Förstermann U, Hofmann FB, Starke K. Muscarinrezeptor-Antagonisten. In: Forth W, Henschler D, Rummel W, editors. Allgemeine und spezielle Pharmakologie und Toxikologie. 11. München: Urban & Fischer Verlag/Elsevier GmbH; 2013. p. 132.
    1. Aktories K, Förstermann U, Hofmann FB, Starke K. Psychopharmaka-Pharmakotherapie psychischer Erkrankungen. In: Forth W, Henschler D, Rummel W, editors. Allgemeine und spezielle Pharmakologie und Toxikologie. 11. München: Urban & Fischer Verlag/Elsevier GmbH; 2013. p. 294.
    1. Aktories K, Förstermann U, Hofmann FB, Starke K. Pharmakotherapie der Herzinsuffizienz. In: Forth W, Henschler D, Rummel W, editors. Allgemeine und spezielle Pharmakologie und Toxikologie. 11. München: Urban & Fischer Verlag/Elsevier GmbH; 2013. p. 414.
    1. Aktories K, Förstermann U, Hofmann FB, Starke K. Chemische Kanzerogenese. In: Forth W, Henschler D, Rummel W, editors. Allgemeine und spezielle Pharmakologie und Toxikologie. 11. München: Urban & Fischer Verlag/Elsevier GmbH; 2013. p. 1005f.

LinkOut - more resources