. 2022 Aug 15;13(1):4771.
doi: 10.1038/s41467-022-32462-2.

Sirt2 promotes white matter oligodendrogenesis during development and in models of neonatal hypoxia

Affiliations

Sirt2 promotes white matter oligodendrogenesis during development and in models of neonatal hypoxia

Beata Jablonska et al. Nat Commun. .

Abstract

Delayed oligodendrocyte (OL) maturation caused by hypoxia (Hx)-induced neonatal brain injury results in hypomyelination and leads to neurological disabilities. Previously, we characterized Sirt1 as a crucial regulator of OL progenitor cell (OPC) proliferation in response to Hx. We now identify Sirt2 as a critical promoter of OL differentiation during both normal white matter development and in a mouse model of Hx. Importantly, we find that Hx reduces Sirt2 expression in mature OLs and that Sirt2 overexpression in OPCs restores mature OL populations. Reduced numbers of Sirt2+ OLs were also observed in the white matter of preterm human infants. We show that Sirt2 interacts with p27Kip1/FoxO1, p21Cip1/Cdk4, and Cdk5 pathways, and that these interactions are altered by Hx. Furthermore, Hx induces nuclear translocation of Sirt2 in OPCs where it binds several genomic targets. Overall, these results indicate that a balance of Sirt1 and Sirt2 activity is required for developmental oligodendrogenesis, and that these proteins represent potential targets for promoting repair following white matter injury.


Conflict of interest statement

The authors declare no competing interests.

Figures

Fig. 1
Fig. 1. Hx reduces Sirt2 expression in mature WM OLs.
a Representative western blots for Sirt2 and Sirt1 proteins in subcortical WM of Nx and Hx animals at postnatal days P11, P18, and P45. b Quantification of western blots. Graph displays mean ± SEM values (n = 3 brains per condition). At P11: Sirt1 ns p = 0.04793, Sirt2 *p = 0.0108; at P18: Sirt1 **p = 0.0044, Sirt2 ****p < 0.0001; at P45: Sirt1 ns p = 0.2347, Sirt2 **p = 0.0033 (Student’s t test). c, f, i, l, o Coronal sections of subcortical WM stained for Sirt2+ c, Sirt2+Olig2+ f, Sirt2+NG2+ i, Sirt2+PDGFRα+ l, and CC1+Sirt2+ o cells in Nx and Hx mice at P18. Dotted lines delineate WM. WM, white matter. Arrows point to nuclear Sirt2+ staining. Scale bar = 100 µm. d, e Quantification of the total Sirt2+ cell density d and percentage of Sirt2+ cells e in WM at P18 (****p < 0.0001 for d, e, n = 4 mice per group, Student’s t test). g, h Quantification of the total Olig2+Sirt2+ cell density (****p < 0.0001, n = 4 Nx and 5 Hx mice, Student’s t test) g and percentage of Sirt2+ OL lineage cells (***p = 0.0003, n = 4 Nx and 5 Hx mice, Student’s t test) h in WM at P18. j, k Quantification of the total NG2+Sirt2+ cell density (ns p = 0.9543, n = 4 per group, Student’s t test) j and percentage of Sirt2 expression in NG2+ OPCs in WM at P18 (ns p = 0.7479, n = 4 per group, Student’s t test) k. m, n Quantification of total PDGFRα+Sirt2+ cell density (ns p = 0.7748, n = 5 Nx and 4 Hx mice, Student’s t test) m and percentage of Sirt2 expression in PDGFRα+ OPCs (ns p = 0.9960, n = 5 Nx and 4 Hx mice, Student’s t test) n. p, q Quantification of the total CC1+Sirt2+ cell density (***p = 0.0004, n = 4 per group, Student’s t test) p and percentage of Sirt2+ mature CC1+-expressing OLs (**p = 0.0025, n = 4 per group, Student’s t test) q in WM at P18. Graphs display mean ± SEM values. All statistical tests are two-sided. Source data are provided as a Source Data file.
Fig. 2
Fig. 2. Reduced Sirt2 expression in subcortical WM of preterm infants.
a Tissue sections from the corpus callosum of preterm human neonates and term controls were analyzed. H&E image shows lower magnification of corpus callosum region analyzed for preterm and term controls. Scale bar = 100 µm. b Representative H&E photomicrographs of corpus callosum (n = 4 term and 4 preterm). In term controls, well-defined OLs with well-defined nucleolus (arrow) and dense neuropil were observed (arrowhead). In contrast, in preterm neonates (right panels) hypodense and rarefied neuropil were present (arrowhead) with OLs that appear edematous and vacuolated (arrow). Scale bars = 50 µm for upper panels and 20 µm for lower panels. c Olig2+ immunostaining (green) in WM of term and preterm neonates. Scale bars = 50 µm. d, e Quantification of the density d and the percentage of Olig2+ cells e in term and preterm neonates. (**p = 0.005, *p = 0.026, n = 4 term and 3 preterm, Student’s t test). f Low magnification images of Sirt2+ immunostaining (red) in WM of term and preterm neonates. Scale bars = 50 µm. g Quantification of the intensity of Sirt2 staining in term and preterm neonates (*p = 0.017, n = 4 term and 3 preterm, Student’s t test). h Quantification of the percent area of Sirt2+ signal in the WM of term and preterm neonates (*p = 0.014, n = 4 term and 3 preterm, Student’s t test). i Sirt2 expression within WM Olig2+ cells of term and preterm neonates. Bottom panels show magnified single-channel images for Olig2 (green) and Sirt2 (red) to highlight cytoplasmic localization of Sirt2. Scale bars = 10 µm. j Quantification of the density of Sirt2+Olig2+ cells in term and preterm neonates (*p = 0.01, n = 4 term and 3 preterm, Student’s t test). k Quantification of the percentage of Sirt2+ oligodendrocytes in term and preterm neonates (*p = 0.011, n = 4 term and 3 preterm, Student’s t test). H&E, Hematoxylin and Eosin. Data are represented as mean ± SEM. All statistical tests are two-sided. Source data are provided as a Source Data file. The human brain schematic in a was created using Servier Medical Art templates, which are licensed under a Creative Commons Attribution 3.0 Unported License.
Fig. 3
Fig. 3. Sirt2 overexpression alters oligodendrogenesis in vivo.
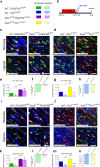
a, b Experimental approach for genetic Sirt2 overexpression in PDGFRα+ OPCs or PLP+ mature OLs in combination with Hx paradigm. c, d Coronal sections of subcortical WM stained for CC1 from Sirt2STOPPDGFRαCreERT c and Sirt2STOPPLPCreERT d transgenic mice, with respective controls, after Nx and Hx. White lines delineate WM. WM, white matter. e, g Quantification of the total CC1+ cell density in WM at P18 (WT: Nx vs Hx *p = 0.0433, Sirt2STOPPDGFRαCreERT: Nx vs Hx ***p = 0.0005, WT Nx vs Sirt2STOPPDGFRαCreERT Nx ****p < 0.0001, WT Hx vs Sirt2STOPPDGFRαCreERT Hx **p = 0.0031, n = 4 WT-Nx, 3 WT-Hx, 3 Sirt2STOP-Nx, 3 Sirt2STOP-Hx mice, ANOVA with Tukey’s multiple comparisons adjustment) e, and (WT: Nx vs Hx *p = 0.0491, Sirt2STOPPLPCreERT: Nx vs Hx ***p = 0.0002, WT Nx vs Sirt2STOPPLPCreERT Nx *p = 0.0176, WT Hx vs Sirt2STOPPLPCreERT Hx ns = 0.8791, n = 3 WT-Nx, 4 WT-Hx, 4 Sirt2STOP-Nx, 4 Sirt2STOP-Hx mice, ANOVA with Tukey’s multiple comparisons adjustment) g. i, j Coronal sections of subcortical WM stained for Olig2 from Sirt2STOPPDGFRαCreERT i and Sirt2STOPPLPCreERT j transgenic mice, with respective controls, after Nx and Hx. Scale bar = 100 µm. k, m Quantification of the total Olig2+ cell density in WM at P18 (WT: Nx vs Hx ***p = 0.0002, Sirt2STOPPDGFRαCreERT: Nx vs Hx ***p = 0.0001, WT Nx vs Sirt2STOPPDGFRαCreERT Nx *p = 0.0263, WT Hx vs Sirt2STOPPDGFRαCreERT Hx *p = 0.0357, n = 3 WT-Nx, 4 WT-Hx, 4 Sirt2STOP-Nx, 3 Sirt2STOP-Hx mice, ANOVA with Tukey’s multiple comparisons adjustment) k, and (WT: Nx vs Hx *p = 0.0219, Sirt2STOPPLPCreERT: Nx vs Hx ****p < 0.0001, WT Nx vs Sirt2STOPPLPCreERT Nx ****p < 0.0001, WT Hx vs Sirt2STOPPLPCreERT Hx ns = 0.8177, n = 3 WT-Nx, 3 WT-Hx, 4 Sirt2STOP-Nx, 3 Sirt2STOP-Hx mice, ANOVA with Tukey’s multiple comparisons adjustment) m. f, h, l, n Quantification of the percent of reduction of CC1+ and Olig2+ cells after Hx in each transgenic mouse strain. No changes were found in percent of CC1+ and Olig2+ cell reduction in WM of Sirt2STOPPDGFRαCreERT or Sirt2STOPPLPCreERT and their WT littermates. All graphs display mean ± SEM values, except for percent reduction. All statistical tests are two-sided. Source data are provided as a Source Data file.
Fig. 4
Fig. 4. Sirt2+ OLs are protected from Hx only in Sirt2STOPPDGFRαCreERT mice.
a Color legend for different transgenic mice in Nx and Hx. b Experimental Hx paradigm. c, d Coronal sections of subcortical WM stained for CC1 and Sirt2 from Sirt2STOPPDGFRαCreERT c and Sirt2STOPPLPCreERT d transgenic mice, with respective controls, after Nx and Hx. White lines delineate WM, WM-white matter. Scale bar = 100 µm. e, g Quantification of the total CC1+Sirt2+ cell density in WM at P18 (WT: Nx vs Hx **p = 0.0037, Sirt2STOPPDGFRαCreERT: Nx vs Hx ns = 0.3774, WT Nx vs Sirt2STOPPDGFRαCreERT Nx ***p = 0.0002, WT Hx vs Sirt2STOPPDGFRαCreERT Hx ****p < 0.0001, n = 4 WT-Nx, 4 WT-Hx, 3 Sirt2STOP-Nx, 3 Sirt2STOP-Hx mice, ANOVA with Tukey’s multiple comparisons adjustment) e, and (WT: Nx vs Hx *p = 0.0220, Sirt2STOPPLPCreERT: Nx vs Hx ***p = 0.0002, WT Nx vs Sirt2STOPPLPCreERT Nx *p = 0.0104, WT Hx vs Sirt2STOPPLPCreERT Hx ns = 0.5991, n = 3 WT-Nx, 4 WT-Hx, 4 Sirt2STOP-Nx, 4 Sirt2STOP-Hx mice, ANOVA with Tukey’s multiple comparisons adjustment) g. i, j Coronal sections of subcortical WM stained for Olig2 and Sirt2 from Sirt2STOPPDGFRαCreERT i and Sirt2STOPPLPCreERT j transgenic mice, with respective controls, after Nx and Hx. Scale bar = 100 µm. k, m Quantification of the total Olig2+Sirt2+ cell density in WM at P18 (WT: Nx vs Hx *p = =0.0415, Sirt2STOPPDGFRαCreERT: Nx vs Hx ns = 0.3589, WT Nx vs Sirt2STOPPDGFRαCreERT Nx ***p = 0.0001, WT Hx vs Sirt2STOPPDGFRαCreERT Hx ****p < 0.0001, n = 3 WT-Nx, 4 WT-Hx, 4 Sirt2STOP-Nx, 3 Sirt2STOP-Hx mice, ANOVA with Tukey’s multiple comparisons adjustment) k, and (WT: Nx vs Hx ****p < 0.001, Sirt2STOPPLPCreERT: Nx vs Hx ****p = 0.0001, WT Nx vs Sirt2STOPPLPCreERT Nx ***p = 0.0009 WT Hx vs Sirt2STOPPLPCreER Hx ns = 0.9780, n = 3 WT-Nx, 3 WT-Hx, 4 Sirt2STOP-Nx, 3 Sirt2STOP-Hx mice, ANOVA with Tukey’s multiple comparisons adjustment) m. f, h, l, n Quantification of the percent of reduction of CC1+Sirt2+ and Olig2+Sirt2+ cells after Hx in each transgenic mouse strain. Changes in the percentage of CC1+Sirt2+ and Olig2+Sirt2+ cell reduction after Hx were found only in WM of Sirt2STOPPDGFRαCreERT, but not Sirt2STOPPLPCreERT mice. All graphs display mean ± SEM values, except for percent reduction. All statistical tests are two-sided. Source data are provided as a Source Data file.
Fig. 5
Fig. 5. Hx increases the interaction of Sirt2 with FoxO1 and p27Kip1 in WM.
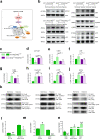
a Cartoon depicting the FoxO1/p27Kip1 pathway regulated by Sirt2. b Color legend for different transgenic mice in Nx and Hx. c Western blots for expression of phosphorylated Sirt2 at Ser331, p27Kip1, and FoxO1 proteins in WM lysates of Sirt2STOPPDGFRαCreERT mice and their WT littermates. df Quantification of protein levels of pSirt2 d, p27Kip1 e, and FoxO1 f in Nx and Hx WM of WT and Sirt2STOPPDGFRαCreERT mice (pSirt2: **p = 0.0064, *p = 0.0428, ***p = 0.0002; p27Kip1: Nx vs Hx *p = 0.0200, Hx vs Hx *p = 0.0168; FoxO1: Nx vs Hx ***p = 0.0009, Hx vs Hx ***p = 0.0004; n = 3 per group, ANOVA with Tukey’s multiple comparisons adjustment). Graphs display mean ± SEM values. g Co-immunoprecipitation of dissected WM with Sirt2 antibody followed by Western blot for p27Kip1 and FoxO1, respectively to detect Sirt2 protein interactions. Protein complexes were identified by their sizes (27KD and 78-82KD, respectively). i Western blots for acetyl lysine levels of p27Kip1 and FoxO1 proteins. h, j Quantification of co-immunoprecipitation results for Sirt2/p27Kip1 (**p = 0.0054), Sirt2/FoxO1 (***p = 0.0003) h, acetyl lysine p27Kip1 (****p < 0.0001), acetyl lysine FoxO1 (***p = 0.0005), j (n = 5 Nx and Hx brains for Sirt2/p27, 6 Nx and Hx brains for Sirt2/Foxo1, 6 Nx and Hx brains for p27 acetyl, 4 Nx and Hx brains for Foxo1 acetyl, all Student’s t tests). Graphs display mean ± SEM values. All statistical tests are two-sided. Source data are provided as a Source Data file.
Fig. 6
Fig. 6. Sirt2 interacts with p21Cip1 and Cdk5.
a Cartoon depicting cell cycle regulation by p21Cip1, Cdk4/CyclinD1, and Cdk5/p35. b Expression of p21Cip1, Cdk5, p35, Cdk4, CyclinD1, p107, and E2F4 in Nx and Hx WM of WT-PDGFRαCreERT and Sirt2STOPPDGFRαCreERT. c Color legend for different transgenic mice in Nx and Hx. dj Quantification of protein levels of p21Cip1 (WT Nx vs Hx ***p = 0.0001, WT Hx vs Sirt2STOP Nx ***p = 0.0001, WT Hx vs Sirt2STOP Hx ****p < 0.0001) d, Cdk5 (WT Nx vs Hx **p = 0.0076, WT Hx vs Sirt2STOP Nx **p = 0.0068, WT Hx vs Sirt2STOP Hx **p = 0.0068) e, p35 (WT Nx vs Hx *p = 0.0193, WT Hx vs Sirt2STOP Nx *p = 0.0106, WT Hx vs Sirt2STOP Hx **p = 0.0077) f, Cdk4 (*p = 0.0292) g, CyclinD1 (*p = 0.0243) h, p107 (***p = 0.0005) i, and E2F4 (***p = 0.0002) j in WT-PDGFRαCreERT and Sirt2STOPPDGFRαCreERT mice (n = 3 per group, all ANOVA test with Tukey’s multiple comparisons adjustment). Graphs display mean ± SEM values. k Co-immunoprecipitation of: Sirt2/p21Cip1 and acetyl-lysine p21Cip1, Cdk4/CyclinD1 and p107/E2F, Sirt2/Cdk5, acetyl-lysine Cdk5, and Cdk5/p35 complexes from Nx and Hx WM. Protein complexes were identified by their sizes (p21Cip1−21kDa, Cdk4-34kDa, Cdk5-35kDa, CyclinD1-36kDa, p35-28kDa, p107-121kDa, E2F4-62kDa, respectively) ln Quantification of co-immunoprecipitation results for Sirt2/p21Cip1 (**p = 0.0097), acetyl lysine p21Cip1 (*p = 0.0190) l, Cdk4/cyclinD1 (*p = 0.0138), p107/E2F4 (**p = 0.023) m, Sirt2/Cdk5 (**p = 0.0046), acetyl lysine Cdk5 (*p = 0.0349), Cdk5/p35 (**p = 0.0048) n (n = 3 brains per group, all Student’s t tests). Graphs display mean ± SEM values. All statistical tests are two-sided. Source data are provided as a Source Data file.
Fig. 7
Fig. 7. Hx induces nuclear localization of Sirt2 in OPCs.
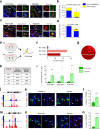
a, c Coronal sections of subcortical WM from Nx and Hx WT mice at P18. Dotted lines delineate WM, WM-white matter. Scale bar = 100 µm. b Quantification of cytoplasmic and nuclear Sirt2 expression in PDGFRα+ OPCs (Nx vs Hx: ****p < 0.0001, *p = 0.0152, Student’s t test) d Quantification of cytoplasmic and nuclear Sirt2 expression in CC1+ OLs (Nx vs Hx: **p = 0.0042, ****p < 0.0001, Student’s t test). Graphs display mean ± SEM values (n = 4 brains per condition). e Experimental procedure for Sirt2 ChIP-seq using dissected subcortical white matter (SCWM) from P15 WT mice reared under Nx or Hx conditions. f The number of enriched Sirt2 binding peaks identified following comparison of Nx, Hx, and IgG (negative control) samples. g The location of Sirt2 peaks enriched after Hx. h Sirt2 ChIP-seq data were compared with previously published RNA-seq data from Hx OPCs. Four genes that have nearby Sirt2 binding peaks are also altered in their expression following Hx. i QPCR verification of enriched Sirt2 binding at peaks 268-3, 268-2, and 308 in Hx WM, compared to Nx (**p = 0.0017, *p = 0.014, #p = 0.059 Student’s t test, n = 4 Nx and Hx samples). j Visualization of Sirt2 binding in genomic region upstream of Diaph2 gene. Red box highlights enriched binding in Hx. k RNAscope analysis of Diaph2 expression in Pdgfrα+ OPCs (arrows) in the WM of Nx and Hx WT mice at P22. Scale bars = 10 µm. l Quantification of the percentage of Diaph2+ OPCs in the WM of Nx and Hx WT mice at P22 (***p = 0.0001, n = 4 Nx and Hx mice, Student’s t test). m Visualization of Sirt2 binding in the genomic region upstream of Vegfc gene. Red box highlights enriched binding in Hx. n RNAscope analysis of Vegfc expression in Pdgfrα+ OPCs (arrows) in the WM of Nx and Hx WT mice at P22. Scale bars = 10 µm. o Quantification of the percentage of Vegfc+ OPCs in the WM of Nx and Hx WT mice at P22 (****p < 0.0001, Student’s t test, n = 4 Nx and Hx mice). Graphs display mean ± SEM values. All statistical tests are two-sided. Source data are provided as a Source Data file. The schematic in e was created using CorelDraw 2018 software (version 20.1.0.708).
Fig. 8
Fig. 8. Increased differentiation of Sirt2+ OLs in the absence of Sirt1.
a, b Quantification of cultured WM cells from Nx and Hx mice transfected with scrambled control or Sirt1 siRNA and cultured for 3 days a (O4: control *p = 0.0121, Sirt1 siRNA ***p = 0.0003, Nx control vs Nx siRNA ****p < 0.0001, Hx control vs Hx siRNA ****p < 0.0001; O1: control *p = 0.0440, Sirt1 siRNA ***p = 0.0004, Nx control vs Nx siRNA **p = 0.0024, Hx control vs Hx siRNA ****p < 0.0001) and 5 days in culture (DIC) b (O4: control **p = 0.0013, Sirt1 siRNA ***p = 0.0003, Nx control vs Nx siRNA ns p = 0.5243, Hx control vs Hx siRNA ****p < 0.0001; O1: control *p = 0.0265, Sirt1 siRNA ***p = 0.0003, Nx control vs Nx siRNA **p = 0.0032, Hx control vs Hx siRNA ****p < 0.0001, ANOVA with Tukey’s multiple comparisons adjustment) (n = 3 mice per group). c Representative images of O4+Sirt2+ and O1+Sirt2+ cells in Nx cultures. Scale bar = 50 µm. d Representative western blot from Nx and Hx WM lysates from WT-PDGFRα and Sirt1fl/flPDGFRαCreERT mice for Sirt2 expression (n = 3 per group). Molecular weight for Sirt2–43 KD e) Quantification of Sirt2 expression in Nx and Hx WM of WT-PDGFRαCreERT (green) and Sirt1fl/flPDGFRαCreERT (gray) mice. (WT Nx vs Hx *p = 0.0390, WT Hx vs Sirt1fl/flPDGFRαCreERT Hx *p = 0.0184, ANOVA with Tukey’s multiple comparisons adjustment). f, i, l, o Coronal sections of subcortical WM from WT-PDGFRα and Sirt1fl/flPDGFRαCreERT mice, after Nx and Hx, showing Sirt2+ f, CC1+Sirt2+ i, CNP+Sirt2+ l, and MBP+Sirt2+ o cells. WM-white matter. Scale bar = 100 µm. g, j, m, p Quantification of the percentage of WM cells that express Sirt2 (all ****p < 0.0001, ANOVA with Tukey’s multiple comparisons adjustment) g, CC1+Sirt2+ (WT: Nx vs Hx **p < 0.0020, Sirt1fl/flPDGFRαCreERT: Nx vs Hx ns p = 0.0517, WT Nx vs Sirt1fl/flPDGFRαCreERT Nx ****p < 0.0001, WT Hx vs Sirt1fl/flPDGFRαCreERT Hx ****p < 0.0001, ANOVA with Tukey’s multiple comparisons adjustment) j, CNP+Sirt2+ (WT: Nx vs Hx *p = 0.0351, Sirt1fl/flPDGFRαCreERT: Nx vs Hx **p = 0.0043, WT Nx vs Sirt1fl/flPDGFRαCreERT Nx *p = 0.0370, WT Hx vs Sirt1fl/flPDGFRαCreERT Hx ****p < 0.0001, ANOVA with Tukey’s multiple comparisons adjustment) m, and MBP+Sirt2+ (WT: Nx vs Hx *p = 0.0204, Sirt1fl/flPDGFRαCreERT: Nx vs Hx ***p = 0.0002, WT Nx vs Sirt1fl/flPDGFRαCreERT Nx ****p < 0.0001, WT Hx vs Sirt1fl/flPDGFRαCreERT Hx ****p < 0.0001 p, ANOVA with Tukey’s multiple comparisons adjustment) after Nx and Hx in WT and Sirt1fl/flPDGFRαCreERT mice. h, k, n, r Quantification of the total density of WM cells that express Sirt2+ (WT: Nx vs Hx *p < 0.0188, Sirt1fl/flPDGFRαCreERT: Nx vs Hx ns p = 0.6630, WT Nx vs Sirt1fl/flPDGFRαCreERT Nx ****p < 0.0001, WT Hx vs Sirt1fl/flPDGFRαCreERT Hx ****p < 0.0001, ANOVA with Tukey’s multiple comparisons adjustment) h, CC1+Sirt2+ (WT: Nx vs Hx *p = 0.0464, Sirt1fl/flPDGFRαCreERT: Nx vs Hx *p = 0.0104, WT Nx vs Sirt1fl/flPDGFRαCreERT Nx **p = 0.0055, WT Hx vs Sirt1fl/flPDGFRαCreERT Hx ****p < 0.0001, ANOVA with Tukey’s multiple comparisons adjustment) k, CNP+Sirt2+ (WT: Nx vs Hx ****p < 0.0001, Sirt1fl/flPDGFRαCreERT: Nx vs Hx ****p < 0.0001, WT Nx vs Sirt1fl/flPDGFRαCreERT Nx ns p = 0.6821, WT Hx vs Sirt1fl/flPDGFRαCreERT Hx ****p < 0.0001, ANOVA with Tukey’s multiple comparisons adjustment) n, and MBP+Sirt2+ (WT: Nx vs Hx **p = 0.0027, Sirt1fl/flPDGFRαCreERT: Nx vs Hx ns p = 0.9997, WT Nx vs Sirt1fl/flPDGFRαCreERT Nx ****p < 0.0001, WT Hx vs Sirt1fl/flPDGFRαCreERT Hx ****p < 0.0001, ANOVA with Tukey’s multiple comparisons adjustment) q after Nx and Hx in WT and Sirt1fl/flPDGFRαCreERT mice. Graphs display mean ± SEM values (n = 3 animals per group). All statistical tests are two-sided. Source data are provided as a Source Data file.

References

    1. Back SA. White matter injury in the preterm infant: pathology and mechanisms. Acta Neuropathol. 2017;134:331–349. doi: 10.1007/s00401-017-1718-6. - DOI - PMC - PubMed
    1. Lee YA. White matter injury of prematurity: its mechanisms and clinical features. J. Pathol. Transl. Med. 2017;51:449–455. doi: 10.4132/jptm.2017.07.25. - DOI - PMC - PubMed
    1. Chu PY, Li JS, Kosinski AS, Hornik CP, Hill KD. Congenital heart disease in premature infants 25-32 weeks’ gestational age. J. Pediatr. 2017;181:37–41.e31. doi: 10.1016/j.jpeds.2016.10.033. - DOI - PMC - PubMed
    1. Kwinta P, Pietrzyk JJ. Preterm birth and respiratory disease in later life. Expert Rev. Respir. Med. 2010;4:593–604. doi: 10.1586/ers.10.59. - DOI - PubMed
    1. Millar LJ, Shi L, Hoerder-Suabedissen A, Molnár Z. Neonatal hypoxia ischaemia: mechanisms, models, and therapeutic challenges. Front. Cell Neurosci. 2017;11:78–78. doi: 10.3389/fncel.2017.00078. - DOI - PMC - PubMed

Publication types