. 2022 Aug 15;12(1):20.
doi: 10.1186/s13395-022-00303-x.

Prolonged FOS activity disrupts a global myogenic transcriptional program by altering 3D chromatin architecture in primary muscle progenitor cells

Affiliations

Prolonged FOS activity disrupts a global myogenic transcriptional program by altering 3D chromatin architecture in primary muscle progenitor cells

A Rasim Barutcu et al. Skelet Muscle. .

Abstract

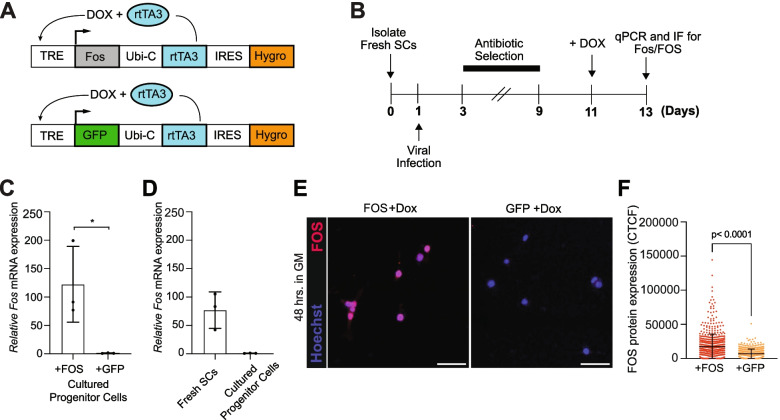
Background: The AP-1 transcription factor, FBJ osteosarcoma oncogene (FOS), is induced in adult muscle satellite cells (SCs) within hours following muscle damage and is required for effective stem cell activation and muscle repair. However, why FOS is rapidly downregulated before SCs enter cell cycle as progenitor cells (i.e., transiently expressed) remains unclear. Further, whether boosting FOS levels in the proliferating progeny of SCs can enhance their myogenic properties needs further evaluation.

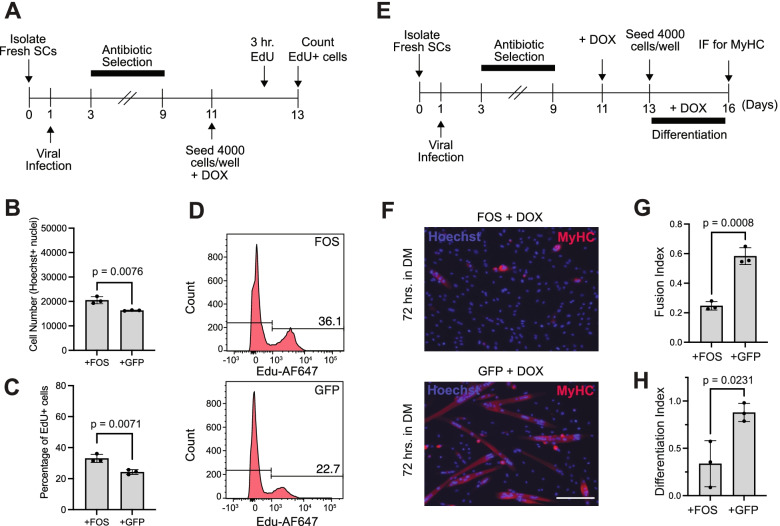
Methods: We established an inducible, FOS expression system to evaluate the impact of persistent FOS activity in muscle progenitor cells ex vivo. We performed various assays to measure cellular proliferation and differentiation, as well as uncover changes in RNA levels and three-dimensional (3D) chromatin interactions.

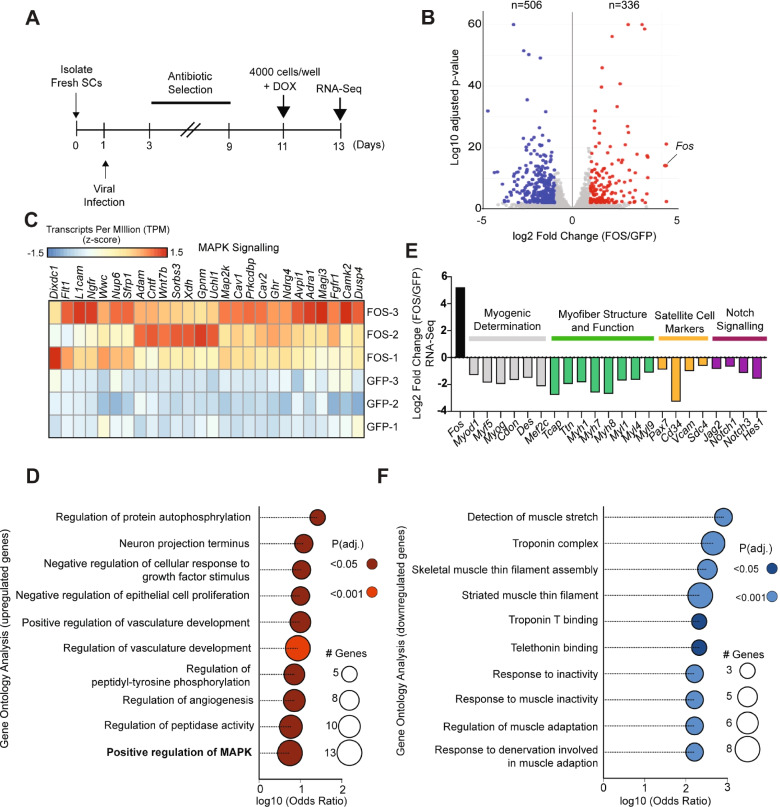
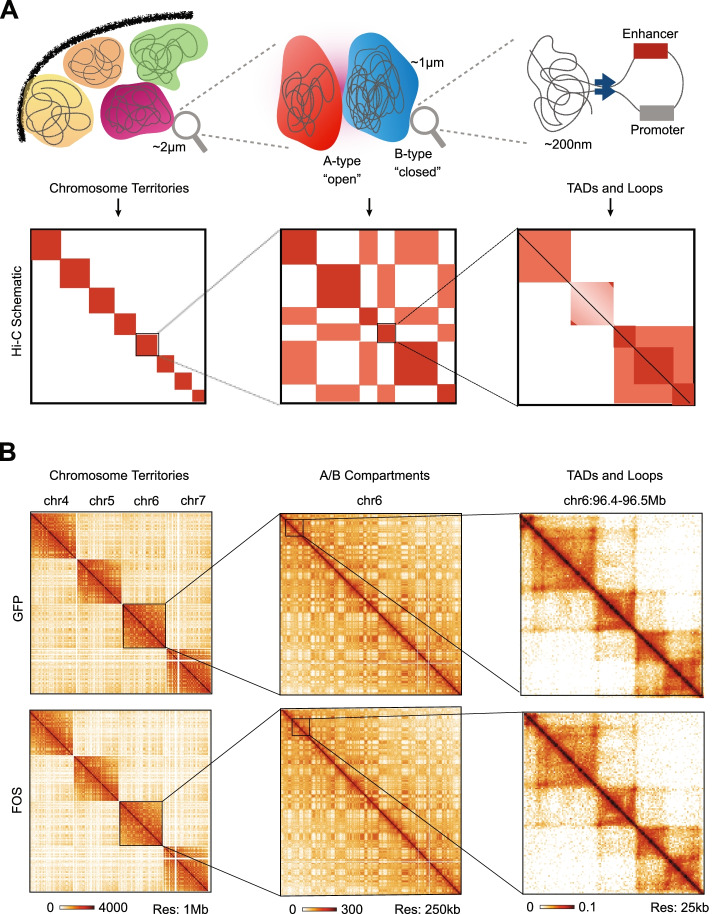
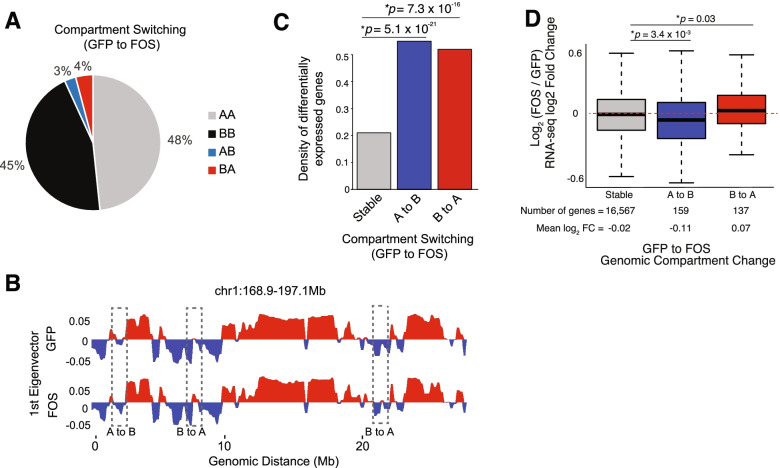
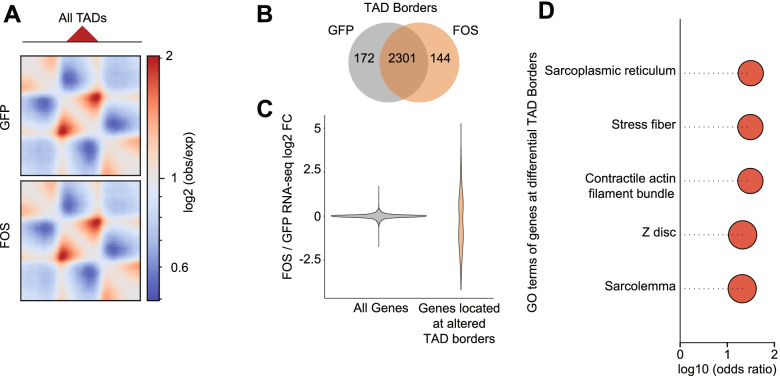
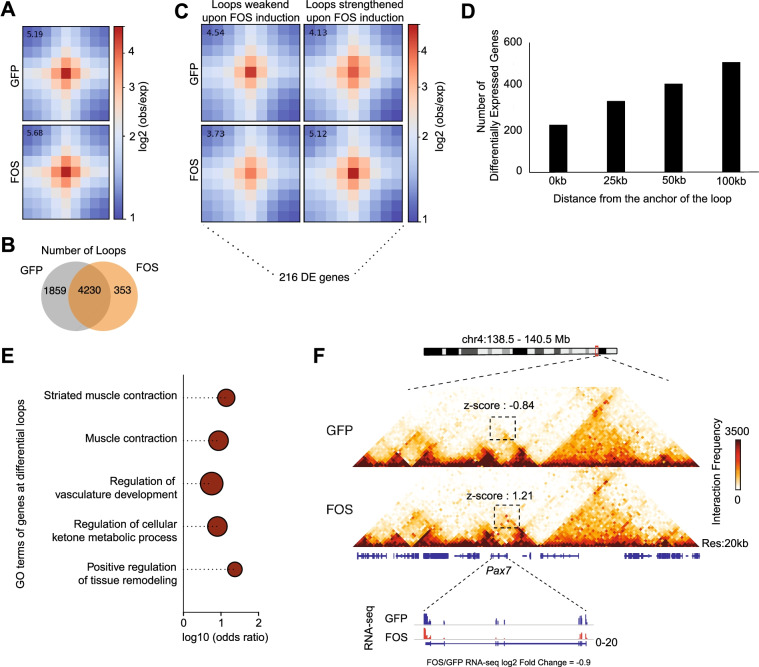
Results: Persistent FOS activity in primary muscle progenitor cells severely antagonizes their ability to differentiate and form myotubes within the first 2 weeks in culture. RNA-seq analysis revealed that ectopic FOS activity in muscle progenitor cells suppressed a global pro-myogenic transcriptional program, while activating a stress-induced, mitogen-activated protein kinase (MAPK) transcriptional signature. Additionally, we observed various FOS-dependent, chromosomal re-organization events in A/B compartments, topologically associated domains (TADs), and genomic loops near FOS-regulated genes.

Conclusions: Our results suggest that elevated FOS activity in recently activated muscle progenitor cells perturbs cellular differentiation by altering the 3D chromosome organization near critical pro-myogenic genes. This work highlights the crucial importance of tightly controlling FOS expression in the muscle lineage and suggests that in states of chronic stress or disease, persistent FOS activity in muscle precursor cells may disrupt the muscle-forming process.

Keywords: AP-1; FOS; Hi-C; Muscle progenitor cells; Muscle satellite cells; Myogenic differentiation; Topologically associated domains (TADs), gene loops.


Conflict of interest statement

The authors declare that they have no competing interests.

Figures

Fig. 1
Fig. 1
Establishing a doxycycline-inducible system to ectopically express FOS in muscle progenitor cells. A Schematic of the doxycycline-inducible lentiviral system to express FOS or GFP. The all-in-one vector contains the gene of interest, the rtTA, and a selection marker in a single expression vector. The Ubiquitin-C (Ubi-C) promoter drives the constitutive expression of the rtTA, and hygromycin via an internal IRES sequence. In the presence of DOX (1 μg/ml), rtTA becomes activated and binds to the TRE promoter to drive expression of Fos or Gfp. B Experimental design schematic. 3000 SCs were seeded into wells containing GM, infected with virus expressing FOS or GFP, selected with hygromycin (100 μg/ml) for 6 days, rested for 2 days, and then 4000 cells were re-seeded into wells containing GM supplemented with 1 μg/ml of DOX. C Relative expression of Fos mRNA normalized to GAPDH in pSLIK-Fos muscle progenitor cells relative to pSLIK-Gfp muscle progenitor cells after 48 h in GM supplemented with 1 μg/ml of DOX (N = cells from 3 mice). D Relative expression of Fos mRNA (normalized probe signal intensity, microarray data [9]) in freshly isolated SCs relative to 5-day cultured SCs. E 20× images of cultured muscle progenitor cells (FOS+DOX and GFP+DOX) stained for FOS (Red) or Hoechst (nuclei), showing FOS-positive Hoechst-positive nuclei in cells infected with pSLIK-Fos virus. Scale bar represents 50 μm. F Corrected total cell fluorescence (CTCF) of FOS protein in individual pSLIK-Fos and pSLIK-Gfp muscle progenitor cells quantified in E (n = 1480 (FOS) and 1012 (GFP) cells. C Mean comparisons using an unpaired, two-tailed, Student’s t test and F using Mann-Whitney U test. Data represents mean ± SD
Fig. 2
Fig. 2
Persistent FOS expression in muscle progenitor cells disrupts myogenic differentiation. A Experimental design. Fresh SCs were isolated from skeletal muscle (see “Materials and methods” section), infected with either pSLIK-Fos or pSLIK-Gfp viral vectors 1 day after isolation, selected with hygromycin (100 μg/ml) for 6 days, and then re-seeded at 4000 cells per 96-well in GM supplemented with 1 μg/ml of DOX for 48 h. Three hours before the end-point, cultures were pulsed with EdU. B Total number of Hoechst+ cells per well after 48 h in GM supplemented with 1 μg/ml of DOX (N = cells from 3 mice). C Percentage of EdU+ cells after 48 h in GM supplemented with 1 μg/ml of DOX (N = cells from 3 mice). D Representative histogram showing EdU(−) cells and EdU(+) cells, as defined by a fluorescent-minus-one control to set the negative and positive gates in flow cytometry. E Experimental design. Fresh SCs were isolated from skeletal muscle, infected with either pSLIK-Fos or pSLIK-Gfp viral vectors 1 day after isolation, selected with hygromycin (100 μg/ml) for 6 days, expanded in GM supplemented with DOX (1 μg/ml) for 48 h, and then 4000 cells were seeded per 96-well in DM (2.5% Horse Serum in DMEM) supplemented with DOX (1 μg/ml) and cultured for 72 h. F 20× image of pSLIK-Fos or pSLIK-Gfp myogenic cultures after 72 h in DM showing Hoechst+ (blue) and MyHC+ (magenta) cells. Scale bar represents 100 μm. G Quantification of the fusion index (total number of Hoechst+ nuclei in MyHC+ myotubes divided by the total number Hoechst+ nuclei) in pSLIK-Fos or pSLIK-Gfp myogenic cultures (N = cells from 3 mice). H Quantification using a differentiation index (sum of the integrated intensity of all Hoechst+ objects within MyHC+ objects divided by the sum of the integrated intensity of all Hoechst+ objects) in pSLIK-Fos or pSLIK-Gfp myogenic cultures (N = cells from 3 mice). B, C, G, H Mean comparisons using an unpaired, two-tailed, Student’s t test
Fig. 3
Fig. 3
Prolonged FOS activity perturbs a myogenic gene expression program in muscle progenitor cells. A Experimental design. Fresh SCs were isolated from skeletal muscle (see “Materials and methods” section), infected with either pSLIK-Fos or pSLIK-Gfp viral vectors 1 day after isolation, selected with hygromycin (100 μg/ml) for 6 days, and then re-seeded at 4000 cells per 96-well in GM supplemented with DOX (1 μg/ml) and RNA was isolated for RNA-seq after 48 h (n = cells from 3 mice). B Scatterplot showing the average log10 normalized gene RNA-seq counts for pSLIK-Fos or pSLIK-Gfp muscle progenitor cells. The significantly up- and downregulated genes are labeled as red and blue, respectively. C Heatmap showing the scaled transcripts per million (TPM) for a cohort of MAPK Signaling genes that were enriched in pSLIK-Fos versus pSLIK-Gfp muscle progenitor cells. D Plot showing the significantly enriched Gene Ontology (GO) terms associated with genes upregulated in pSLIK-Fos muscle progenitor cells. E Highlighting the Log2 fold change (FC) between myogenic determination (grey), myofiber structure (green), SC marker (yellow), and notch signaling (purple) genes that were depleted in pSLIK-Fos versus pSLIK-Gfp muscle progenitor cells. F Plot showing the significantly enriched Gene Ontology (GO) terms associated with genes downregulated in pSLIK-Fos muscle progenitor cells
Fig. 4
Fig. 4
In situ Hi-C analysis reveals higher-order chromatin structures in muscle progenitor cells. A (Top) Schematic showing the nuclear organization of chromatin, displaying chromosome territories (~ 2 μm), A/B compartments (~ 1 μm), and TADs and Loops (~ 200 nm). (Bottom) Cartoon representation of Hi-C heatmaps corresponding to chromosome territories, A/B compartments, and TADs and loops as depicted in the top panel. B Representative Hi-C heatmaps of pSLIK-Gfp and pSLIK-Fos expressing muscle progenitor cells at several resolutions
Fig. 5
Fig. 5
Continuous FOS activity leads to switching of A/B compartments near FOS regulated genes in muscle progenitor cells. A Pie chart showing the percentage of compartmental switching events between pSLIK-Gfp and pSLIK-Fos muscle progenitor cells. B Compartmentalization plot for chromosome 1 (168.9-197.1 megabases) showing the 1st eigenvector, where the positive values represent the open “A-type” and the negative values represent the closed “B-type” compartments, suggesting that while most of the A/B compartments in this genomic interval are unchanged, there are several examples of compartment switching events (dashed boxes) between the two conditions. C Bar plot showing the density of the normalized number of differentially expressed genes, based on RNA-seq data, at stable, or switched (i.e., A to B or B to A) compartmental regions (p-value: one-way ANOVA). D Box plot showing the average pSLIK-Fos vs. pSLIK-Gfp log2FC RNA-seq values for genes (outliers removed) within either stable compartments, or compartments that have switched from open to closed (A to B), and vice versa (B to A). p value: Wilcoxon rank-sum test
Fig. 6
Fig. 6
Elevated FOS activity alters TAD borders in muscle progenitor cells. A Meta-TAD plots, where the interaction profiles of all detected TADs (n = 2474 (pSLIK-Gfp), 2447 (pSLIK-Fos)) were scaled and superimposed on top of each other, showing a similar TAD formation in pSLIK-Fos relative to pSLIK-Gfp muscle progenitor cells. B Venn diagram showing the overlapping or differentially regulated (by at least 2 × 40 kb bins) TAD boundaries in pSLIK-Gfp and pSLIK-Fos muscle progenitor cells. C Violin plot showing pSLIK-Fos vs. pSLIK-Gfp RNA-seq log2FC values of genes located at overlapping or differentially regulated TAD boundaries. D Plot showing the GO enrichment of differentially expressed genes that are located at differentially regulated TAD boundaries. The adjusted p values for all GO enrichments are < 0.05
Fig. 7
Fig. 7
Elevated FOS activity alters gene loops near myogenic genes in muscle progenitor cells. A A meta plot showing the average loops (depicted as dots) in pSLIK-Gfp and pSLIK-Fos muscle progenitor cells. B Venn diagram showing the number of overlapping and differentially regulated loops in pSLIK-Gfp and pSLIK-Fos muscle progenitor cells. C Meta plots of all loops that have been lost or gained in pSLIK-Fos cells, showing loops weakened and strengthened in presence of FOS. D Bar plot showing the number of differentially expressed genes up to 100 kb around the differentially regulated loops at 25 kb intervals. Majority of the FOS-mediated differentially expressed genes are located within altered genomic loops. E Plot showing the GO term enrichment of differentially expressed genes within 25 kb distance of differentially regulated loops. F Heatmap at 20 kb resolution of GFP and FOS Hi-C datasets showing a strengthening of a loop formation at the Pax7 gene locus, which is associated with a decrease in Pax7 gene expression with a log fold-change value of − 0.9. The z-scores of the looping interaction are depicted on the figure

References

    1. Lepper C, Partridge TA, Fan C-M. An absolute requirement for Pax7-positive satellite cells in acute injury-induced skeletal muscle regeneration. Development. 2011;138:3639–3646. doi: 10.1242/dev.067595. - DOI - PMC - PubMed
    1. Sambasivan R, Yao R, Kissenpfennig A, Van Wittenberghe L, Paldi A, Gayraud-Morel B, et al. Pax7-expressing satellite cells are indispensable for adult skeletal muscle regeneration. Development. 2011;138:3647–3656. doi: 10.1242/dev.067587. - DOI - PubMed
    1. Tajbakhsh S. Skeletal muscle stem cells in developmental versus regenerative myogenesis. J Intern Med. 2009;266:372–389. doi: 10.1111/j.1365-2796.2009.02158.x. - DOI - PubMed
    1. Yin H, Price F, Rudnicki MA. Satellite cells and the muscle stem cell niche [internet]. Physiol Rev. 2013:23–67. 10.1152/physrev.00043.2011. - PMC - PubMed
    1. Almada AE, Wagers AJ. Molecular circuitry of stem cell fate in skeletal muscle regeneration, ageing and disease. Nat Rev Mol Cell Biol. 2016;17:267–279. doi: 10.1038/nrm.2016.7. - DOI - PMC - PubMed

Publication types