Identification and characterization of in vitro expanded hematopoietic stem cells
- PMID: 35971894
- PMCID: PMC9535767
- DOI: 10.15252/embr.202255502
Identification and characterization of in vitro expanded hematopoietic stem cells
Abstract
Hematopoietic stem cells (HSCs) cultured outside the body are the fundamental component of a wide range of cellular and gene therapies. Recent efforts have achieved > 200-fold expansion of functional HSCs, but their molecular characterization has not been possible since the majority of cells are non-HSCs and single cell-initiated cultures have substantial clone-to-clone variability. Using the Fgd5 reporter mouse in combination with the EPCR surface marker, we report exclusive identification of HSCs from non-HSCs in expansion cultures. By directly linking single-clone functional transplantation data with single-clone gene expression profiling, we show that the molecular profile of expanded HSCs is similar to proliferating fetal HSCs and reveals a gene expression signature, including Esam, Prdm16, Fstl1, and Palld, that can identify functional HSCs from multiple cellular states. This "repopulation signature" (RepopSig) also enriches for HSCs in human datasets. Together, these findings demonstrate the power of integrating functional and molecular datasets to better derive meaningful gene signatures and opens the opportunity for a wide range of functional screening and molecular experiments previously not possible due to limited HSC numbers.
Keywords: HSC expansion; hematopoiesis; hematopoietic stem cells; self-renewal gene signature; single cell biology.
© 2022 The Authors. Published under the terms of the CC BY 4.0 license.
Figures
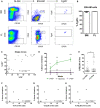
- A
Representative flow analysis for adult BM and FL ESLAM HSCs.
- B
Percentage of ESLAM HSCs that are Fgd5 + in adult BM and FL (n = 7 and 4 biological replicates, respectively). Error bars represent SD.
- C
The correlation between %LSK and %Fgd5 +EPCR+ (FE+) cells in single‐cell clones cultured for 10 days (n = 2). Pearson correlation, ****P < 0.001.
- D
The percentage of donor chimerism in primary recipients over 16 weeks is displayed for FhiEhi cells (n = 3), FloElo cells (n = 3), and bulk live cells (n = 2). t‐Test, *P < 0.05, **P < 0.01, ***P < 0.001.
- E
The percentage of cells that are FELSK within each clone is displayed in the graph for 10‐day F12 cultures containing HSA (n = 81) or PVA (n = 89). t‐Test, **P < 0.01.
- F–H
The correlation between donor chimerism and different phenotypic gating strategies for clones transplanted after 28‐days of culture in F12 PVA medium supplemented with 10 ng/ml SCF, 100 ng/ml TPO, and 20 ng/ml IL‐11. Pearson correlation, r 2 values displayed, *P < 0.05, **P < 0.01.

- A
Representative gating strategy for small (left), medium (middle), large (right) colonies, and the respective LSK percentages within the Fgd5 lowEPCRlow and Fgd5 highEPCRhigh gates below (n = 3 individual clones per condition). One‐way ANOVA, **P < 0.01, *P < 0.05. Error bars represent SD.
- B
Schematic of experimental design. Fgd5 and EPCR+ cells were sorted and cultured for 3 days in Stemspan supplemented with 300 ng/ml SCF and 20 ng/ml IL‐11, then resorted for Fgd5 high and EPCRhigh (FhiEhi) and Fgd5 low and EPCRlow (FloElo) cells for transplantation.
- C
Gating strategy for FhiEhi and FloElo cells.
- D
Lineage outputs of donor cells from Fig 1D as a percentage of donor cells at 16 weeks post transplantation.
- E
Clonal survival rates at day 10 in HSA and PVA cultures from Fig 1E (n = 2 biological replicates). Error bars represent SD.
- F
Clone sizes at day 10 in HSA and PVA cultures.
- G
Donor chimerism over time for mice transplanted with single clones cultured for 28 days in F12 PVA supplemented with 10 ng/ml SCF, 100 ng/ml TPO, and 20 ng/ml IL‐11.
- H
Lineage output of transplanted clones from (G), as a percentage of donor cells at week 16 post‐transplantation. The donor chimerism percentage is labeled above each recipient with above > 1% donor chimerism.
- I
The relationship between clone size and donor chimerism in transplanted clones from (G). Pearson correlation, ns = not significant.
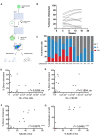
- A
Schematic of experimental design in which single ESLAM HSCs were cultured for 28 days in F12 media containing PVA, 10 ng/ml SCF, and 100 ng/ml TPO. At day 28, 20 clones were harvested and re‐sorted for phenotypic HSCs, defined as EPCR+Lin−Sca‐1+C‐kit− (ELSK) cells and remaining nonELSK cells. The two fractions were each split in half, 50% for transplantation and 50% for bulk RNA‐sequencing. On average for each clone, 22,382 ELSK cells were sorted compared to 90,700 nonELSK cells.
- B
The donor chimerism in animals receiving ELSK cells re‐sorted from the 20 clones (45–50% dose). One mouse was culled for health reasons before experimental endpoint.
- C
The proportion of donor GM, B, and T cells in each clone above 1% donor chimerism at week 16 with overall donor chimerism listed underneath each bar.
- D–G
The correlation between donor chimerism and absolute numbers and proportions of live cells or FELSK cells. Pearson correlation, ****P < 0.001.
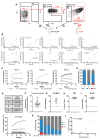
- A
Representative gating strategy for resort of ELSK and nonELSK cells.
- B
Donor chimerism and contribution to GM correlated against various phenotypic gating strategies and absolute numbers. Pearson correlation, ****P < 0.0001, ns = not significant.
- C
nonELSK cells from Fig 2B were pooled into three separate groups and transplanted into three recipients. Graph shows donor chimerism of the pooled cells and the clones (ELSK cells, 45/50% dose) that they were derived from. On average, each mouse received 26‐fold more cells than mice transplanted with ELSK cells.
- D
Corresponding proportion of cells that were GM, B, and T cell lineages from donor cells out of the three groups at week 16. Donor chimerism is indicated above the bar.
- E
Number of pooled ELSK cells transplanted for each group.
- F
Donor chimerism for mice transplanted with single ELSK cells isolated from 28‐day cultures initiated from 100 cells, 12‐weeks post transplantation. Dotted line indicates 1% chimerism.
- G–I
Respective GM, B, and T cell lineage contributions of donor single cells at week 12.Dotted lines mark 1% chimerism.
- J
Donor chimerism from 5% doses of ELSK cells from selected clones from Fig 2B (n = 7, one mouse was culled for health reasons before final timepoint).
- K
Corresponding lineage output of 5% doses at week 16 as a percentage of donor cells.
- L
Correlation between donor chimerism and percentage of ELSK in clones that were transplanted at 5% doses. Pearson correlation, *P < 0.05.
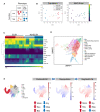
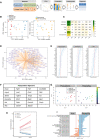
- A
Schematic of color‐coded cell population categories. Repopulation was defined as having > 1% donor chimerism and > 1% contribution to GM at 16 weeks.
- B
MDS plot of bulk RNA sequencing samples colored by their population categories and their corresponding MolO score.
- C
Correlation of each sample to gene expression profiles of various hematopoietic stem and progenitor cell populations, as defined in the Immgen database.
- D
UMAP depiction of single cell profiling of a 28‐day culture initiated by 50 HSCs. Cell type annotations were derived using marker gene signatures.
- E
UMAP representation of mouse LK/LSK (Dahlin et al, 2018) single cell transcriptomes colored by DoT scores computed using DEGs of PosELSK against PosNonELSK (left); NegELSK (middle); NegNonELSK samples (right). Dominant differentiation trajectories are indicated by positive DoT scores (red), while negative DoT scores (blue) outline underrepresented lineages in expanded clones. Enriched populations are indicated by red arrows and underrepresented populations indicated by blue arrows. The point of origin is marked by a dotted line.

- A
MDS plots of uncorrected and batch‐corrected samples, using category plts (left) and unique sample IDs (right).
- B
MDS plot of PosELSK and NegELSK samples, colored by donor chimerism and donor GM contribution.
- C
MolO score of each cell category (geometric mean). Central band represents median, boxes represent first and second quartile, whiskers represent third and fourth quartile and dots represent outliers. T‐test. Individual geometric means were computed for samples within each defined category.
- D
Differential gene expression (DGE) plot of PosELSK against NegELSK (P = 0.05 and logFC = 1).
- E
Heatmap outlining gene expression profiles across NegELSK and PosELSK samples for identified differentially expressed genes (DEGs). N and R numbers on top refer to the specific clones outlined in Table 1.
- F
GO terms enriched in PosELSK and NegELSK fractions. Computed using differentially expressed genes of repopulating and nonrepopulating ELSK cells.
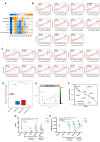
- A
Schematic of how the repopulation signature (RepopSig) was derived using PCA analysis and transplantation‐associated metadata.
- B
PCA plot of samples colored by their categories and by functional outcome.
- C
Correlation between the first 7 principal components and the metadata, showing r 2 values and significance. Pearson correlation, *P < 0.05, **P < 0.01, ***P < 0.001, ****P < 0.0001.
- D
PCA loading plot for PC1 and PC2.
- E
Regression coefficients of top 50 repopulation‐associated genes. Logistic regression coefficients (Firth penalized) depicted for repopulation outcome and linear regression of chimerism and GM contribution. Cut‐off for signature inclusion is indicated by the red dotted line. N = 22 individual clones, error bars represent SD.
- F
List of RepopSig genes.
- G
MDS plots depicting sample categories and RepopSig signature scores.
- H
MolO and RepopSig scores of each sample colored by their categories.
- I
KEGG pathway analysis of genes correlated with the RepopSig (r > 0.7, Signature) and genes least correlated with the RepopSig (r < −0.7).
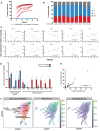
- A
Correlation between the top 7 principal components and the metadata, showing Pearson r values and significance. *P < 0.05, **P < 0.01, ***P < 0.001, ****P < 0.0001.
- B, C
Linear regression plots of individual Repopulation Signature (RepopSig) genes. P‐value and r 2 value provided for each fitted model.
- D
RepopSig score representation across the four sample categories Central band represents median, boxes represent first and second quartile, whiskers represent third and fourth quartile and dots represent outliers. T‐test. Individual geometric means were computed for samples within each defined category.
- E
MDS plot of all RNA‐seq samples, indicating the corresponding MolO score.
- F
Rank plot depicting the Pearson correlation of each gene with the RepopSig (order by r values). MolO signature genes marked in red.
- G, H
ELSK percentage and live cell numbers of 28‐day bulk cultures starting with 50 input cells, with or without titrating doses of CASIN (2, 10, 20 μM), NSC237D66 (5, 50, 200 μM), Rhosin (1, 10, 50 μM) and ML099 (1, 10, 50 μM). N = 3–4 individual clones per condition. At all doses tested, CASIN were detrimental to HSC viability. One‐way ANOVA. ****P < 0.0001, ***P < 0.001, *P < 0.05. Error bars represent SD.
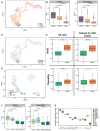
- A
A selection of clones was transplanted into irradiated recipients using 50% of the cells harvested at day 28 and donor chimerism of mice from clones with > 20% ELSK (red, n = 9) and < 1% ELSK (blue, pooled from 10 clones) are displayed.
- B
Corresponding lineage output of clones as a percentage of donor cells at week 12 post‐transplantation with donor chimerism displayed under each bar.
- C
Correlation of the relative gene expression against the ELSK percentage of the clones. Red and blue dots indicate clones that were transplanted in Fig 5C. Pearson correlation, ****P < 0.0001,***P < 0.001, **P < 0.01, *P < 0.05.
- D
Single ESLAM HSCs were cultured for 28 days and 10% of the cultures were analyzed by flow cytometry on day 27. Clones with above 20% (n = 13) and below 1% ELSK cells (n = 15) were analyzed for their relative gene expression of RepopSig genes (both positive and negative markers) ***P < 0.001, **P < 0.01, *P < 0.05. Error bars represent SD.
- E
The correlation between the proportion of Esam + ELSK (%EELSK) and FELSK cells in single‐cell clones cultured for 28 days, Pearson correlation, ****P < 0.0001.
- F
Projections of geometric mean scores for MolO (middle) and RepopSig (right) gene signatures onto the previously derived (Fig 3D) single cell landscape of 28 day‐expanded bulk HSC cultures (left).
- A
UMAP representation of mouse HSC transcriptomes (Nestorowa et al, 2016), colored by their cell type.
- B
Boxplot of MolO and RepopSig scores for each cell group with both signatures being able to identify LT‐HSCs.
- C
Projections of hibernating (hibHSC) and fetal liver (FL) HSC scRNA‐seq profiles onto the single‐cell landscape showing the majority of cells in both cases localizing to the LT‐HSC region.
- D
MolO and RepopSig scores for FL HSCs and hibHSCs where MolO preferentially associates with quiescent hibHSCs and RepopSig associates with both equally. This is true both when (I) all single cells and (II) excluding cells falling outside the LT‐HSC compartment are assessed.
- E
UMAP landscape for unstimulated and SCF‐stimulated freshly isolated HSCs and hibHSCs (Oedekoven et al, 2021).
- F
MolO and RepopSig scores for freshly isolated HSCs and hibHSCs, as outlined in (E) where again RepopSig identifies populations with high proportions of functional HSCs.
- G
Geometric mean signature scoring for human homologs of RepopSig genes across human stem, progenitor, and mature cell populations (HSC, hematopoietic stem cells; MPP, multipotent progenitors; MLP, multilymphoid progenitors; CMP, common myeloid progenitor; GMP, granulocyte‐monocyte progenitors; MEP, megakaryocyte‐erythroid progenitors; MONO, monocytes; GR, granulocyte; B, B cells; T, T cells; NK, natural killer cells; DC, dendritic cells; EryP, erythroid progenitors. For all boxplots, central band represents median, boxes represent first and second quartile, whiskers represent third and fourth quartile, and dots represent outliers. T‐test. Individual geometric means were computed using all single cells within the relevant defined cell clusters.
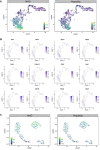
- A
UMAP representation of scRNA‐seq profiles of mouse hematopoietic cells (Nestorowa et al, 2016) depicting MolO and RepopSig scores.
- B
Gene expression profiles of single RepopSig genes.
- C
UMAP representation of scRNA‐seq profiles of freshly isolated HSCs, hibernating HSCs and SCF‐stimulated states (Oedekoven et al, 2021) showing MolO and RepopSig scores.
References
-
- Aguilar SV, Aguilar O, Allan R, Amir EAD, Angeli V, Artyomov MN, Asinovski N, Astarita J, Austen KF, Bajpai G et al (2020) ImmGen at 15. Nat Immunol 21: 700–703 - PubMed
-
- Antonchuk J, Sauvageau G, Humphries RK (2002) HOXB4‐induced expansion of adult hematopoietic stem cells ex vivo. Cell 109: 39–45 - PubMed
-
- Bai T, Li J, Sinclair A, Imren S, Merriam F, Sun F, O'Kelly MB, Nourigat C, Jain P, Delrow JJ et al (2019) Expansion of primitive human hematopoietic stem cells by culture in a zwitterionic hydrogel. Nat Med 2510: 1566–1575 - PubMed
Publication types
MeSH terms
Substances
Associated data
- Actions
Grants and funding
LinkOut - more resources
Full Text Sources
Other Literature Sources
Molecular Biology Databases
Miscellaneous

