

Total Internal Reflection Fluorescence (TIRF) Microscopy
- PMID: 35972209
- PMCID: PMC9522316
- DOI: 10.1002/cpz1.517
Total Internal Reflection Fluorescence (TIRF) Microscopy
Abstract
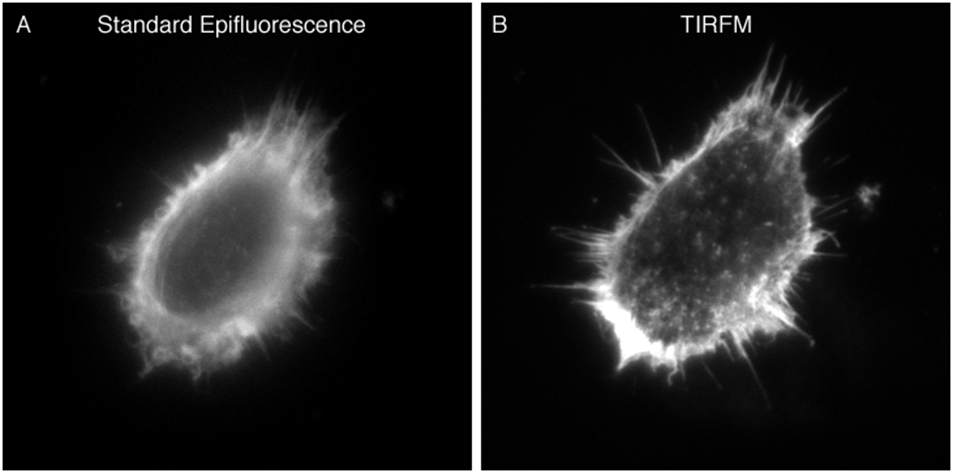
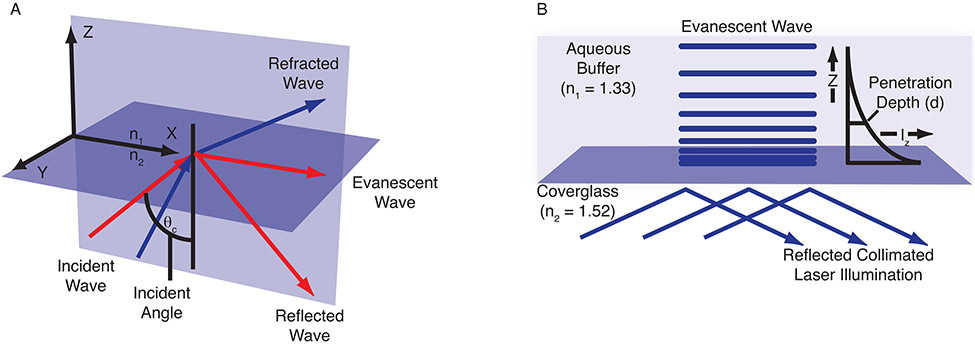
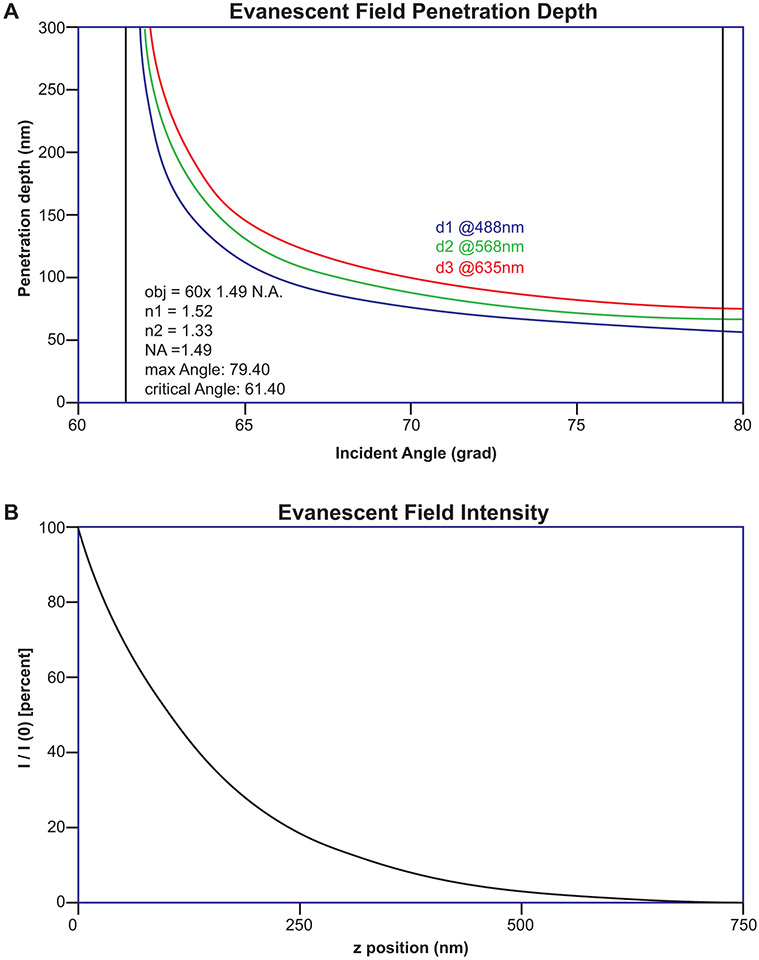
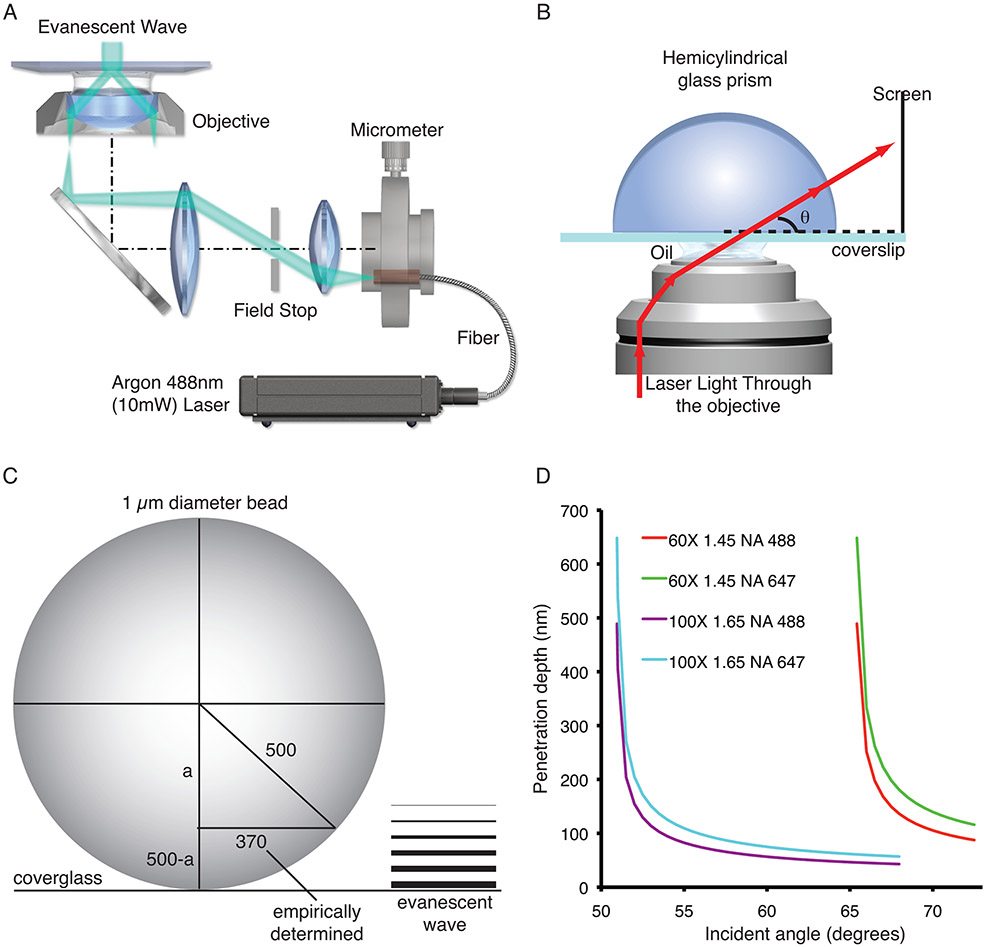
Total internal reflection fluorescence (TIRF) microscopy (TIRFM) is an elegant optical technique that provides for the excitation of fluorophores in an extremely thin axial region ("optical section"). The method is based on the principle that when excitation light is completely internally reflected in a transparent solid (e.g., coverglass) at its interface with liquid, an electromagnetic field, called the evanescent wave, is generated in the liquid at the solid-liquid interface and is the same frequency as the excitation light. Since the intensity of the evanescent wave exponentially decays with distance from the surface of the solid, only fluorescent molecules within a few hundred nanometers of the solid are efficiently excited. This overview will review the history, optical theory, and hardware configurations used in TIRFM. In addition, it will provide experimental details and methodological considerations for studying receptors at the plasma membrane in neurons. © 2022 Wiley Periodicals LLC.
Keywords: axial resolution; fluorescence microscopy; live cell imaging; neurons; receptor trafficking.
© 2022 Wiley Periodicals LLC.
Conflict of interest statement
Conflict of Interest
The author declares no conflict of interest.
Figures
Similar articles
-
Total internal reflection fluorescence (TIRF) microscopy.Curr Protoc Cytom. 2009 Oct;Chapter 12:Unit12.18. doi: 10.1002/0471142956.cy1218s50. Curr Protoc Cytom. 2009. PMID: 19816922 Free PMC article. Review.
-
Total internal reflection fluorescent microscopy.J Microsc. 1983 Jan;129(Pt 1):19-28. doi: 10.1111/j.1365-2818.1983.tb04158.x. J Microsc. 1983. PMID: 6827590
-
Total internal reflection fluorescence (TIRF) microscopy.Curr Protoc Microbiol. 2008 Aug;Chapter 2:Unit 2A.2.1-2A.2.22. doi: 10.1002/9780471729259.mc02a02s10. Curr Protoc Microbiol. 2008. PMID: 18729056
-
Live-Cell Total Internal Reflection Fluorescence (TIRF) Microscopy to Investigate Protein Internalization Dynamics.Methods Mol Biol. 2022;2438:45-58. doi: 10.1007/978-1-0716-2035-9_3. Methods Mol Biol. 2022. PMID: 35147934
-
Cellular imaging using total internal reflection fluorescence microscopy: theory and instrumentation.Cold Spring Harb Protoc. 2012 Apr 1;2012(4):414-24. doi: 10.1101/pdb.top068650. Cold Spring Harb Protoc. 2012. PMID: 22474668 Review.
Cited by
-
Detecting and measuring of GPCR signaling - comparison of human induced pluripotent stem cells and immortal cell lines.Front Endocrinol (Lausanne). 2023 May 24;14:1179600. doi: 10.3389/fendo.2023.1179600. eCollection 2023. Front Endocrinol (Lausanne). 2023. PMID: 37293485 Free PMC article. Review.
-
Dual-Color Optical Recording of Bioelectric Potentials by Polymer Electrochromism.J Am Chem Soc. 2022 Dec 28;144(51):23505-23515. doi: 10.1021/jacs.2c10198. Epub 2022 Dec 16. J Am Chem Soc. 2022. PMID: 36525312 Free PMC article.
-
Dynamics of spindle assembly and position checkpoints: Integrating molecular mechanisms with computational models.Comput Struct Biotechnol J. 2025 Jan 10;27:321-332. doi: 10.1016/j.csbj.2024.12.021. eCollection 2025. Comput Struct Biotechnol J. 2025. PMID: 39897055 Free PMC article. Review.
-
Exploring the dynamics of messenger ribonucleoprotein-mediated translation repression.Biochem Soc Trans. 2024 Dec 19;52(6):2267-2279. doi: 10.1042/BST20231240. Biochem Soc Trans. 2024. PMID: 39601754 Free PMC article. Review.
-
pH-regulated single cell migration.Pflugers Arch. 2024 Apr;476(4):639-658. doi: 10.1007/s00424-024-02907-2. Epub 2024 Jan 12. Pflugers Arch. 2024. PMID: 38214759 Free PMC article. Review.
References
-
- Arts JJG, Mahlandt EK, Schimmel L, Gronloh MLB, van der Niet S, Klein B, Fernandez-Borja M, van Geemen D, Huveneers S, van Rijssel J, Goedhart J, van Buul JD, 2021. Endothelial Focal Adhesions Are Functional Obstacles for Leukocytes During Basolateral Crawling. Front Immunol 12: 667213. - PMC - PubMed
-
- Axelrod D, 2001. Total internal reflection fluorescence microscopy in cell biology. Traffic 2: 764–74. - PubMed
-
- Beaumont V, 2003. Visualizing membrane trafficking using total internal reflection fluorescence microscopy. Biochem Soc Trans 31: 819–23. - PubMed
Publication types
MeSH terms
Substances
Grants and funding
LinkOut - more resources
Full Text Sources
Medical
