

Bacterial Keystone Taxa Regulate Carbon Metabolism in the Earthworm Gut
- PMID: 35972247
- PMCID: PMC9603485
- DOI: 10.1128/spectrum.01081-22
Bacterial Keystone Taxa Regulate Carbon Metabolism in the Earthworm Gut
Abstract
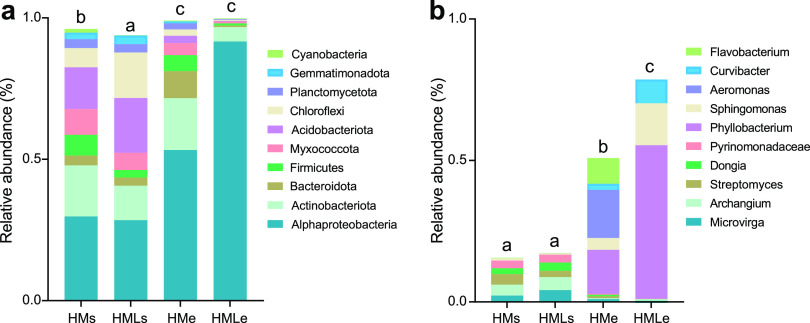
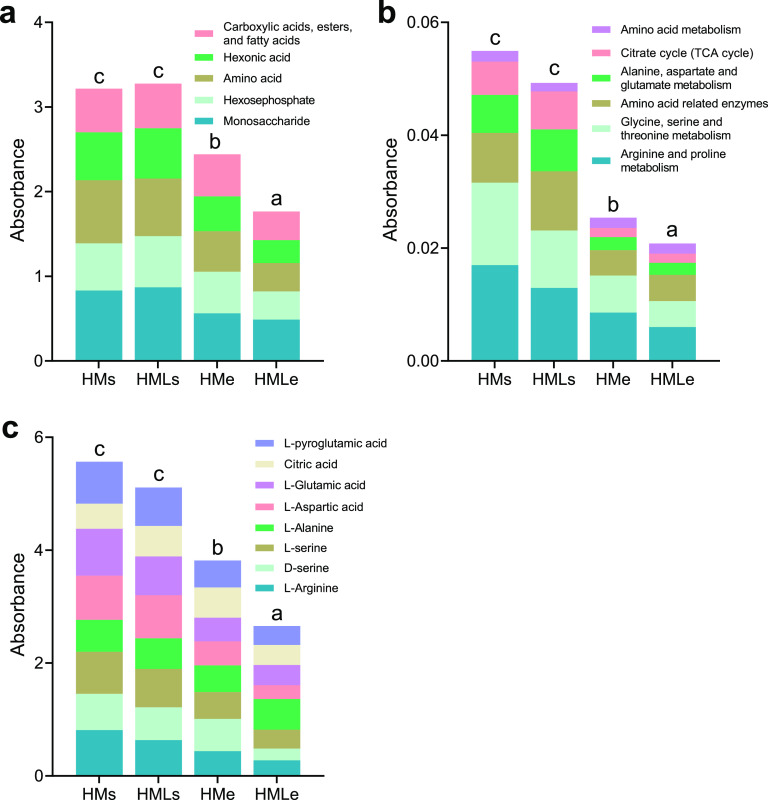
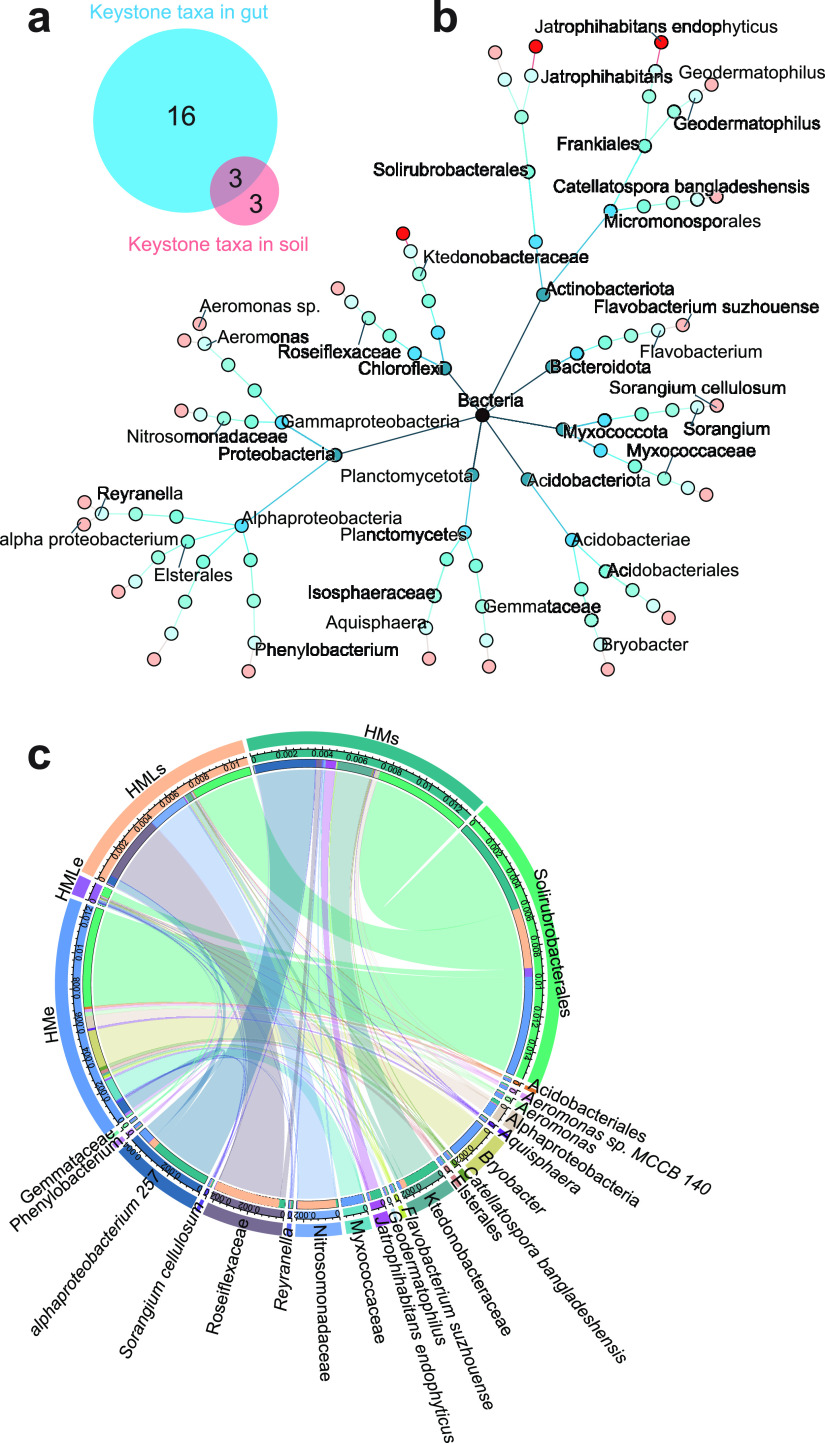
As important ecosystem engineers in soils, earthworms strongly influence carbon cycling through their burrowing and feeding activities. Earthworms do not perform these roles in isolation, because their intestines create a special habitat favorable for complex bacterial communities. However, how the ecological functioning of these earthworm-microbe interactions regulates carbon cycling remains largely unknown. To fill this knowledge gap, we investigated the bacterial community structure and carbon metabolic activities in the intestinal contents of earthworms and compared them to those of the adjacent soils in a long-term fertilization experiment. We discovered that earthworms harbored distinct bacterial communities compared to the surrounding soil under different fertilization conditions. The bacterial diversity was significantly larger in the adjacent soils than that in the earthworm gut. Three statistically identified keystone taxa in the bacterial networks, namely, Solirubrobacterales, Ktedonobacteraceae, and Jatrophihabitans, were shared across the earthworm gut and adjacent soil. Environmental factors (pH and organic matter) and keystone taxa were important determinants of the bacterial community composition in the earthworm gut. Both PICRUSt2 (Phylogenetic Investigation of Communities by Reconstruction of Unobserved States) and FAPROTAX (Functional Annotation of Prokaryotic Taxa) predicted that carbon metabolism was significantly higher in adjacent soil than in the earthworm gut, which was consistent with the average well color development obtained by the Biolog assay. Structural equation modeling combined with correlation analysis suggested that pH, organic matter, and potential keystone taxa exhibited significant relationships with carbon metabolism. This study deepens our understanding of the mechanisms underlying keystone taxa regulating carbon cycling in the earthworm gut. IMPORTANCE The intestinal microbiome of earthworms is a crucial component of the soil microbial community and nutrient cycling processes. If we could elucidate the role of this microbiome in regulating soil carbon metabolism, we would make a crucial contribution to understanding the ecological role of these gut bacterial taxa and to promoting sustainable agricultural development. However, the ecological functioning of these earthworm-microbe interactions in regulating carbon cycling has so far not been fully investigated. In this study, we revealed, first, that the bacterial groups of Solirubrobacterales, Ktedonobacteraceae, and Jatrophihabitans were core keystone taxa across the earthworm gut and adjacent soil and, second, that the environmental factors (pH and organic carbon) and keystone taxa strongly affected the bacterial community composition and exhibited close correlations with microbial carbon metabolism. Our results provide new insights into the community assembly of the earthworm gut microbiome and the ecological importance of potential keystone taxa in regulating carbon cycling dynamics.
Keywords: bacterial community; bacterial community structure; bacterial diversity; earthworm gut; keystone taxa; microbial carbon metabolism.
Conflict of interest statement
The authors declare no conflict of interest.
Figures


Similar articles
-
Keystone taxa shared between earthworm gut and soil indigenous microbial communities collaboratively resist chlordane stress.Environ Pollut. 2021 Aug 15;283:117095. doi: 10.1016/j.envpol.2021.117095. Epub 2021 Apr 12. Environ Pollut. 2021. PMID: 33862342
-
Insights into the earthworm gut multi-kingdom microbial communities.Sci Total Environ. 2020 Jul 20;727:138301. doi: 10.1016/j.scitotenv.2020.138301. Epub 2020 Apr 8. Sci Total Environ. 2020. PMID: 32330704
-
Protein- and RNA-Enhanced Fermentation by Gut Microbiota of the Earthworm Lumbricus terrestris.Appl Environ Microbiol. 2018 May 17;84(11):e00657-18. doi: 10.1128/AEM.00657-18. Print 2018 Jun 1. Appl Environ Microbiol. 2018. PMID: 29602789 Free PMC article.
-
Ecological and evolutionary responses of earthworm holobionts to environmental changes.ISME J. 2025 Jan 2;19(1):wraf044. doi: 10.1093/ismejo/wraf044. ISME J. 2025. PMID: 40057975 Free PMC article. Review.
-
Research progress on earthworms and soil health.Ying Yong Sheng Tai Xue Bao. 2025 Feb 18;36(2):637-646. doi: 10.13287/j.1001-9332.202502.036. Ying Yong Sheng Tai Xue Bao. 2025. PMID: 40370181 Review. English.
Cited by
-
Potassium Fulvate Alleviates Salt-Alkali Stress and Promotes Comprehensive Growth of Oats in Saline-Alkali Soils of the Qaidam Basin.Plants (Basel). 2025 Jun 28;14(13):1982. doi: 10.3390/plants14131982. Plants (Basel). 2025. PMID: 40647991 Free PMC article.
-
Endosymbiotic bacteria within the nematode-trapping fungus Arthrobotrys musiformis and their potential roles in nitrogen cycling.Front Microbiol. 2024 Jan 29;15:1349447. doi: 10.3389/fmicb.2024.1349447. eCollection 2024. Front Microbiol. 2024. PMID: 38348183 Free PMC article.
-
Exploring untapped bacterial communities and potential polypropylene-degrading enzymes from mangrove sediment through metagenomics analysis.Front Microbiol. 2024 Apr 4;15:1347119. doi: 10.3389/fmicb.2024.1347119. eCollection 2024. Front Microbiol. 2024. PMID: 38638899 Free PMC article.
-
Fauna-microbe diversity coupling lost in agricultural soils: Implications from the bacteria hidden in earthworm gut.Fundam Res. 2023 Apr 3;5(4):1614-1621. doi: 10.1016/j.fmre.2023.03.002. eCollection 2025 Jul. Fundam Res. 2023. PMID: 40777775 Free PMC article.
-
MICROPHERRET: MICRObial PHEnotypic tRait ClassifieR using Machine lEarning Techniques.Environ Microbiome. 2024 Aug 8;19(1):58. doi: 10.1186/s40793-024-00600-6. Environ Microbiome. 2024. PMID: 39113074 Free PMC article.
References
-
- Gross M. 2016. Putting earthworms on the map. Curr Biol 26:R387–R390. doi:10.1016/j.cub.2016.05.004. - DOI
-
- Medina-Sauza RM, Álvarez-Jiménez M, Delhal A, Reverchon F, Blouin M, Guerrero-Analco JA, Cerdan CR, Guevara R, Villain L. 2019. Earthworms building up soil microbiota, a review. Front Environ Sci 7:81. doi:10.3389/fenvs.2019.00081. - DOI
Publication types
MeSH terms
Substances
LinkOut - more resources
Full Text Sources
Research Materials
Miscellaneous
