. 2022 Oct 26;10(5):e0243221.
doi: 10.1128/spectrum.02432-21. Epub 2022 Aug 16.

UPEC Colonic-Virulence and Urovirulence Are Blunted by Proanthocyanidins-Rich Cranberry Extract Microbial Metabolites in a Gut Model and a 3D Tissue-Engineered Urothelium

Affiliations

UPEC Colonic-Virulence and Urovirulence Are Blunted by Proanthocyanidins-Rich Cranberry Extract Microbial Metabolites in a Gut Model and a 3D Tissue-Engineered Urothelium

Charlène Roussel et al. Microbiol Spectr. .

Abstract

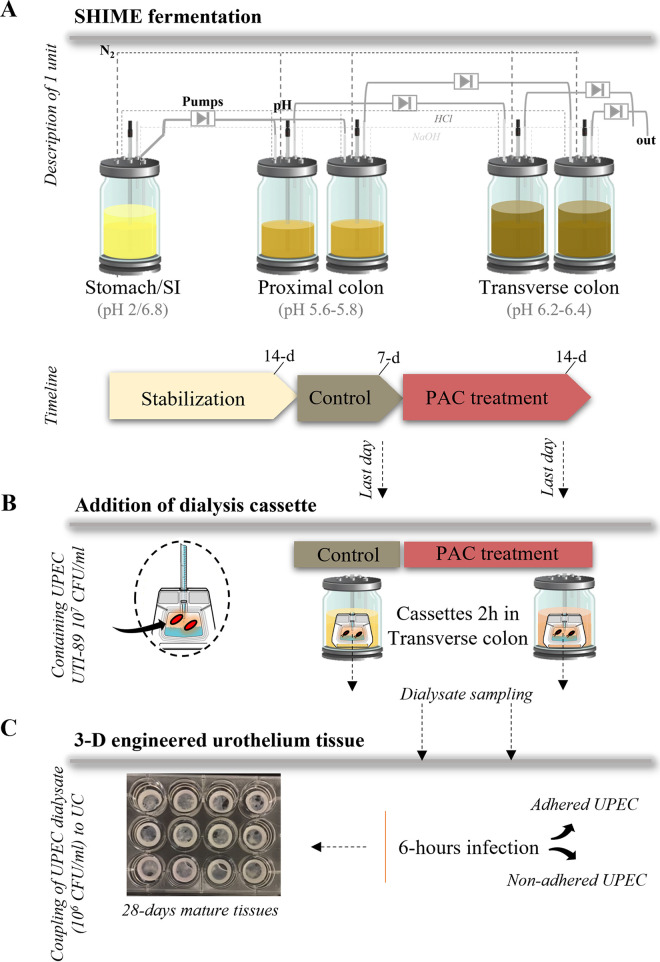
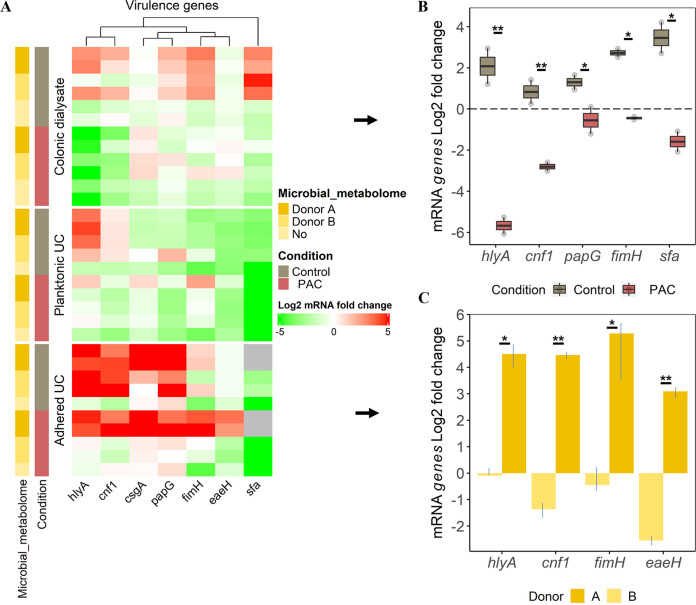
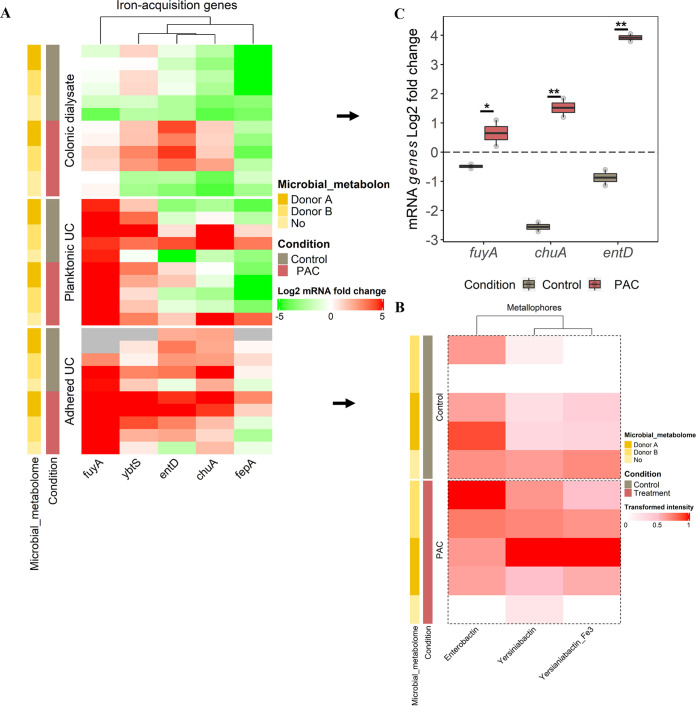
Uropathogenic Escherichia coli (UPEC) ecology-pathophysiology from the gut reservoir to its urothelium infection site is poorly understood, resulting in equivocal benefits in the use of cranberry as prophylaxis against urinary tract infections. To add further understanding from the previous findings on PAC antiadhesive properties against UPEC, we assessed in this study the effects of proanthocyanidins (PAC) rich cranberry extract microbial metabolites on UTI89 virulence and fitness in contrasting ecological UPEC's environments. For this purpose, we developed an original model combining a colonic fermentation system (SHIME) with a dialysis cassette device enclosing UPEC and a 3D tissue-engineered urothelium. Two healthy fecal donors inoculated the colons. Dialysis cassettes containing 7log10 CFU/mL UTI89 were immersed for 2h in the SHIME colons to assess the effect of untreated (7-day control diet)/treated (14-day PAC-rich extract) metabolomes on UPEC behavior. Engineered urothelium were then infected with dialysates containing UPEC for 6 h. This work demonstrated for the first time that in the control fecal microbiota condition without added PAC, the UPEC virulence genes were activated upstream the infection site, in the gut. However, PAC microbial-derived cranberry metabolites displayed a remarkable propensity to blunt activation of genes encoding toxin, adhesin/invasins in the gut and on the urothelium, in a donor-dependent manner. Variability in subjects' gut microbiota and ensuing contrasting cranberry PAC metabolism affects UPEC virulence and should be taken into consideration when designing cranberry efficacy clinical trials. IMPORTANCE Uropathogenic Escherichia coli (UPEC) are the primary cause of recurrent urinary tract infections (UTI). The poor understanding of UPEC ecology-pathophysiology from its reservoir-the gut, to its infection site-the urothelium, partly explains the inadequate and abusive use of antibiotics to treat UTI, which leads to a dramatic upsurge in antibiotic-resistance cases. In this context, we evaluated the effect of a cranberry proanthocyanidins (PAC)-rich extract on the UPEC survival and virulence in a bipartite model of a gut microbial environment and a 3D urothelium model. We demonstrated that PAC-rich cranberry extract microbial metabolites significantly blunt activation of UPEC virulence genes at an early stage in the gut reservoir. We also showed that altered virulence in the gut affects infectivity on the urothelium in a microbiota-dependent manner. Among the possible mechanisms, we surmise that specific microbial PAC metabolites may attenuate UPEC virulence, thereby explaining the preventative, yet contentious properties of cranberry against UTI.

Keywords: PAC; UPEC; cranberry; gut metabolome; urinary tract infections; urothelium; virulence genes.


Conflict of interest statement

The authors declare a conflict of interest. The authors declare that they have no known competing financial interests or personal relationships that could have appeared to influence the work reported in this paper. Y.D. hold the NSERC-DianaFood Industrial Research Chair (IRC) on the prebiotic effect of polyphenols in fruits and vegetables. The funders were not involved in the study design, collection, analysis, interpretation of data, the writing of this article or the decision to submit it for publication.

Figures

FIG 1
FIG 1
Study design. (A) Illustration of one unit of the TWIN-SHIME fermentation system, including reactors in series from the stomach/small intestine (SI) to the transverse colon. The colonic reactors of each unit were inoculated with two different fecal donors, both in duplicates. The three phases and duration of fermentation are shown in the timeline. The treatment consisted of the addition of 86.8 mg PAC-rich cranberry extract/day in the SHIME stomach for 14 days, consecutively catabolized in the proximal and transverse colon. (B) The transverse colon was chosen as site of interest for UPEC reservoir and final PAC catabolism. Therefore, dialysis cassettes (10 kDa) containing 7log10 CFU/mL UTI89 were added for 2h in the transverse colon to assess the effect of untreated (control)/treated (PAC) metabolome on UPEC behavior. After exposure, dialysates containing UPEC were stored until processing. (C) Dialysates containing UPEC (adjusted concentration of 6log10 CFU/mL UTI89) were then combined to a 3D tissue-engineered urothelium (UC) to recreate a 6-h infection period.
FIG 2
FIG 2
Hierarchical profiling of PAC catabolism between donors in gut effluents and dialysates after a 14-day treatment. Heatmap displaying the transformed intensity of the PAC catabolites remaining in gut effluents and dialysates after 14 days of PAC-rich extract treatment and following a 2-h UPEC exposure, as determined by UPLC-QToF in negative ionization. BA = Benzoic Acid; 3-HPVA = 5-(3′-hydroxyphenyl)valeric acid; 35-DHBA = 3,5-dihydroxybenzoic acid; ProA2 = Procyanidin A2; ProB2 = Procyanidin B2; HPP-2-ol = 1-(Hydroxyphenyl)-(2′,4′,6′-trihydroxyphenyl)-propan-2-ol; 2-HBA = 2-hydroxybenzoic acid; 3-HPPA = 3-(3′-hydroxyphenyl)propanoic acid;, 4-DHPVA = 5-(3′,4′-dihydroxyphenyl)valeric acid; ProA1 = Procyanidin A1; 34-DHPP-2-ol = 1-(Dihydroxyphenyl)-3-(2′,4′,6′-trihydroxyphenyl)-propan-2-ol; ProB1 = Procyanidin B1; 34-DHPVL = 5-(3′,4′-dihydroxyphenyl)-γ-valerolactone; 34-DHBA = 3,4-dihydroxybenzoic acid; 4_HPAA = 2-(4′-hydroxyphenyl)acetic acid; 34-DHPPA = 3-(3′,4′-dihydroxyphenyl)propanoic acid; 4-HPPA = 3-(4′-hydroxyphenyl)propanoic acid.
FIG 3
FIG 3
TWIN-SHIME combining dialysis cassette device as a model of short-term UPEC’s gut reservoir (A) Number of viable-culturable UPEC (log10 CFU/mL) remaining in the dialysate after a 2-h exposure with the PAC treated/non-treated metabolome of the transverse colon. A condition “no microbiota” was also performed by introducing dialysis cassettes in jars with digestive medium deprived of microbiota. Significant differences between PAC treatment and control are indicated with P ≤ 0.05 (*) or P ≤ 0.01 (**), as determined by the Friedman post hoc Wilcoxon test. (B) The microbial composition (%) of the 20 most abundant genera is shown. “Dial” represents the day of addition of dialysis cassettes containing UPEC in transverse colons of donors A and B, both during the control and PAC treatment. (C) Ratio-profile of short chain fatty acids (SCFA) for each treatment condition: before (-1 day), during addition of dialysis cassette “Dial,” and after addition (+1 day). Significant differences in production of acetate, butyrate and propionate were found between PAC treatment and control, P ≤ 0.001 (***), as determined by the Friedman post hoc Wilcoxon test.
FIG 4
FIG 4
Engineered bladder mucosa as a model of acute urinary tract infection. (A) Bladder mucosa were reconstructed and infected by UPEC dialysates. Tissues were fixed and immunolabelled 6 h after infection to detect cytokeratins (red fluoresecnce, urothelial cells). UPEC were detected by GFP (green) fluorescence. Large number of bacteria at the surface or in the urothelial cells were visible and indicated by white arrows. (B) Number of viable-culturable UPEC (log10 CFU/mL) unattached to UC (planktonic) after a 6-h infection. (C) Number of viable-culturable UPEC (log10 CFU/mL) remaining attached to UC after a 6-h infection. A condition “no microbiota” was also performed by testing UPEC dialysate not exposed to the gut microbiota. Significant differences between PAC treatment and control are indicated with P ≤ 0.01 (**), as determined by the Friedman post hoc Wilcoxon test.
FIG 5
FIG 5
Profiling of UPEC main virulence genes expression from the gut reservoir to urothelium. (A) Heatmap displaying the log2 fold change UPEC virulence genes expression according to the ecosystem exposure (colonic dialysate, planktonic and adhered bacteria to UC), the microbial metabolome origin and the treatment. Induction (log2 fold change expression ≥ 1) is denoted in shade of red, and repression (≤ -1) in shade of green, as determined by RT-qPCR. Samples with failed amplification are displayed in gray. (B) Selection of genes from dialysis cassettes remaining significantly different between control and PAC conditions are indicated with P ≤ 0.05 (*) or P ≤ 0.01 (**), as determined by the Friedman post hoc Wilcoxon test. (C) Selection of genes from adhered UPEC treated with PAC that are significantly different between donors A and B, as determined by the Friedman post hoc Wilcoxon test.
FIG 6
FIG 6
Profiling of UPEC iron-acquisition genes expression from the gut reservoir to urothelium. (A) Heatmap displaying the log2 fold change UPEC iron-acquisition genes expression according to the ecosystem exposure (colonic dialysate, planktonic and adhered bacteria to UC), the microbial metabolome origin and the treatment. Induction (log2 fold change expression ≥ 1) is denoted in shade of red and repression (≤ -1) in shade of green, as determined by RT-qPCR. Samples with failed amplification are displayed in gray. (B) Heatmap displaying the transformed intensity of the metallophores metabolites remaining in UC medium after 6 h of UPEC infection, as determined by Reverse-Phase Liquid Chromatography (RPLC) positive. (C) Selection of genes from dialysis cassettes remaining significantly different between control and PAC conditions are indicated with P ≤ 0.05 (*) or P ≤ 0.01 (**), as determined by the Friedman post hoc Wilcoxon test.

References

    1. Geerlings SE. 2016. Clinical presentations and epidemiology of urinary tract infections. Microbiol Spectr 4:4.5.03. doi:10.1128/microbiolspec.UTI-0002-2012. - DOI - PubMed
    1. Nielsen KL, Stegger M, Kiil K, Godfrey PA, Feldgarden M, Lilje B, Andersen PS, Frimodt-Moller N. 2017. Whole-genome comparison of urinary pathogenic Escherichia coli and faecal isolates of UTI patients and healthy controls. Int J Med Microbiol 307:497–507. doi:10.1016/j.ijmm.2017.09.007. - DOI - PMC - PubMed
    1. Yamamoto S, Tsukamoto T, Terai A, Kurazono H, Takeda Y, Yoshida O. 1997. Genetic evidence supporting the fecal-perineal-urethral hypothesis in cystitis caused by Escherichia coli. J Urol 157:1127–1129. doi:10.1016/S0022-5347(01)65154-1. - DOI - PubMed
    1. Flores-Mireles AL, Walker JN, Caparon M, Hultgren SJ. 2015. Urinary tract infections: epidemiology, mechanisms of infection and treatment options. Nat Rev Microbiol 13:269–284. doi:10.1038/nrmicro3432. - DOI - PMC - PubMed
    1. Chen Y-H, Ko W-C, Hsueh P-R. 2013. Emerging resistance problems and future perspectives in pharmacotherapy for complicated urinary tract infections. Expert Opin Pharmacother 14:587–596. doi:10.1517/14656566.2013.778827. - DOI - PubMed

MeSH terms